



 Arguments









Where is global warming going?
Posted on 20 April 2010 by John Cook
The recent discussion on heat content got me thinking about an alternative way to communicate where all the heat content from global warming is going. Inspired by the elegant methods of Information is Beautiful, here is a visual depiction of how much global warming is going into the various components of our climate system:
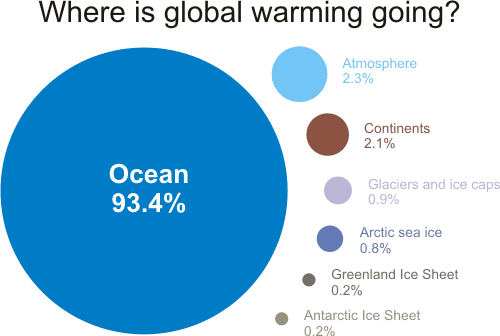
Figure 1: components of global warming for the period 1993 to 2003 calculated from IPCC AR4 5.2.2.3.
The percentages were calculated from Figure 5.4 from Section 5.2.2.3 of the IPCC 4th Assessment Report (h/t to Humanity Rules for the heads up). The IPCC graph shows changes in energy content for two different periods: 1961 to 2003 and 1993 to 2003.
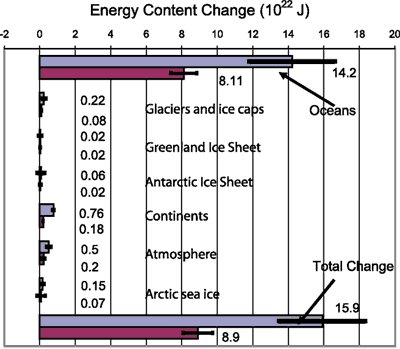
Figure 2: Energy content changes in different components of the Earth system for two periods (1961–2003 and 1993–2003). Blue bars are for 1961 to 2003, burgundy bars for 1993 to 2003 (IPCC AR4 5.2.2.3).
I opted for the latter period 1993 to 2003 as the last decade should be more indicative of recent trends. Of course, what would be even more interesting is data up to 2008 but hopefully I'll get an opportunity to update the graphic at a later date. The ocean heat figure of 93.4% is almost certainly an underestimate as it only includes ocean heat down to 700 metres (Levitus 2005).
Lastly, let me head the nitpickers off at the pass. The percentage figures actually add up to 99.9%. I could've gone to several more unsightly decimal places to get it closer to exactly 100% but I figured the maths nerds will just have to deal
UPDATE 22 April 2010: AndyS correctly points out that my graphic incorrectly scales the circles by the diameter rather than the area. Apologies for the error, this is my first attempt at fancy shmancy Information is Beautiful style graphics and didn't quite think it through. Have updated the graph so the contribution to each component is represented by the area, not the diameter. Thanks to AndyS for spotting the error (I quite enjoyed this exercise and plan to do similar style graphics down the track).








just read this article and comments. With regard to the hypothetical photovoltaic IR panel, it would work if it was cooled below the temperature of the emitting body (the earth's surface, in this case.) PV panels work because they are cooler than the Sun's surface, which is where the light originates.
p.s. With regard to my previous comment. The temperature difference requirement applies only to thermal radiation.
A PV panel can absorb light from a light source like an LED or a fluorescent light without having ot be cooler than the light source. This is because the light from those sources is not being produced by a thermal process.
WRyan @94&95, that is the trap of thinking in terms of the temperature of the emitting source rather than the energy of the photon. The Sun also emitts IR radiation, for example. A PV cell behind such a filter would react in the same way to the IR photons from the Sun as it would to IR photons from any other source. Light from an LED or fluorescent light is carried by high energy photons, even though the method of emission is not thermal.
WRyan... how does the photon know the temperature of the object it would eventually impact if it were emitted? I mean... it could have to travel hundreds of light years to get there. Say a photon emitted from a distant star is going to hit the International Space Station, but if the station hadn't been constructed (hundreds of years after the photon was emitted) then it would have just passed through empty space and continued on to hit the Sun (which in this hypothetical is hotter than the emitting star). How does the photon instantaneously 'know' something that won't happen for hundreds of years? For that matter... how is it NOT emitted just because it will eventually strike a warmer object?
You should really publish on this. Among other things it allows faster than light communication. Aim a laser at a target location and then raise or lower the temperature of that target to higher/lower than the laser's temp and the laser will instantaneously stop emitting when the temperature is higher... regardless of the distance involved. Messages could thus be 'transmitted' instantly to the laser end by changing the temperature at the target end.
I' vey late to the party but I feel compelled to say it as we are using this image for a course: The areas of the disks still don't match the percentage values shown (despite being marked as fixed). I would say the 2.3% atmosphere disk is about twice too big relative to the 93.4% ocean one. Looks like this was drawn by hand instead of with software. Happy to help if you want a correctly updated version.
benoit:
Doing a screen check on the image (not extremely accurate), I tend to agree that the Ocean and Atmosphere circles may still be a bit off.
...but I don't see a factor of two for Atmosphere. I tried checking it two ways, using an enlarged version of the figure that made the Ocean circle 141mm in diameter:
In either case, the smaller circles all seemed OK - one or two tenths of a mm adjustment in radius (so, within the crudeness of my method).
In the first case, (sum assumed correct), the Ocean circle needed to be 0.3mm larger in radius (0.7mm larger in diameter). The Atmosphere circle needed more adjustment: 2.4mm smaller in radius (4.8mm smaller in diameter). In the second case, Ocean is assumed correct, and Atmosphere again needs to be 2.4mm smaller in radius (but 4.9mm in diameter, due to a slightly larger version of 2.4). That's a 5mm diameter change on an enlargement that makes the current Atmosphere circle 27mm in diameter.
The change in radius (or diameter) for Atmosphere is about 1/6 of the current radius. The area error is more significant: it's nearly 50% too large.
How did you get a factor of two?
Hi Bob, you're right: I just eye-balled it was too big and overestimated the overestimate :)
I did the plot in Julia with code here: https://gist.github.com/briochemc/0055a26ba730f72f11161ec328f30efa and images available in comment. Please feel free to udpate here :)