


 Arguments


State of the climate: How the world warmed in 2018
Posted on 22 January 2019 by Zeke Hausfather
This is a re-post from Carbon Brief
The climate data for 2018 is now mostly in, though the ongoing shutdown of the US government has caused some datasets to be delayed.
In this article, Carbon Brief explains why last year proved to be so remarkable across the oceans, atmosphere, cryosphere and surface temperature of the planet.
A number of records for the Earth’s climate were set in 2018:
- It was the warmest year on record for ocean heat content, which increased markedly between 2017 and 2018.
- It was the fourth warmest year on record for surface temperature.
- It was the sixth warmest year in the lower troposphere – the lower part of the atmosphere.
- Greenhouse gas concentrations reached record levels for CO2, methane, and nitrous oxide.
- Sea ice was well below the long-term average at both poles for most of the year. The summer Arctic sea ice minimum was the sixth lowest since records began in the late 1970s.
Warmest year on record in the oceans
Last year was the warmest on record for the heat content of the world’s oceans. Ocean heat content (OHC) has increased by around 370 zettajoules – a billion trillion joules – since 1955. The heat increase in 2018 alone compared to 2017 – about 9 zettajoules – is around 18 times more than the total energy used by everyone on Earth in 2018.
Human-emitted greenhouse gases trap extra heat in the atmosphere. While some of this warms the Earth’s surface, the vast majority – around of 93% – goes into the oceans. About two thirds of this accumulates in the top 700 metres, but some also ends up in the deep oceans. Annual OHC estimates between 1955 and present for both the upper 700m and 700m-2000m depths of the ocean are shown in the figure below.
Annual global ocean heat content (in zettajoules – billion trillion joules, or 10^21 joules) for the 0-700 metre and 700-2000 metre layers. Data from Cheng et al 2017, updated through the end of 2018. Chart by Carbon Brief using Highcharts.
In many ways, OHC represents a much better measure of climate change than global average surface temperatures. It is where most of the extra heat ends up and is much less variable on a year-to-year basis than surface temperatures.
Changes in the amount or rate of warming are much easier to detect in the OHC record than on the surface. For example, OHC shows little evidence of the slowdown in warming in the mid-2000s. It also shows a distinct acceleration after 1991, matching the increased rate of greenhouse gas emissions over the past few decades.
Just about every year since 1991 has set a new OHC record, showing that heat has continued to accumulate in the Earth system as concentrations of atmospheric greenhouse gases have increased.
As Carbon Brief discussed in a recent guest post, estimates of OHC published over the past few years represent a large upward revision of past estimates. They also now agree with projections made by global climate models.
Fourth warmest year on the surface
Global surface temperatures in 2018 were the fourth warmest on record since 1850, when global temperatures can first be calculated with reasonable accuracy. Temperatures in 2018 were between 0.9C and 1.1C warmer than temperatures in the late 19th century (between 1880 and 1900), depending on the temperature record chosen. Temperatures were dragged down a bit by a modest La Niña event earlier in the year, while the currently emerging modest El Niño event will mainly impact temperatures in 2019.
Global surface temperatures are reported by a number of different international groups, including NASA, NOAA, Met Office Hadley Centre/UEA, Berkeley Earth and Cowtan and Way. Copernicus/ECMWF also produces a surface temperature estimate based on a combination of measurements and a weather model – an approach known as “reanalysis”.
These records are created by combining ship- and buoy-based measurements of ocean sea surface temperatures with temperature readings of the surface air temperature from weather stations on land.
Unfortunately, the on-going US government shutdown has delayed the reporting of December 2018 temperatures, so the full 2018 values in the figures below are preliminary estimates. They use January-November data, but estimate December based on the change between November and December in the Copernicus/ECMWF dataset – which has not been delayed by the shutdown. Carbon Brief will update this article once the final 2018 values are released.=
The chart below compares the annual global surface temperatures from these different groups since 1850, though some records – NASA and NOAA – do not start until 1880, and the Copernicus/ECMWF reanalysis dataset begins in 1979. Values are shown relative to a common baseline period, the 1981-2010 average temperature for each series. [Click the figure legend to show or hide different temperature records.]
Annual global mean surface temperatures from NASA GISTemp, NOAA GlobalTemp, Hadley/UEA HadCRUT4, Berkeley Earth, Cowtan and Way, Copernicus/ECMWF and Carbon Brief’s raw temperature record (see below). Anomalies plotted with respect to a 1981-2010 baseline; 2018 values are preliminary. Chart by Carbon Brief using Highcharts.
The global warming seen is not due to any adjustments made to the underlying temperature records. The figure above includes a “raw records” line (shown as a dotted line) calculated by Carbon Brief using data not subject to any adjustments or corrections for changes in measurement techniques. These adjustments make little difference to the record after 1950. Before then, the adjusted temperature recordsactually show less warming than the raw data.
The figure below shows surface temperatures since 1970, a period during which atmospheric greenhouse gas concentrations have been rapidly increasing. While 2018 is not quite as warm as the past three years, it is in-line with the longer-term warming trend seen in the data.
Annual global mean surface temperatures from NASA GISTemp, NOAA GlobalTemp, Hadley/UEA HadCRUT4, Berkeley Earth, Cowtan and Way, Copernicus/ECMWF and Carbon Brief’s raw temperature record (see below). Anomalies plotted with respect to a 1981-2010 baseline; 2018 values are preliminary. Chart by Carbon Brief using Highcharts.
Short-term variability in temperature records is mostly due to the influence of El Niño and La Niña events, which have a short-term warming or cooling impact on the climate. Other dips are associated with large volcanic eruptions. The longer-term warming of the climate is due to increases in atmospheric CO2 and other greenhouse gases emitted from human activity.
To assess the effects of El Niño and La Niña on the surface temperature record, Carbon Brief has produced an estimate of what temperatures would be in the absence of these events. The figure below shows estimated temperatures with El Niño removed; see the methods section at the end of the article for details on the approach used. The Copernicus records is not included in the figure, as it does not have data available prior to 1979.
Annual global mean surface temperatures with the effect of El Niño and La Niña (ENSO) events removed using the Foster and Rahmstorf (2011) approach, see methods at the end for details. Chart by Carbon Brief using Highcharts.
Removing the effects of El Niño from the temperature record makes 2017 rather than 2016 the warmest year on record for most temperature series, as 2016 temperatures benefited from a large El Niño event.
Temperatures for 2018 are bumped up modestly with the cooling effects of the early-2018 La Niña event removed, and 2018 would supplant 2015 as the third warmest year. Once El Niño effects are remove, the impact of major volcanic eruptions – such as those in 1982 and 1991 – are also much easier to identify in the temperature record.
Surface temperatures in line with climate models
Climate models provide physics-based estimates of future warming given different assumptions about future emissions, greenhouse gas concentrations and other climate-influencing factors.
Model estimates of temperatures prior to 2005 are a “hindcast” using known past climate influences, while temperatures projected after 2005 are a “forecast” based on an estimate of how things might change.
The figure below shows the range of individual models forecasts featured in the Intergovernmental Panel on Climate Change (IPCC’s) Fifth Assessment Report – known as CMIP5 models – between 1970 and 2020 with grey shading and the average projection across all the models shown in black. Individual observational temperature records are represented by coloured lines.
Twelve-month running average of global mean surface temperatures from CMIP5 models and observations between 1970 and 2020. Models use RCP4.5 forcings after 2005. They include sea surface temperatures over oceans and surface air temperatures over land to match what is measured by observations. Anomalies plotted with respect to a 1981-2010 baseline. Chart by Carbon Brief using Highcharts.
While global temperatures were running a bit below warming projected by climate models between 2005 and 2014, the last few years have been pretty close to the model average. This is particularly true for globally complete temperature records like NASA, Cowtan and Way, Berkeley and the Copernicus reanalysis.
Sixth warmest in the troposphere
In addition to surface measurements over the world’s land and oceans, satellite microwave sounding units have been providing estimates of global lower atmospheric temperatures – the lower troposphere – since 1979.
The records produced by Remote Sensing Systems (RSS) and the University of Alabama, Huntsville (UAH) show 2018 as the sixth warmest year on record. The two records are shown in the figure below – RSS in red and UAH in blue. The surface record from NASA GISTemp is also shown for reference.
Global average lower troposphere temperatures from RSS version 4 (red) and UAH version 6 (blue) relative to a 1981-2010 baseline. The surface temperature record from NASA GISTemp is shown for reference by a dotted black line. Chart by Carbon Brief using Highcharts.
These satellites measure the temperature of the lower troposphere and capture average temperature changes around 5km above the surface. This region tends to be influenced more strongly by El Niño and La Niña events than the surface and satellite records show correspondingly larger warming or cooling spikes during these events. This is why, for example, 1998 shows up as one of the warmest years in satellites, but not in surface records.
The two lower tropospheric temperature records – UAH and RSS – show large differences after the early 2000s. RSS shows an overall rate of warming quite similar to surface temperature records, while UAH shows considerably slower warming in recent years than has been observed on the surface. Both are subject to some large uncertainties and have seen large adjustments in recent years that have warmed RSS and cooled UAH compared to prior versions of each record.
Greenhouse gas concentrations rising
Greenhouse gas concentrations reached a new high in 2018, driven by human emissions from fossil fuels, land use and agriculture.
Three greenhouse gases – CO2, methane (CH4) and nitrous oxide (N2O) – are responsible for the bulk of additional heat trapped by human activities. CO2 is by far the largest factor, accounting for roughly 50% of the increase in “radiative forcing” since the year 1750. Methane accounts for 29%, while nitrous oxide accounts for around 5%. The remaining 16% comes from other factors including carbon monoxide, black carbon and halocarbons, such as CFCs.
Human emissions of greenhouse gases have increased atmospheric concentrations of CO2, methane and nitrous oxide to their highest levels in at least a few million years – if not longer. The figure below shows concentrations of these greenhouse gases – in parts per million (ppm) for CO2 and parts per billion (ppb) for methane and nitrous oxide – from the early 1980s through September 2018 (the most recent data currently available).
Global concentrations of CO2, methane (CH4) and nitrous oxide (N2O). Based on data from NOAA’s Earth Systems Research Laboratory. Chart by Carbon Brief using Highcharts.
Sea ice remains low
Sea ice spent much of early 2018 at record lows in the Arctic and quite low in the Antarctic. It recovered somewhat at both poles by mid-year, but by the end of the year had returned to record lows in the Antarctic and is currently the third lowest on record in the Arctic. The Arctic spent most of the year well below the historical range over the 1979-2010 period and saw the sixth lowest summer minimum since records began in the late 1970s
The figure below shows both Arctic and Antarctic sea ice extent in 2018 (solid red and blue lines), the historical range in the record between 1979 and 2010 (shaded areas) and the record lows (dotted black line).
Arctic and Antarctic daily sea ice extent from the US National Snow and Ice Data Center. The bold lines show daily 2018 values, the shaded area indicates the two standard deviation range in historical values between 1979 and 2010. The dotted black lines show the record lows for each pole. Chart by Carbon Brief using Highcharts.
Sea-ice extent only tells part of the story about changes at the poles; thickness (and volume) are also important variables, though they are more difficult to measure. The Pan-Arctic Ice Ocean Modeling and Assimilation System (PIOMAS) project provides estimates of sea-ice volume since 1979, shown in the figure below.
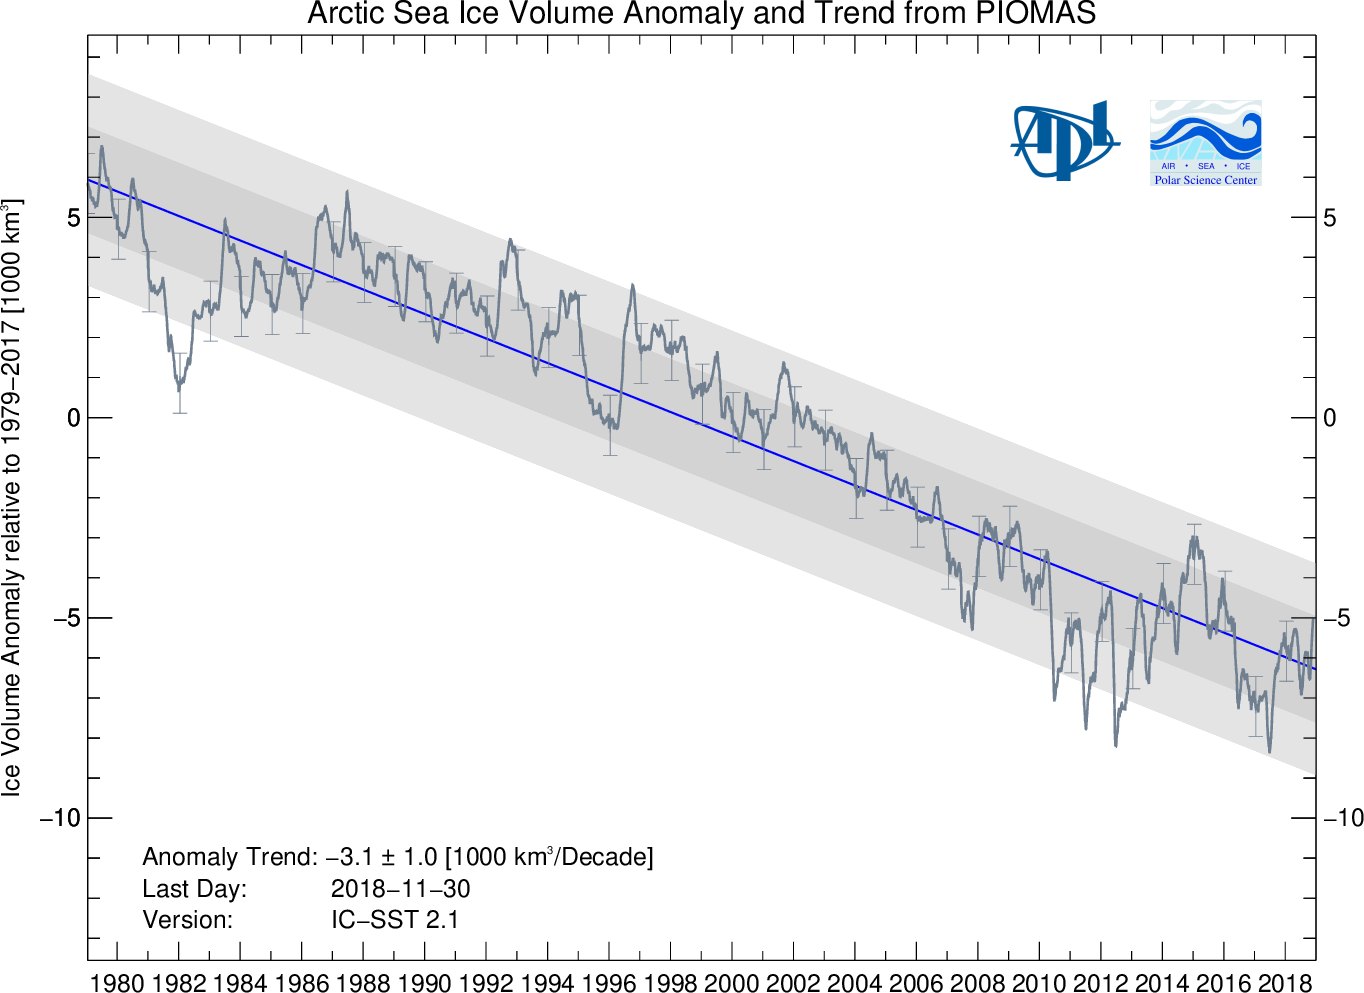
Arctic sea-ice volume anomalies from 1979 through 2018 from PIOMAS.
Sea-ice volume shows a clear downward trend. While some individual months have lower or higher values than others, the range in 2018 to date is consistent with the long-term decline in Arctic sea-ice volume. Unfortunately, due to the government shutdown in the US, sea-ice volume estimates for December 2018 are not yet available.
Looking ahead to 2019 surface temperatures
While a modest La Niña event helped drag 2018 down to being the fourth warmest year on record, modest El Niño conditions have developed over the past few months and are expected to persist through late spring. This will help bump up 2019 temperatures, all things being equal.
Both the UK Met Office and NASA’s Dr Gavin Schmidt have already predicted what temperatures might look like in 2019. Both suggest that 2019 will most likely be warmer than 2018, with a best guess of a second place finish and a range of anywhere between the warmest year and the fifth warmest year on record.
The figure below, by Schmidt, shows 1980-2017 temperatures in black, a 2018 projection made at the end of 2017 in dark blue, a 2018 projection using data through October in light blue, and a 2019 projection based on modelled future El Niño conditions in green.
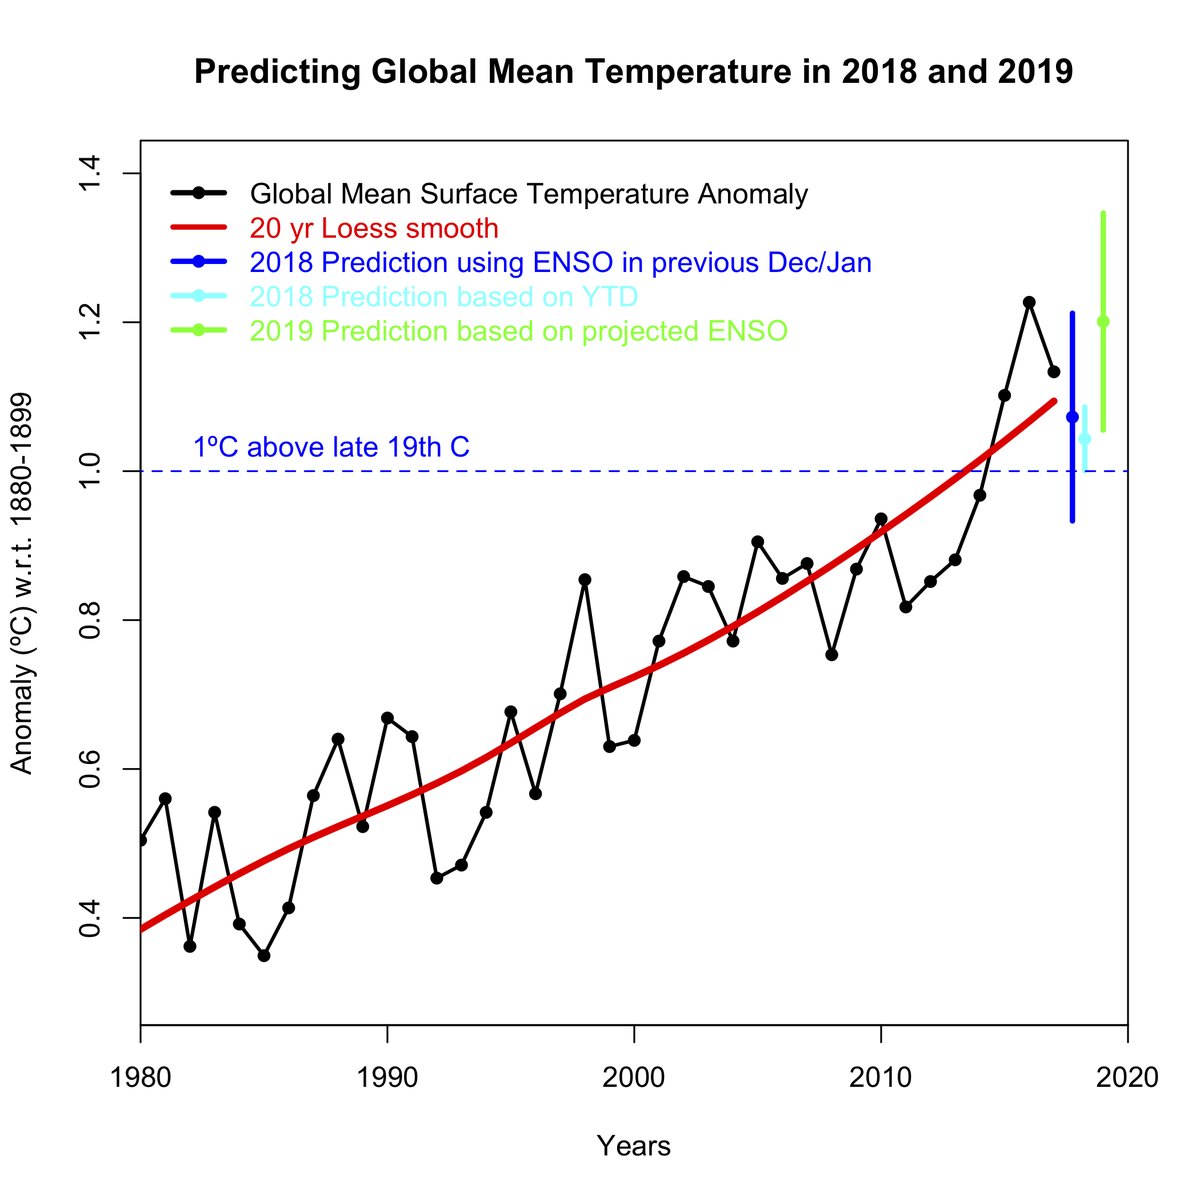
Temperature projections for 2018 and 2019 provided by Dr Gavin Schmidt in late November 2018, using data from NASA GISTemp.
Methods
Carbon Brief has produced a raw global temperature record using unadjusted ICOADSsea surface temperature measurements gridded by the UK Hadley Centre and raw land temperature measurements assembled by NOAA in version 4 of the Global Historical Climatological Network (GHCN).
Raw land temperatures were calculated by assigning each station to a 5×5 latitude/longitude grid box, converting station temperatures into anomalies relative to a 1971-2000 baseline period, averaging all the anomalies within each grid box for each month, and averaging all grid boxes for each month weighted by the land area within each grid box. Raw combined land/ocean temperatures were estimated by averaging raw land and ocean temperatures weighted by the percent of the globe covered by each. The resulting global temperature estimate was “rebaselined” to 1981-2010 to be comparable to other estimates shown.
For the plot showing temperatures without El Niño/La Niña, the effect of ENSO was removed from each surface temperature record for each month using an approach adapted from Foster and Rahmstorf (2011). A regression model was used to estimate the impact of ENSO on each group’s temperature series from January 1950 through December 2018, using a three month lagged Oceanic Niño Index. This estimated ENSO impact was then subtracted from the temperature series to calculate what the temperature records might look like in the absence of an ENSO signal.


So we're at 2045-2050 where we will hit the 2°C above pre-industrial baseline. 1.5°C probably by 2030. Not much time left. I'd say the oncoming decade is DECISIVE for anything like Paris.
Global warming will happen faster than we think
That’s how fast the carbon clock is ticking