Climate Science Glossary

Term Lookup

Enter a term in the search box to find its definition.

Settings

Use the controls in the far right panel to increase or decrease the number of terms automatically displayed (or to completely turn that feature off).

Term Lookup

Settings


All IPCC definitions taken from Climate Change 2007: The Physical Science Basis. Working Group I Contribution to the Fourth Assessment Report of the Intergovernmental Panel on Climate Change, Annex I, Glossary, pp. 941-954. Cambridge University Press.

Home Arguments Software Resources Comments The Consensus Project Translations About Support

Bluesky Facebook LinkedIn Mastodon MeWe

Twitter YouTube RSS Posts RSS Comments Email Subscribe


Climate's changed before
It's the sun
It's not bad
There is no consensus
It's cooling
Models are unreliable
Temp record is unreliable
Animals and plants can adapt
It hasn't warmed since 1998
Antarctica is gaining ice
View All Arguments...


Username
Password
New? Register here
Forgot your password?

Latest Posts

Archives

Arctic sea ice breaks lowest extent on record

Posted on 28 August 2012 by John Hartz

This article is based on a media advisory posted by the US National Snow and Ice Data Center (NSIDC) on Aug 27, 2012.

green line

Arctic sea ice cover melted to its lowest extent in the satellite record yesterday, breaking the previous record low observed in 2007. Sea ice extent fell to 4.10 million square kilometers (1.58 million square miles) on August 26, 2012. This was 70,000 square kilometers (27,000 square miles) below the September 18, 2007 daily extent of 4.17 million square kilometers (1.61 million square miles).
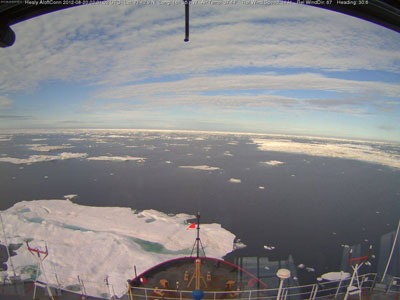
Photo of scattered Arctic sea ice flows

Scattered ice floes are seen from the bridge of the RV Healy on August 20, 2012 northwest of Barrow, Alaska. Arctic sea ice fell to its lowest daily extent in the satellite record on Sunday, August 26, 2012. —Credit: U.S. Coast Guard


NSIDC scientist Walt Meier said, "By itself it's just a number, and occasionally records are going to get set. But in the context of what's happened in the last several years and throughout the satellite record, it's an indication that the Arctic sea ice cover is fundamentally changing."

According to NSIDC Director Mark Serreze, "The previous record, set in 2007, occurred because of near perfect summer weather for melting ice. Apart from one big storm in early August, weather patterns this year were unremarkable. The ice is so thin and weak now, it doesn't matter how the winds blow."

"The Arctic used to be dominated by multiyear ice, or ice that stayed around for several years," Meier said. "Now it's becoming more of a seasonal ice cover and large areas are now prone to melting out in summer."

With two to three weeks left in the melt season, NSIDC scientists anticipate that the minimum ice extent could fall even lower.

In 2007, Arctic sea ice extent reached an all-time low in the satellite record that began in 1979. Arctic sea ice follows an annual cycle of melting through the warm summer months and refreezing in the winter. While Arctic sea ice extent varies from year to year because of changeable weather conditions, ice extent has shown a dramatic overall decline over the past thirty years. The pronounced decline in summer Arctic sea ice over the last decade is considered a strong signal of long-term climate warming.

NSIDC will release a full analysis of the melt season in early October, once monthly data are available for September.

0 0

Printable Version  |  Link to this page

Comments

Comments 1 to 29:

  1. When looking at ice cover during the satellite period I think we miss the big picture. Whaling records since 1880 together with aircraft and submarine records during the cold war make it pretty clear that prior to 1960 arctic sea ice extent never got below 8 million square km. The area of the Arctic Ocean including Hudson Bay is 14 million square km. Hudson bay accounts for about 4 million of these and has (at least since Europeans have been observing it) always been seasonally ice free. This implies that the vast majority of the rest of the Arctic Ocean was permanently ice covered We are rapidly moving to a situation where this will only be true for parts of the Canadian Archipelago and the North coast of Greenland. If the modellers are right - and so far they have consistently underestimated the rate of melt - this will mean that by the end of the century we will have moved from a permanently ice covered ocean to one which is permanently ice free. The mind boggles at what this may mean for NH weather.
    0 0
  2. Oops - I got confused between the area that Hudson Bay drains and the area of the Bay itself. So I rather overstated the case. Nonetheless the reduction in Sea Ice is massive.
    0 0
  3. Hi, SW!
    "If the modellers are right - and so far they have consistently underestimated the rate of melt - this will mean that by the end of the century we will have moved from a permanently ice covered ocean to one which is permanently ice free."
    Well, that's not exactly right. Based on data through 2005, Wieslaw Maslowski predicted in March of 2006 that the Arctic sea ice could essentially by ice-free (less than 1 million square kilometers) by 2016 ± 3 years (Slide 6, here). A more topical discussion of his model can be found here. This model prediction is still on-target, as events we witness today attest.
    0 0
  4. It will be interesting to see trends in the level of decline in the volume of sea ice and growth in the area covered by 1 year ice. These measures could provide an indication of the speed and magnitude of future sea ice loss. Present indications are that by mid-September 2012 the extent of sea-ice could be below 4 million sq.km. which would certainly be food for thought, particularly for those “skeptics” who deny sea ice loss. Of immediate concern is growth in the area of the Arctic Ocean exposed to and absorbing, rather than reflecting solar energy. It seems likely that this could contribute to warming of sea water and troposphere which reduces the period when sea ice is formed and the Greenland Ice Sheet remains stable.
    0 0
  5. DB: I believe SW was referring to year-round ice free rather than just at Summer minimum. I have a question about the photo for the blog post -- I would have expected (from looking at the summaries of satellite data)there to be pretty much zero sea ice Northwest of Barrow on Aug 20. Sailboats zipped through both Arctic passages in 2010, I think, and I would expect ice like that in the picture to potentially impede them. I guess I'm wondering if there's a good source of images that allow one to learn to interpret satellite data (e.g. <15% sea ice) in terms of what it actually looks like when you're there.
    0 0
  6. I believe I understood what SW was referring to. But perhaps my unfinished thought didn't fully come across. If the summer ice is disappearing per Maslowski's model, then what is the likelihood that seasonal ice would still persist until another 8-9 decades? Eisenman & Wettlauffer, 2008: Non-linear Arctic Ice Threshold Behavior examined the non-linear dynamics of the Arctic in the presence of seasonal ice. What they found is that the ice, once seasonal ice is lost and heating continues, behaves in a nonlinear fashion with a bifurcation state existing. Translated, this means that the Arctic system either supports a full-ice, or a no-ice, solution as a stable state. If what we are witnessing is indeed the loss of the full-ice stable state, then Eisenman & Wettlauffer come into play. Given that we are in the presence of an energy imbalance at the TOA that is ongoing (plus we continue to make this imbalance worse with continuing CO2 releases) then the transition to a no-ice stable state may be swifter than any current model (even Maslowski's) can represent.
    0 0
  7. Steve L, It's hard to get a clear satellite shot, because there are always a lot of clouds, but the most recent clear shot I found of Barrow was 8/13, and it shows a ton of ice. This less clear but more recent shot from 8/23 has a lot of clouds but you can see the area around Barrow, and a whole lot of ice at sea there. The thing is, from the satellite images you can clearly see that this is below 15%, and yet it is still a lot of ice from a navigation point of view (and possibly/probably exemplary of the picture in the post above. from the deck of the Coast Guard ship -- but it's hard to say exactly where that ship was when the picture was taken). This year is a little unusual because ice has been hanging around the coast of Alaska, despite the extreme melt. This in turn has been messing up Shell Oil's plans to do exploratory drilling there. Whatever the cause, it may be an anomaly associated with this year, or one that will become a recurring pattern as part of "today's Arctic" (at least for a few years, since I think the Arctic is going to keep changing at warp speed until it reaches a bizarre, stable, ice-free state).
    0 0
  8. I assumed the area shown in the photo was the mass of ice which got separated from the main pack. Traces of that are actually still showing up on the satellite maps, and back on the 20th it was still fairly substantial. Most of the continued decline has been due to this large area of widely scattered ice continuing to melt out. Which is an important thing to consider about the ongoing declines... the lower the ice concentration the faster the ice melts. This is why the ice pack usually only has a low concentration around the edges. Once the concentration drops below a certain level the ice quickly melts and the solid pack behind it becomes the new edge... until that spreads out enough to melt down. There is thus a 'buffering' effect which protects the core ice pack. The storm at the beginning of the month scattered ice far and wide and thus removed this buffering effect for a large portion of the ice pack... allowing remarkably fast melt for August. As we see more storms and greater wave action from a more ice free Arctic this process will just continue to accelerate. Another note... the maps show that essentially 100% of the first year ice melted out this year. I don't know if that has ever happened before, but it certainly isn't common. Indeed, almost all of the second year ice is gone too... and a good portion of the remainder is very thin and broken up. This means that the multi-year ice is nearly the only ice which survived this year... and not all of that either. Further, even though the remaining mutli-year ice has been largely protected from being broken up by wave and storm action by the 'buffer' of younger ice around it this year... it is still thinning from warmer air and water temperatures. We can see this in the ongoing decline of ice volume. PIOMAS shows that maximum ice volume at the end of Winter has declined almost as much as minimum ice volume (despite area/extent being little changed). This suggests the possibility of a continuing trend leading to no ice year round in future decades as Steve L alluded to.
    0 0
  9. Will the loss of ice mass in the Arctic and on Greenland affect the tilt and or the wobble of tilt and if so what climate affect if any would there be ? . Thanks
    0 0
  10. Daved, short answer?....no. Though the mass of ice is large, it's not nearly large enough to affect the 'wobble' of the earth, nor its tilt. I don't ahve the numbers right here in front of me, but if you're interested, I can scare them up for you. To answer a bit more accurately, yes, there would be an infinitesimal change in the tilt and wobble, but literally *nothing* that would throw the Earth out of kilter.
    0 0
  11. Daved - the loss of ice from the polar regions will have an affect on Earth's rotation - slowing it down. Not that anyone would be able to notice because the effect is so minuscule. Think of an ice skater spinning and then pulling their arms in toward their body - it causes them to spin much faster, and conversely when they straighten out their arms their rate of rotation slows. The same deal applies to the Earth, melting polar ice (near the Earth's axis of rotation) and its redistribution into the ocean (away from the axis of rotation) slows Earth's rotation. As for wobble - it depends where most of the melt occurs, but if the West Antarctic disintegrates (as it has done in previous interglacials), then the Earth wobble will cause a greater-than-global-average sea level rise off the east coast of the USA.
    0 0
  12. If you look at http://nsidc.org/arcticseaicenews/ there is a curious anomaly, especially when you realize that we have passed the previous record for low ice extent and the the melt is proceeding like an elevator with it's cable cut. Look along the coast and note how much freezing is occurring. Go down on the right of the site and select August for previous years. Much less ice in previous years along the coast. This fits with the hypothesis that we are seeing the beginning of the reversal of the Polar Hadley cell. Air is being pulled off the rapidly cooling land around the Arctic ocean and is freezing coastal water. We probably have a 4 cell system at present. As the Arctic becomes more open, the rising air in the fall from the warmer ocean may be powerful enough to reverse the whole polar cell. We will then have a two cell system. Think what this will do to the wheat growing areas of the northern hemisphere. http://mtkass.blogspot.co.nz/2008/07/arctic-melting-no-problem.html
    0 0
  13. I've always used the website maintained by the Physics Dept, of the University of Bremen for a number of years now.. If you look at the graphs for the Arctic Sea ice extent over time you can see that the 2012 line has simply fallen off a cliff to be colloquial. I initially assumed it would show signs of reverting towards the mean, this simply hasn't happened. No doubt come the Equinox it will reverse direction but at the moment it is way out on its own. try this Link http://www.iup.uni-bremen.de:8084/ssmis/index.html
    0 0
  14. ok just that the GIS seems such a massive shift /loss of weight . I guess "wobble " is not very scientific , i guess there is a word for it Google here i come . thank guys .
    0 0
  15. Rob: Are you sure? My initial unconsidered reaction is that the loss of sea ice will have the essentially same effect on the earth's moment of inertia as it will on sea levels - i.e. to a first approximation zero. The water released by melting will be needed to fill up the hole left by the ice, so there will be no redistribution. When it comes to Greenland of course you have a point (at least over centennial timescales). (I may be completely wrong though - I've not thought it through properly.)
    0 0
  16. Kevin - I was referring to the land-based ice, not sea ice. Slightly off-topic I know.
    0 0
  17. (-Snip-)
    0 0
    Moderator Response: [DB] Please note (1) that the topic of this thread is Arctic sea ice breaks lowest extent on record, not PopespersonalClimateTheory and (2) this site's Comments Policy.
  18. It is the land ice that makes the difference!
    0 0
  19. For what it's worth, this is the area east of Scoresbysund, Greenland, lat 70, on Aug 23.
    0 0
    Moderator Response: [Sph] Image tag and actual URL repaired.
  20. Anyone seen any animations showing perennial sea-ice? Something like the video here except showing the recent events
    0 0
  21. #6 Daniel Bailey There is more to read about bifurcation, for example this one: Livina, Lenton: A recent Bifurcation in Arctic Sea-Ice Cover http://arxiv.org/pdf/1204.5445v1.pdf Of course there are a bunch of publications which do not agree with such a picture of unstable behavior between two or more stable systems. The question is, who is right, what will happen in the next few years. Will we really get summer or year around ice free conditions? If one takes the obvious facts into account. 1: Have a look at Piomas sea ice volume. There is a year to year loss of several hundred km3 of ice during all of the year. That means there is more melting in summer months than it is refreezing during the winter. Year after year we are starting with less volume. 2: switching from high to low albedo during melt allows for accumulation of more and more energy in the water. 3: former stratified layers of water in the arctic are mixing when ice cover is absent. Wind and waves have free access for this process, so salinity will increase lower temps needed for refreeze) and the arctic ocean will gain energy in deeper layers too. These point lead to a delay in refreezing in central and peripheral parts of the arctic, signs we may have seen already this year when the ocean round Nowaja Semlja got ice cover very late last season, and we possibly see this now, when melting is much stronger now than expected so late in summer. If the trend in volume is going on, we certainly reach a point soon, that will set conditions for more accumulation of energy in summer than necessary to melt all ice. When this threshold is reached, we do not only have nearly ice free conditions in summer, but refreezing may be delayed due to wind and mixing of water layers, that we hardly will see ice at all. This final progression to ice free conditions year around will possibly occur very fast, during only a few years.
    0 0
  22. Update - Extent has now dropped below 4 million km^2 and area is just a little above 2.5 million km^2. It will be interesting to see what the August PIOMAS volume update shows. I'm guessing it will have volume below 4000 km^3. Popes: "It is the land ice that makes the difference!" Melting land ice can have a major impact on sea level rise. However, that is not the only 'difference' of note. Loss of sea ice results in water absorbing more sunlight... which causes warmer water... which causes (amongst other things) sea level rise. Likewise the loss of the arctic ice cover will change the temperature gradient at the pole... which will alter weather patterns for the northern hemisphere. Read. Learn. Then speak.
    0 0
  23. it is very possible that you are right CBDunkerson with 4 square kilometer of ice in september. Taking into account that we roughly loose 1 km3 / year we have 4 years to go, which should remind us about Maslowskis prediction from 2006, that if the current trend continues, we will have near zero sea ice cover from 2016 +/- 3 years. That was a pretty god shot. http://neven1.typepad.com/.a/6a0133f03a1e37970b016769050b57970b-pi from: http://neven1.typepad.com/blog/2012/08/piomas-august-2012.html
    0 0
  24. Jake try this link for animation 2003 to April 2012 Johnb "Hybrid"(AMSR-E/SSMIS) Animation of Arctic sea ice concentration, Jan 2003 to April 2012;
    0 0
  25. Moderators, forgive me if this seems to be somewhat off topic. I'm curious to know when the commentators believe that the Arctic will be ice free during the summer; for about a week in duration; not counting a band of ice north of Canada and Greenland.
    0 0
  26. villabolo @25, My estimate up to about a month ago was 2030 +/- 5 years. Unsurprisingly, the current melt season is giving me reason to consider serious revision of that estimate. However, I think it inappropriate to significantly revise predictions based on just one melt season so no revision till at least this time next year.
    0 0
  27. villabolo, that likely depends on how big a 'band'... the ice is currently constrained to an area "north of Canada and Greenland". Given the sharp drops in ice volume in 2007, 2010, and now 2012 it seems inescapable to me that we will see 'virtually ice free' conditions this decade... likely within the next five years. The only significant ice volume remaining is the mass of multi-year ice along the northern edge of the Canadian archipelago. The argument for the ice holding out longer has been that this thick older ice will be highly resistant to melt... but I don't buy it. Every time we've seen the ice melt back to the multi-year edge that thick ice has then been broken up by wave action and melted in short order. It is happening right now on the western edge of the archipelago. To me it looks like the only thing which keeps the multi-year ice from melting each year is the protective 'buffer' of thinner ice around it. Once that is gone the multi-year ice is actually quite vulnerable. It is thick enough to not melt out from air and water temperature, but when exposed to waves it breaks up into chunks small enough to melt.
    0 0
  28. CBD - I agree with you. There are very clearly some important physical aspects still missing from the Arctic sea ice models.
    0 0
  29. One physical aspect to keep in mind (from discussion at Neven's ASI blog) is that as the freshwater lens underneath the floes has thinned, the thickest remaining sea ice is exposed to ever warmer waters coming up from below due to the fact that thicker ice rides lower in the water. As this lens suffers destratification due to turbidity and storms, the enormous heat contained in the deeper layers is brought into closer proximity to the remaining ice.
    "In the end, it will just melt away quite suddenly."
    - Arctic ice expert Peter Wadhams, 12 December 2007
    0 0

You need to be logged in to post a comment. Login via the left margin or if you're new, register here.


The Consensus Project Website

THE ESCALATOR

(free to republish)


© Copyright 2024 John Cook
Home | Translations | About Us | Privacy | Contact Us