Climate Science Glossary

Term Lookup

Enter a term in the search box to find its definition.

Settings

Use the controls in the far right panel to increase or decrease the number of terms automatically displayed (or to completely turn that feature off).

Term Lookup

Settings


All IPCC definitions taken from Climate Change 2007: The Physical Science Basis. Working Group I Contribution to the Fourth Assessment Report of the Intergovernmental Panel on Climate Change, Annex I, Glossary, pp. 941-954. Cambridge University Press.

Home Arguments Software Resources Comments The Consensus Project Translations About Support

Twitter Facebook YouTube Mastodon MeWe

RSS Posts RSS Comments Email Subscribe


Climate's changed before
It's the sun
It's not bad
There is no consensus
It's cooling
Models are unreliable
Temp record is unreliable
Animals and plants can adapt
It hasn't warmed since 1998
Antarctica is gaining ice
View All Arguments...


Username
Password
New? Register here
Forgot your password?

Latest Posts

Archives

Confidence in climate forecasts

Posted on 4 August 2010 by Kevin Judd

Guest post by Kevin Judd

Climate scientists are telling us that the earth's average temperature is going to rise 2 to 3 degrees over the next 50 to 100 years. How do they make this prediction? And why are they confident their prediction will be correct? Climate scientists make this prediction using a climate model. So what is a climate model?

Perhaps you have seen, or even had a ride on, one of those model stream-trains. These are miniature working replicas of real steam-engines. Climate models are the same; they are a working replica of the earth, only instead being made of rock and water and other materials, they are made from mathematical equations.

These mathematical models are the basis of science and technology. There are models for how microwave ovens work; models for car engines and power stations; models for jet-aircraft. Models allow scientists and engineers to build things that have never been built before, by testing how they will work before they are made. Models were used to build the rockets that took astronauts to the moon and back safely. Models allows scientists to predict complex things like the weather.

These models make correct predictions because they are based on general scientific principles, often referred as "Laws", like the law of gravity. General scientific principles are important because they connect phenomena that are not obviously connected. For example, the principles of microwave ovens are related to the greenhouse effect. The principles of car engines and power stations are related to how the earth will warm up. The principles of aircraft are related to winds, storms, and ocean currents.

This interconnectedness gives scientific models great power. If the general principles of climate models were wrong, scientists would have known long ago: microwave ovens wouldn't work, aircraft wouldn't fly, weather couldn't be forecast.

Based on general principles alone climate scientists have every reason to be confident in their predictions, because the principles have been well tested. Furthermore, the climate models of twenty years ago accurately forecast temperature rises over the last 20 years. This successful prediction further validates the general principles, and gives us confidence in climate models. Add to this that the climate models of today are much better than 20 years ago.

Of course there will always be some uncertainty about how the details of climate change will play out, but there is no doubt on the basic story that the earth's average temperature is going to rise 2 to 3 degrees over the next 50 to 100 years. Anyone who says otherwise, either does not understand how science works, or is being deliberately misleading.

In my next segment I'll consider what the consequences of this warming will be.

NOTE: this post is also being "climatecast" by Kevin Judd on RTR-FM 92.1 around 11.30 AM WAST today. You can listen to a streaming broadcast of RTR-FM online via http://www.rtrfm.com.au/listen.

0 0

Printable Version  |  Link to this page

Comments

1  2  3  Next

Comments 1 to 50 out of 115:

  1. Perhaps most importantly for the purposes of this post: if the physics of the models were wrong, the computer you're reading this on and the Internet over which the data is transmitted wouldn't exist. And that would be a tragedy. :) Thanks, Kevin! The Yooper
    0 0
  2. This may not be the right place to post this, but let me mention that three sections of my book-in-progress on sea level rise are now available in clean drafts. These are: (1) the Preface, which describes the IPCC; (2) the Introduction, which offers a beginner's primer on global warming; and (3) Chapter l, which explains why rising sea levels are important to us. Should you wish to read any or all of these, and to give me your most critical comments on what you read, please contact me off-line at huntjanin@aol.com.
    0 0
  3. "there is no doubt on the basic story that the earth's average temperature is going to rise 2 to 3 degrees over the next 50 to 100 years." This isn't what the IPCC says. There is, according to the IPCC, roughly a <=10% doubt. So according to you, the IPCC 'doesn't undertand how the science works, or is being deliberately misleading'. To say there is "no doubt" shows you don't understand the science.
    0 0
  4. That #3 sounds rather desperate.
    0 0
  5. For 20 years I've been a spacecraft thermal engineer. I maintain thermal models of satellites so that I can predict their temperature over their 15 year lifespan. This increases due to degradation of materials. Earth is a satellite, so the broad concepts required for predicting its temperature over time are trivial to me, to the point of boring (it helps I was once a PhD candidate in Atmospheric Science, but left to become what I am). I would like to say its been amusing to watch the general public wise up to the reality that physics is actually codified in computers to model physical behaviors like those of satellites, but I also have children. And it is definitely not amusing considering what such general ignorance coupled with arrogance has condemned them to.
    0 0
  6. Apologies for being critical, but I think this was a little over-simplistic. The most effective 'skeptic' meme about climate modelling is the 'too complex' argument. If someone asks "how come you can predict climate in 100 years but not weather in three weeks?", how will you answer? Saying you're building the equivalent of model steam trains is not going to help with that. There's an intuitive answer: climate is more like the seasons than like weather. One is caused by the angle of the Earth to the sun, the other by heat trapped by carbon, but it's the same principle: the system has a boundary condition, given by an external forcing. Temperatures can go up in winter and down in summer: that won't alter the seasons. Related, what role do feedbacks have? Lovelock's Daisyworld is a nice little model example. An albedo negative feedback there can keep the system's temperature within bounds - but external forcing, boundary conditions, win out in the end in that particular toy model. How much is that like our world? In what ways is it not? On that last question, I'd love to know what others think. One might argue: a negative feedback can only delay the effect of an external forcing. As in Daisyworld, where temperatures are regulated temporarily, but eventually snap back to where they would have been without the feedback control. Alternatively, albedo effects *do* actually change the energy throughput of the system, so feedbacks are not just internal effects, moving energy around within given boundary conditions. Related to that, how much can CO2 be considered a boundary condition in the same way seasonal forcing can? Have I got that all wrong? To sum up, I think we really need simple, intuitive ways to get at the core of what models can and can't do, not to mention what different kinds of model are good for. (Daisyworld = to get across a point about what systems *can* do to regulate themselves, which is why the wikipedia critique of 'lack of realism' doesn't count. Realism wasn't the model's aim.)
    0 0
  7. Thanks Kevin, I think if you were to flesh things out with details I'm not sure a model for the earths climate is in anyway similar to the model for how a microwave oven works Secondly I don't think it's a simple process of plugging in "laws" to the model and setting it going. You have to be sure you have all the laws in the first place. My understanding is that the history of climate models says they get it wrong more than they get it right, that they have needed to be constantly changed because they have tended to drift from observed results. That when they are changed they are not necessarily changed in a way that is a closer match to the forces at work in the real world but are changed to mimic the new observed data which means down the line there is a real possibility that they'll drift from observed results again. I have no problem with models per se but we should be realistic in how well they are working, I think there is an over emphasis on the skill. Part of the problem is that the interpretation of results are often subjective an example might be. Intrinsic versus Forced Variation in Coupled Climate Model Simulations over the Arctic during the Twentieth Century In this paper they look at the output of models for temperature change in the arctic and compare it with observed results. The arctic temperature record has two periods of strong warming, 1979-present and 1920-1940. Models can mimic well the present period but there are issues with the important earlier period. The authors of the paper think that because models predict the present period well we understand whats forcing arctic temperatures now, of course its CO2. They also try to stretch the skill of the models by redefining an early 20th century warming period. So instead of 30years @ 0.7oC above normal they say that a model has some skill in reproducing arctic temperatures if it manages a decade @ o.36oC. This is purely subjective and the authors aknowledge this. With this criteria some (still a minority) are shown to have skill. On this basis they think models are accurate. I think in more simple terms: this paper does a good job in showing that models do not reproduce the early 20th century warming period well and so do not contain all the "laws" governing the arctic temperature. Therefore we can't say for certain what is forcing arctic climate change in the early 20th century and therefore now. As an amateur I should defer to the experts but knowing that this paper isn't just about looking at arctic climate but also is trying to generate the consensus around AGW it makes the subjective nature of the interpretation problematic.
    0 0
  8. Dan Olner at 17:42 PM on 4 August, 2010 : Unless you know Kevin Judd's audience you can't know whether what he writes is over-simplistic. Only he can know whether he's pitched it right. Given that this is a general radio audience, if Kevin started talking about 'boundary conditions' and 'external forcings' he'd lose his audience immediately; they'd switch off. This is one of the problems of explaining climate science; for the man in the street you really need to go simple. If you over-qualify a statement you sound complicated and turn many people off; if you leave out the qualifications you leave yourself open to being criticised for not understanding the science. There's a perfect example in Kevin's radio piece. He says "...there is no doubt on the basic story that the earth's average temperature is going to rise 2 to 3 degrees over the next 50 to 100 years." Then, above, thingadonta says "according to the IPCC, [there's] roughly a <=10% doubt" . So to prevent criticism perhaps Kevin should have said, "there is a strong chance...", or even (to satisfy Thinga...) "there's a 90% chance? But then the audience say, "see; they don't really know!" -- which is true... or perhaps not. To be both simple and accurate is possible. But in this world of unequivocal -- arguably outrageous -- statements by politicians, advertisers and every pundit under the sun, for the man in the street the voice of the scientist can sound woolly and unconvincing.
    0 0
  9. If the general principles of climate models were wrong, scientists would have known long ago: microwave ovens wouldn't work, aircraft wouldn't fly, weather couldn't be forecast. Aircraft however do fall out of the sky, microwave ovens fail, an weather forecasters get it wrong. With regard to aircraft falling out of the sky, I'm reminded of the troubled history of the De Havilland Comet aircraft - two spectacular crashes led to extensive research eventually isolating metal fatigue arising out of pressurisation and depressurization as the culprit. The models never predicted this. Moreover, only four Comets crashed (one because of pilot error, one because of issues relating to wing design, and the last two because of metal fatigue leading to significant redesign of subsequent Comets). Now none of us would ever get inside a plane if we were told that there was a chance of 'less than percent' of the aircraft crashing. So I think thingadonta's not totally out of place in citing the IPCC's uncertainty margins. The uncertainties arise because some things don't quite fit the models perfectly. With all respect to ubrew12 whose technical expertise far exceeds anything i could aspire to, the earth is a touch moire complex than an artificial satellite. I'm not too comfortable with the notion that the broad concepts are so simple as to be trivial. Models by their very nature oversimplify and need modification to bring them in closer accord with reality (and I recall a fine description in Spencer Weart's book on the the development of climate models). None of this in any way detracts from arguments that we should reduce CO2 emissions and fossil fuel reliance substantially - these are very arguably good things in themselves. However, let's not impoverish our understanding of our world by trivialising the sources of uncertainty - we might even end up with better focussed responses for the future of our planet.
    0 0
  10. Chriscanaris @9 - your De Havilland Comet analogy is back to front. Continuing with your analogy - the models demonstrate a 90% probability of the aircraft crashing, but because of the remaining uncertainty you want to board the plane and fly anyway.
    0 0
  11. I agree with John Russell above, what matters is the audience. If IPCC says 'there is at least 90% probability of 2-5 deg temperature rise in the next 50-100 years', what this means in normal language is: 'there is no doubt' or 'we can be pretty darn sure'. Like it or not, we use expressions like 'there is no doubt' and 'it is certain that' all the time to describe (future) events that have a probability of occurring of less than 1. It is a bit like with DNA evidence. Lawyer to expert: 'Is there a probability that the DNA match putting my client at the scene of the crime occurred by chance?' Expert: 'Yes, about 1 in a million.' Lawyer: 'Ladies and gentlemen of the jury: based on DNA-evidence you see it is not at all certain that my client was at the scene of the crime.' Of course this is ludicrous, a probabibilty of P = 0.999999 (or even P > 0.99 for that matter), is what we tend to call 'absolutely, totally certain' in layman speak. On a related note: what is often overlooked is that uncertainty also means that there is a probability that things will turn out to be WORSE than expected. So uncertainty in IPCC projections makes it MORE important to take swift action, not less.
    0 0
  12. My first lesson in computers was, "garbage in, garbage out".
    0 0
  13. Hi , does anyone else run climatemodels ? you run it on your computer when its idle , this way they can run thousands of simulations . Iam just interested in others opinions of this . Sorry if link doesnt work .
    0 0
  14. RSVP at 21:02 PM on 4 August, 2010 Hope you made it to lesson two RSVP! Computational models are so valuable in pretty much all scientific endeavours now that it would be a shame if you were still stuck in your lesson one. Obviously the way to address your GIGO conundrum is to take care in the coding and parameterization, use the most powerful computational resource available (if your model is effectively scalable without limit) and keep careful sight of the relationships between your model and the particular element of the real world that your model is simulating. It obviously helps to have a good understanding of the limitations of your model,to carefully frame the scope of the model in terms of the questions about the real world that your model is addressing, to have a means of addressing the relationships between model outputs and the real world, to update the model as parameterizations of the model inputs improve, etc.. Pretty much everyone that uses computational modelling has a handle on these things...
    0 0
  15. Dan Olner at 17:42 PM on 4 August, 2010 says: "If someone asks 'how come you can predict climate in 100 years but not weather in three weeks?'" I think this is a good question and I have heard the argument made often. Besides the response laid out here, I have heard an analogy that I think works pretty well for the average person. I should note that I'm not big on analogies, as the listener who disagrees with your point will simply look at what is wrong with your analogy and the point can easily get lost. That aside, I like the comparison to the stock market. We could say the stock market is much like climate. We can (and usually do via 401Ks and the like) make fairly safe assumptions that over the long term there will be an upward trend. This is based partially on economic models and historical data. What we can't accurately predict is the day to day fluctucations of the market, individual stocks, etc. Even the long-term forecast will have its fair share of "unexpected" events. The current recession might be comparable to a large volcanic eruption. Perhaps a depression would be akin to the same volcanic eruption combined with a deep solar minimum. Something along those lines. I hope that helps, as it can sometimes be difficult to speak to your audience, as others have noted. Speaking in technical terms might lose them quickly. Start talking about their wallet and relating it to current events might be beneficial.
    0 0
  16. Daved Green, I have used that Climate Models site in the past and think it would be very useful if more people were to take in onboard, so to speak : it only requires downloading a small file (as far as I remember). I have also used the SETI one and one looking for various cancer 'cures', but that is neither here nor there. With regard to models, I posted this link elsewhere and wanted to post it again, as an example of a good model prediction : Quantifying the uncertainty in forecasts of anthropogenic climate change, from 1999/2000). (By the way, I added that link, plus two from Hansen on the same topic, to the LINKS section and noticed that there are an extremely large number of blogs, etc. being used as so-called skeptical arguments. Even the "Ice Age predicted in the 70s" topic has 248 skeptical 'arguments' against it, as if there was something to argue against ! To be fair, when you select peer-review only you get left with just a Rasool and Schneider paper from 1971, but that was a theoretical prediction from the time (subsequently discarded) and not a skeptical argument, surely ? Too much dross, though, and maybe confusing to those who come along to see what the state of play is with regard to various arguments - they might think that the skeptics have the upper hand, perish the thought...)
    0 0
  17. Surely, the issue of confidence in climate forecasts deopends on the accuracy of the warming imbalance which is supposed to exist - currently about +0.9W/sq.m. The degree of warming now and into the future hinges on the accuracy of this number and its projected value going forward. Go look at Fig 2.4 of AR4 and Fig 4 of Dr Trenberth's 'An imperative for climate change planning et al.." and tell me the accuracy of the 0.9W/sq.m number. Pay attention to the width of the error bars on total aerosols, and net responses like WV and ice albedo feedbacks. The CO2 GHG forcing effect is fairly narrowly constrained, but flattening temperatures do highlight whether this effect and its interaction with water vapour is as accurately know as AGW science claims. And of course OHC is the least accurately measured and the owner of this blog agrees that the oceans are the only significant storage for the heating imbalance and that is where the true extent of global warming will be measured.
    0 0
  18. Ken #17 Still plowing the same furrow. You've been down to bedrock for a while, and your field is barren. We now know from postings elsewhere that the measured TOA imbalance likely corresponds to a climate sensitivity of 3ºC - a figure I've been asking you to provide for a year or more. The temperature anomaly data supports the "supposed" heat imbalance as well. As for the error bars. There is more than component that contribute to these. Firstly we have measurement uncertainty. You appear to want to make the assumption that this is going to come out strongly in the negative feedback side with no scientific justification for this. Secondly and thirdly the error bars are influenced by variability and residence time. Finally, just because you repeat the assertion constantly doesn't mean that it's true: there is no flattening trend in the recent temperature record - you can only make this claim through deliberate or accidental ignoring of the statisitcal reality of the situation. Conclusion: constantly stating the obvious (that there are uncertainties involved) contributes nothing to the argument that the problem is less than the scientific consensus suggests that it is.
    0 0
  19. kdkd is right -- a top-of-atmosphere radiative imbalance of 0.9 W/m2 corresponds to a climate sensitivity of around 3 C. Ken, I'm not sure you understand the distinction between (a) a radiative imbalance at the top of the atmosphere, and (b) a climate forcing. The number you cite (0.9 W/m2) is the former. The AR4 figure to which you refer discusses the latter. The existence of a TOA radiative imbalance is an inherently transient thing. The existence of an imbalance means that the earth is radiating less energy than it receives from the sun. Over time, this causes the earth to warm up, allowing it to radiate more, which reduces the TOA imbalance. Eventually, that figure will drop back to 0 W/m2, because the earth has warmed up enough to rebalance its radiation budget. Ken's citation of Fig. 2.4 from AR4 relates to uncertainty in the net climate forcing from various sources. There is uncertainty in that total, which in turn leads to uncertainty in estimates of climate sensitivity. But it's distributed around the best estimate of a climate sensitivity of 3 C. If your reaction is "Well, the uncertainty means it could be lower" then you have to equally consider the possibility that "Well, the uncertainty means it could be higher." In the meantime, while trying to narrow that range of uncertainty, we should proceed on the assumption that climate sensitivity is around 3 C. As for Ken's continued claims of "flattening" temperatures, I point out again that most of the past decade had temperatures above the pre-2001 trend: In other words, the 2000s were actually warmer than one would predict based on the rate of warming over the preceding two decades.
    0 0
  20. Your statement that climate models are accurate does not appear to be correct. The NASA GISS data up to December 2009 are shown in Figure 1. They are compared with the global warming scenarios presented by Hansen (2006). 
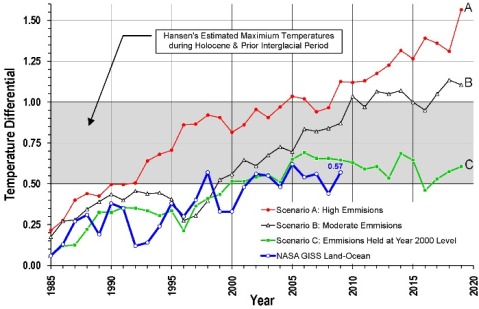
Figure 1: Scenarios A, B and C Compared with Measured NASA GISS Land-Ocean Temperature Data (after Hansen, 2006) The blue line in Figure 1 denotes the NASA GISS Land-Ocean data and Scenarios A, B and C describe various CO2 emission outcomes. Scenarios A and C are upper and lower bounds. Scenario A is “on the high side of reality” with an exponential increase in emissions. Scenario C has “a drastic curtailment of emissions”, with no increase in emissions after 2000. Scenario B is described as “most plausible” which is expected to be closest to reality. The original diagram can be found in Hansen (2006). It is evident from Figure 1 that the best fit for actual temperature measurements is the emissions-held-at-year-2000-level Scenario C. This suggests that global warming has slowed down significantly when compared with the “most plausible” prediction Scenario B. A similar study comparing HADCRUT3 with AR4 may be found here CONCLUSIONS It is evident that computer models over-predict global temperatures when compared with observed temperatures. Global warming may not have stopped but it is certainly following a trajectory that is much lower than that predicted by computer models. Indeed, it is following the zero-increase-in-emissions scenarios from the computer models
    0 0
  21. There has been recent debate on the “How reliable are climate models?” thread about this topic. The lead article here repeatedly uses the word “predict” or its derivatives, just as the IPCC did in its second assessment report. After IPCC reviewer Dr. Vincent Gray pointed out that no model had ever been validated and could not predict global climates the title of the relevant WG1 chapter was renamed “Model evaluation” and the word “predict” was replaced with “project”. These changes were not trivial but highly significant. There can be no confidence in the ability of climate models to predict what global climates will be during the present century of any other because the present scientific knowledge of those horrendously complex processes and drivers of global climates are too poorly understood. Anyone who is inclined to reject that last statement should read a few more scientific papers on the subject and look carefully for the word “uncertainty”. Sorry that I can’t spend more time on this at the present but I’m under strict orders from she who must be obeyed. There is more on this on the “How reliable are climate models?” thread - enjoy Best regards, Pete Ridley.
    0 0
  22. #18 kdkd at 00:52 AM on 5 August, 2010 We now know from postings elsewhere that the measured TOA imbalance likely corresponds to a climate sensitivity of 3ºC #19 Ned at 01:30 AM on 5 August, 2010 kdkd is right -- a top-of-atmosphere radiative imbalance of 0.9 W/m2 corresponds to a climate sensitivity of around 3 C. TOA radiative imbalance is not measured, it is presumed. There is an essential difference in the epistemological status of these two approaches that should never be muddled up. Current Opinion in Environmental Sustainability 2009, 1:19­27 An imperative for climate change planning: tracking Earth's global energy Kevin E Trenberth "Presuming that there is a current radiative imbalance at the top-of-the-atmosphere of about 0.9 W m-2 [etc., etc.]"
    0 0
  23. Re: #20: I went to the paper by Hansen, et al. (2006) and compared the graph above with the graph in the paper (figure 2, p. 14289). There seem to be significant differences between them. In particular, an naive reading of the original suggests that the data is tracking closely to both Scenario B and Scenario C, which have not diverged appreciably by this point in time. It is not clear at a casual glance why, but the graphs were plotted with different scales, with the graph above omitting about 30 years of data. I wanted to post a copy of the graph but could not figure out how.
    0 0
  24. Pete Ridley at 02:56 AM on 5 August, 2010 Some of the argument over predictions is because the word has differing meanings in science as opposed to 'general life'. Predictions in science are exact and leave no 'wriggle room'. Leaving aside its meanings associated with astrology -- for obvious reasons -- in contrast the word 'prediction' in general use tends to mean 'an educated guess' -- in much the same way as pollsters will 'predict' the outcome of an election before people have even put crosses on paper. I must say that for some years now I have completely avoided the word 'prediction' in the context of climate change -- it is too open to challenge. I now always use expressions like 'very high probability'.
    0 0
  25. Angusmac @20 - where does that graph come from?. As Dcruzuri has pointed out, it differs greatly from the actual 2006 Hansen paper, which shows actual temperatures tracking very closely to scenario B, and above scenario C. You even provided a link to the actual paper. Do you expect people not to check?.
    0 0
  26. 0 0
  27. Dappledwater at 05:26 AM on 5 August, 2010 angusmac at 02:43 AM on 5 August, 2010 We need to be a little bit careful here. Remember that Hansen’s model was constructed and parameterized almost 30 years ago. The computational run under discussion used a 100 year control equilibration with no forcings, and simulated the earth global temperature from 1958 to 2020 according to a number of scenarios [*]. Dappledwaters picture (Figure 2 from Hansen et al. 2006) shows that the simulation has done a good job of simulating the actual earth surface temperature through around 2005. Angusmac’s figure updates the data through 2009. The simulation and measured surface temperature data now converge a bit. What do we make of this? I’d say the following are relevant: (i) There’s no question that Hansen’s simulation B has tracked the real world temperature from 1958 through 2005 pretty well. Scenario B is a little above the real world observations. However as Hansen et al. 1988 state [**] their model is parameterized according to a climate sensitivity of 4.2 oC (equilibrium surface warming per doubling of [CO2]). Since the mid-range best climate sensitivity estimate is 3.0 oC, we’re not surprised if the model is a little “over warm”. (ii) Since 2005, the global temperatures haven’t risen much whereas the model has increased. So there is a divergence as indicated in angusmacs picture. However if a model of Earth temperature matches reality quite well up to 2005, the fact that it diverges somewhat during the subsequent 4 years isn’t a reason to consider the model a poor one. As Alden Griffiths discusses elsewhere on this site, short term events can easily result in temporary shifts of observables from long term trends. There’s no expectation that the Hansen model should accurately track reality since stochastic variability is differently represented in reality and in the models. (iii) Is there anything we might say about the period 2005-2009? Yes, it’s a period that has seen the sun drop to an anomalous extended solar minimum, and that has had a largish cooling La Nina that greatly suppressed temperatures in 2008. So we’re not surprised that temperatures haven’t risen since 2005. (iv) Is there anything significant about the fact that scenario B and C are rather similar right now? Not really. Scenario B is a scenario that roughly matches the extant emissions and (serendipitiously) includes a significant volcanic eruption in the 1990s (1995 in the model; 1991 Pinatubo in reality). In scenario C greenhouse emissions were “switched off” after 2000. However since the Earth surface continues to warm under a (non-supplemented) forcing for some time due to inertial elements (the oceans) of the climate system, we don’t expect scenarios B and C to differ to much for a while following 2000. [*] from Hansen et al. (2006)
    “Scenario A was described as ‘‘on the high side of reality,’’ because it assumed rapid exponential growth of GHGs and it included no large volcanic eruptions during the next half century. Scenario C was described as ‘‘a more drastic curtailment of emissions than has generally been imagined,’' specifically GHGs were assumed to stop increasing after 2000. Intermediate scenario B was described as ‘‘the most plausible.’’ Scenario B has continued moderate increase in the rate of GHG emissions and includes three large volcanic eruptions sprinkled through the 50-year period after 1988, one of them in the 1990s.”
    [**] from Hansen et al. (1988)
    “The equilibrium sensitivity of this model for doubledC O2 (315 ppmv - 630 ppmv) is 4.2 oC for global mean surface air temperature (Hansen et al. [1984], hereafter referred to as paper 2). This is within, but near the upper end of, the range 3 o +/- 1.5 oC estimated for climate sensitivity by National Academy of Sciences committees [Charney, 1979; Smagorinsky, 1982], where their range is a subjective estimate of the uncertainty based on climate-modeling studies and empirical evidence for climate sensitivity.”
    J. Hansen et al. (1988) Global Climate Changes as Forecast by Goddard Institute for Space Studies Three-Dimensional Model J. Geophys. Res. 93, 9341–9364 J. Hansen et al. (2006) Global temperature change Proc. Natl. Acad. Sci. USA 103, 14288-14293
    0 0
  28. sheesh..."converge" should say "diverge" in the second paragraph...
    0 0
  29. BP #22 "TOA radiative imbalance is not measured, it is presumed." I think that you mean inferred (via a model), not presumed. Discounting convergent evidence is part of the slippery slope to solipsism, a philosophical stance whose main use is to unpick a set of propositions via reducto ad absurdam. It's no way to conduct a scientific enterprise.
    0 0
  30. Dan Olner at 17:42 PM on 4 August, 2010 Daisyworld and feedbacks. That’s an interesting point Dan. I would say that Daisyworld is generally a poor analogy for the Earth system and its biosphere, largely because the evidence supports the conclusion that there are no major negative feedbacks of the sort that would maintain a sort of "homeostasis"; on the contrary most feedbacks (at least on the months to 1000’s of years timescale) seem to be positive. (That's not to say that life hasn't had an astonishing influence on the progression of the physical history of the Earth!). Here’s my take; I’m curious what others may think: (i) The sun is the source of energy for the climate system. It is astonishingly constant in its output on the millennial to million years timescale (the solar constant increases by around 10% per billion years). When the solar output does change a bit, so the climate system responds. (ii) The second factor that dominates the energy in the climate system (I’ll use “temperature” for short) is the greenhouse effect. (iii) The third and fourth factors are the distribution of continents (significantly the polar land masses which affects the energy in the climate system through ice albedo), and the earth’s orbital properties which especially modulates the albedo when there is polar ice. I would say that’s pretty much it (one can include land albedo effects and other minor contributions, and we shouldn't forget contingent events like massive tectonic eruptions and extraterrestrial impacts..). How about Daisyworld-like self-regulating stabilizing feedbacks? Earth history tends to support the conclusion that these sadly don’t exist: (i) Ice age cycles. In a world with major polar ice and interglacial greenhouse gas concentrations below 400-500 ppm (?), seemingly rather minor changes in earth orbital properties result in dramatic transitions between climate states differing by 5-6 oC of global temperature. There aren’t self-regulating negative feedbacks that act to stabilise earth temperature; the feedbacks (change in albedo resulting in warming amplified by CO2 and water vapour feedbacks) are positive. (ii) Deep Earth history. During the mid-late Carboniferous a combination of migration of Gondwana to low latitudes and the massive depletion of atmospheric CO2 by non-oxidative biomass burial resulted in widespread glaciations; episodes of “snowball” or “slushball” earth resulting from albedo and greenhouse gas positive feedbacks; large episodic increases in earth temperature via massive tectonic events that released huge amounts of greenhouse gases….in none of these cases is there evidence of homeostatic self-regulation of the climate system. There is one Daisyworld-like self-regulating feedback but this acts only on the multi-millenial timescale. That’s weathering (the hotter it is the more efficient the draw-down of atmospheric CO2, and vice versa). However the latter is ineffective in limiting the effects of positive feedbacks that amplify both cooling and warming forcings on the timescales of 10’s to 1000’s of years. It would be nice to think that there might be a cloud feedback that would act to counter changes in temperature; however the evidence doesn’t support such a feedback. Something that might be considered a “restraint” on surface temperature variation is the huge thermal inertia of the oceans. This tends to dampen the response to changes in forcings and so smooths out cyclic changes in forcings (e.g. solar cycle) and stochastic variations in solar outputs, volcanic eruptions and so on. Returning to models and model success, the fact that the energy in the climate system under a particular state of continental distribution and Earth orbital status is largely defined by the solar output (pretty predictable) and the greenhouse effect (reasonably well bounded given a particular emission scenario) means that the basic energy balance (assessed as surface temperature and its temporal response to enhanced greenhouse forcing) can be modelled pretty well. That’s not to say there aren’t significant uncertainties as indicated by the rather wide range of climate sensitivities of various levels of likelihood, and uncertainties in aerosol and cloud contributions...
    0 0
  31. #29 kdkd at 07:28 AM on 5 August, 2010 I think that you mean inferred (via a model), not presumed. "Presumed" is Trenberth's expression, not mine. Anyway, the 0.9 ± 0.5 W m-2 imbalance is not measured, therefore one does not try to convince laymen it is. Inference (via a computational climate model) is very far from actual measurement. The more so, because contrary to mainstream claims, even the basic physics of General Circulation Models is highly dubious (not to mention parametrization of sub-grid processes like storms and cloud formation). The climate system is clearly a heat engine with water as a working fluid. Now, no heat engine can be understood while entropy production and fluxes are obscure. Still, according to this pretty recent review article, misunderstandings abound in climate literature around a question that was settled a hundred years ago (yes, radiation pressure gives a plus 33.3% increment to radiation entropy flux). REVIEWS OF GEOPHYSICS, VOL. 48, RG2003, 27 PP., 2010 doi:10.1029/2008RG000275 Radiation entropy flux and entropy production of the Earth system Wei Wu and Yangang Liu Received 15 August 2008; revised 31 July 2009; accepted 29 October 2009; published 14 May 2010. My question is still pending. Is CO2 supposed to increase or decrease entropy production in the Earth system? What does the model ensemble say?
    0 0
  32. BP #31 I see you're still making your best effort to ignore the core of the point that I made in my previous post. Sure, you can take the solipsistic approach and a priori decry the validity of models, but that does not make any meaningful contribution to the validity of your argument. Additionally I note that you need to ignore the independent and convergent lines of evidence to maintain the pretense of the validity of your arguments.
    0 0
  33. Anyone who wants to construct a model using the following inputs, weighted as indicated, Solar Magnetic Lagged AA Index 45%, AMO Ocean Index 29%, PDO Ocean Index 21% and CO2 5% will come up with a model that provides excellent correlation with the Global Mean Temperature over the past century. The method of finding the correct weighting each input has to be by applying a factor that results in the best fit between the input index values and the existing temperature data. That does not explain whether or not such weighting is correct based on real world interactions. In order for any projections to be made from such a model then requires assumptions to be made about the each of the inputs going forward. This method is described in an article "FORECAST MEAN GLOBAL TEMPERATURE TRENDS FROM 2009 TO 2050", by Ian Holton found on the http://www.holtonweather.com site. How does GCM models differ in the weighting the various inputs, and making assumptions about the values of such inputs in order to project future model outputs?
    0 0
  34. JohnD one of the latest and greatest GCMs is documented here: GISS GCM ModelE. More specific to your question parameters are described here.
    0 0
  35. Model/world comparisons tend to focus on temperature. Here are a couple of items that have me wondering about depending on model limitations to "disprove" climate change. Observations are clearly at variance with model projections of some key climate indicators, in ways that seem consistent, not indicating all's well. From OSS Foundation
    0 0
  36. Dappled water: You say: Continuing with your analogy - the models demonstrate a 90% probability of the aircraft crashing, but because of the remaining uncertainty you want to board the plane and fly anyway. With respect, you missed the point. I have no overwhelming desire to get onthe plane. I'd just like to make sure the models are right.
    0 0
  37. "After IPCC reviewer Dr. Vincent Gray pointed out that no model had ever been validated and could not predict global climates the title of the relevant WG1 chapter was renamed “Model evaluation” and the word “predict” was replaced with “project”. Just in case people think "ipcc reviewer" is stamp of authority, note that you can become a reviewer by requesting the draft and signing an NDA. Gray's contribution to the review process can be followed by searching for "Gray" at ipcc collection. He claimed (8-76) "There is no evidence for this statement. No model has ever been tested successfully against its future prediction." The editors responded in rejecting the review. "Disagree Decades ago, climate models predicted warming in the late 20th century, strongest near the poles, and this has been observed. As a second example, a climate model predicted the cooling due the Pinatubo before it occurred." If Hansen 2006 paper isnt a validation of the 1988 model against the actual data, then what is? JohnD - GCMs do not "weight inputs" - they are not statistical models. They calculate the response to input from the physics. Different kind of model completely. If you want a statistical model with physical basis, then better to try and predict temp from forcings of solar, aerosol, GHG. For an example, try Benestad and Schmidt
    0 0
  38. BP - I'll bite on entropy. I would say GHG increase should increase entropy - the earth has become more efficient at converting high entropy photons to low entropy photons. I am not sure what point you are aiming at. By the way, as "heat engine", what is the Work that the working fluid is doing?
    0 0
  39. doug_bostrom (#35), Like you, I am impressed by the accuracy of TOPEX and other satellite measurements of sea level rise. However, tide gauges need to be reconciled with the satellite measurements before we can have full confidence in the 3.2 mm/year rate of rise for the mean sea level. Tide gauges show sea levels rising at the same rate as during the 20th century (1.7 mm/year).
    0 0
  40. #38 scaddenp at 14:49 PM on 5 August, 2010 By the way, as "heat engine", what is the Work that the working fluid is doing? Weather?
    0 0
  41. Ned #19 "Ken, I'm not sure you understand the distinction between (a) a radiative imbalance at the top of the atmosphere, and (b) a climate forcing. The number you cite (0.9 W/m2) is the former. The AR4 figure to which you refer discusses the latter." No Ned, you missed the extra bit from Fig 4, of Dr Trenberth's paper: Current Opinion in Environmental Sustainability 2009, 1:19­27 An imperative for climate change planning: tracking Earth's global energy Kevin E Trenberth Figure 4 is a composite of Fig 2.4 from AR4 PLUS the climate system responses which reconcile the total net anthropogenic to the TOA imbalance. The main component of the total net anthropogenic is +1.66W/sq.m from CO2GHG, plus other GHG; minus aerosol, cloud and surface albedo, and plus a little solar. The Fig 4 sum is : 1.6W/sq.m (total net anthropogenic) - 2.8W/sq.m (radiative feedback) + 2.1W/sq.m (WV and Ice Albedo feedbacks) = 0.9W/sq.m Figure 2 from the same paper shows the TOA balance as Incoming Solar radiation (341.3W/sq.m) minus Reflected Solar radiation (101.9W/sq.m) minus Outgoing Longwave Radiation (238.5W/sq.m) 341.3 - 101.9 - 238.5 = 0.9W/sq.m The issue of climate sensitivity for a doubling (or any increase) of CO2 is bound up with nearly all of the forcing components and the net responses. CO2GHG forcing is supposed to follow the Eqan F.CO2 = 5.35ln(CO2a/CO2b) where CO2b is 280ppmv. Total aerosol cooling forcing; nobody really knows what Eqan it follows. Radiative cooling feedback is proportional to T^4, and nobody really knows what Eqan WV and ice albedo feedbacks will follow. Put all that together and you get a climate sensitivity of between 0.75 and 4.5 degC for doubling of CO2 to 560ppmv, depending on whether you read Lindzen or Hansen. Since we have already had 0.75degC warming since pre-industrial times, warming could have stopped, have about 0.75degC to go, or 3+ degC to go. The theme of Dr Trenberth's paper is his lament that currently the measurement of the vital forcings directly is not sufficiently accurate to do better than these theoretical and model based numbers, particularly OHC which is the least best measured, looking dodgy and will be the final arbiter of warming extent.
    0 0
  42. Let' stick with credible numbers, Ken. Climate sensitivity of 0.75C is not comparable to 4.5C on the credibility scale -- if you're going to include outliers on the low side of the range, you need to include outliers on the high side as well (i.e., > 6C), for the sake of intellectual honesty. Or, you can go with the most probable range based on the convergence of observational and modeling evidence (roughly 2 to 4.5C). Then there's the problems with this: Since we have already had 0.75degC warming since pre-industrial times, warming could have stopped, have about 0.75degC to go, or 3+ degC to go. Except that CO2 hasn't doubled yet, now has it? Plus CO2 (and other GHGs) don't account for 100% of the warming to date. Under anything remotely resembling a "business as usual" scenario there pretty much has to be quite a bit more warming in the 21st C than in the 20th C.
    0 0
  43. More broadly, Ken, my impression of your comments here is that you always raise the issue of uncertainty, and then use that to imply that it means that things might be better than the standard consensus. But they might also be worse! A very low climate sensitivity implies the existence of large negative feedbacks (planetary homeostasis, a la Daisyworld or Lindzen's "iris") that somehow keep the climate within a nice cosy range. It's hard to see how that squares with the existence of glacial/interglacial cycles!
    0 0
  44. Ken Lambert at 23:55 PM on 5 August, 2010 "Put all that together and you get a climate sensitivity of between 0.75 and 4.5 degC for doubling of CO2 to 560ppmv, depending on whether you read Lindzen or Hansen." Ken, it sounds a little like you consider the climate sensitivity is a matter of choice! In fact the science is a far better source for understanding the likely degree of surface warming in response to massively enhanced greenhouse gas concentrations. This indicates that the range of likelihood is between 2 - 4.5 oC (per doubling of [CO2]), which is quite well constrained at the low end (little likelihood of climate sensitivity below 2 oC[*]), but poorly constrained at the high end (poor basis for rejecting higher climate sensitivities). See for example Knutti and Hegerl’s recent review. R. Knutti and G. C. Hegerl (2008) The equilibrium sensitivity of the Earth's temperature to radiation changes Nature Geoscience 1, 735-743 In reality it is very difficult to envisage that the climate sensitivity (equilibrium surface warming from a radiative forcing equivalent to doubling of atmospheric [CO2]) can be below 2 oC (e.g. [*]). Lindzen's efforts to insinuate a low climate sensitivity are dismally flawed [**] (if not worse [***]) and one really does need to play at disregarding a huge body of science, to consider that his analyses have scientific merit. [**] Murphy, D. M. (2010), Constraining climate sensitivity with linear fits to outgoing radiation Geophys. Res. Lett., 37, L09704 Chung, E.-S., B. J. Soden, and B.-J. Sohn (2010), Revisiting the determination of climate sensitivity from relationships between surface temperature and radiative fluxes Geophys. Res. Lett., 37 L10703 [***] Trenberth, K. E., J. T. Fasullo, C. O'Dell, and T. Wong (2010) Relationships between tropical sea surface temperature and top-of-atmosphere radiation Geophys. Res. Lett., 37, L03702 ”…particularly OHC which is the least best measured, looking dodgy and will be the final arbiter of warming extent.” The “final arbiter of warming extent “ is surely the warming extent Ken. We live at the Earth surface and it is the surface warming that is of interest. The climate sensitivity is explicitly defined in relation to Earth surface warming. Most of our understanding of past climatology that informs us on the relationships between enhanced greenhouse forcing and Earth response relates to earth surface responses. We can play the game of selecting arenas of uncertainty (OHC) in order to attempt to ramp up the impression of uncertainties, but one wonders why anyone would think that sort of game fruitful! Not so distant history warns us of the dangers of that sort of misrepresentation of scientific knowledge. ------------------------------------------------------- [*] For example, the Earth has warmed by around 0.8-0.9 oC since the middle of the 19th century, while [CO2] has risen from around 286 ppm then to 388 ppm now. A climate sensitivity of 2 oC should then give an equilibrium warming of: ln(388/286)*2/ln(2) = 0.86 oC We know that we haven’t had the full warming from this enhancement of greenhouse gases, since it takes the earth many decades to come to equilibrium with the current forcing resulting from raised greenhouse gases. Likewise we know that a significant part of the warming from this enhancement of greenhouse gas levels has been offset by manmade atmospheric aerosols. On the other hand some of the warming is due to non-CO2 sources (man-made methane, nitrous oxides, tropospheric ozone, black carbon). Non greenhouse gas contributions to this warming (solar, volcanic) are known to be small. Overall, it’s rather unlikely, given the warming since the mid-19th century, that climate sensitivity is less than 2 oC. This is expanded on in more detail in Knutti and Hegerl (see above), in Murphy et al. (2009), in Rind and Lean, 2008, in Hansen et al (2005), etc. etc.
    0 0
  45. I am appalled at the level of scientific misunderstanding shown here by Kevin Judd (and, presumably, John Cook). There is no such a thing as a "climate forecast". What climate models do is run “scenarios”, “what-ifs”, computations in which some parameters get changed, and everything else remains equal. That is a normal way of conducting risk analysis, but only if everybody keeps in mind that OF COURSE in the real world everything changes, and nothing remains equal. The surface temperature, for example, is also affected by unknown variables such as future volcanic eruptions and solar activity. Hence, the actual temperature difference between 2010 and, say, 2050, is pretty much unknowable. Climate models are therefore tools to probe risks and sensitivities, not crystal balls. As a matter of fact, they can’t, won’t and never will tell us anything precise about future weather, weeks, months, years or centuries in the future: just as no donkey will ever win the Kentucky Derby. That doesn’t mean climate models (or donkeys) are useless: rather, they should be used for what they are worth using. And yes, you can ask Gavin Schmidt if you don't believe me ;-) ps some will say that the difference between "forecast" and "scenario" is lost among the general public. Well, as Einstein would have it, scientific communication should be made as simple as possible, but no simpler. And why is this so important? Schmidt again: "there is a real danger for society’s expectations to get completely out of line with what eventually will prove possible, and it’s important that policies don’t get put in place that are not robust to the real uncertainty in such predictions".
    0 0
  46. I am appalled at the level of scientific misunderstanding... Uh-huh, or the less-than-ideal use of a word which does after all include "judge to be probable" among its meanings yet can't be used in this context because somebody will inevitably pipe up about weather forecasts. Rhetoric is important. So good point, it's a favorite talking-point of contrarians but not really indicative of any problem w/scientific understanding.
    0 0
  47. Chriscanaris @ 36 - "With respect, you missed the point. I have no overwhelming desire to get on the plane. I'd just like to make sure the models are right." Yes, what I wrote earlier wasn't quite on point. The analogy itself isn't a valid fit, but a better extension would be: We're already on the plane, we didn't know there was a problem when we took off, but we do now - the models predict a crash if we continue much longer. Bits and pieces seem to be falling off the plane, which suggest the models might be on to something. I think we should try to land before we crash, we can't afford to wait for the models to be perfect. But you seem to be saying, "hang on a minute, about these models, only 90%?.......".
    0 0
  48. Omnologous @45 - I can predict that summer will be generally much warmer than winter. Or is that unknowable?.
    0 0
  49. For whom was this propaganda post written? For the average 10-year old? It is full of oversimplifications and half-truths. I agree with Einstein, as quoted by omnologos in an excellent comment (#45). An example: "Perhaps you have seen, or even had a ride, on one of those model stream-trains. These are miniature working replicas of real steam-engines. Climate models are the same; they are a working replica of the earth, only instead being made of rock and water and other materials, they are made from mathematical equations." There is no likeness other than the name 'model'. A model of a locomotive is a small-scale replica of a physical object already existing and well-known in every minute detail. You know exactly what the original object is like, and you can make the replica as precise as you like. On the other hand, a climate modelling program is a total artefact, a computer program fed with parameters and variables that are a mixture of basic physical laws, empirical data, and guesswork. You can not take a ride on it. All you can do is look at the diagrams it produces, and see if they agree with what you expected. If not, you change something and make a second run, etc. Change one parameter (for instance something to do with cloud production), and (hep!) you have a 'model' where the earth's average temperature is going to fall 2 to 3 degrees over the next 50 to 100 years. As proven by angusmac (#20), these climate 'forecasts' over-predict global temperatures when compared with observed temperatures. I am guessing there is a purpose behind this.
    0 0
  50. omnologos at 10:52 AM on 6 August, 2010 Yes you have a point Omnologous, although I think we might recognise that much of what you say is implicit in the sort of arguments used here. So when the term "prediction" is made, we should recognise that we really mean projection, and that this projection is being made to test a particular scenario (e.g. emission scenario). Likewise it's implicit that we recognise the inherent uncertainty about the future and that stochastic and contingent events are unpredictable (even if we can model some of these pseudo-stochastically - e.g. we can parameterize ocean current changes that give ENSO-like behaviour). I don't think anyone thinks they're "crystal balls" (I agree there is lots of confusion about this), and I personally don't think they tell us very much about future global warming over and above what we know from the seperate assessment of the forcings and their projected increases and so on that are themselves used to parameterize the models. The value of models (of the sophisticated computational variety) is that they allow us to assemble and incorporate our understanding into a representation of natural phenomena, which allows testing of future projections. They may also give insight into smaller scale phenomena (e.g. regional variability of distribution of thermal energy in a warming world), and provide reasons for more focussed investigation of experimental/empirical observations (e.g. to address apparent differences in tropical tropospheric temperatures between models and real world observations). So extraordinarily useful tools.....but not crystal balls!
    0 0

1  2  3  Next

You need to be logged in to post a comment. Login via the left margin or if you're new, register here.


The Consensus Project Website

THE ESCALATOR

(free to republish)


© Copyright 2024 John Cook
Home | Translations | About Us | Privacy | Contact Us