Climate Science Glossary

Term Lookup

Enter a term in the search box to find its definition.

Settings

Use the controls in the far right panel to increase or decrease the number of terms automatically displayed (or to completely turn that feature off).

Term Lookup

Settings


All IPCC definitions taken from Climate Change 2007: The Physical Science Basis. Working Group I Contribution to the Fourth Assessment Report of the Intergovernmental Panel on Climate Change, Annex I, Glossary, pp. 941-954. Cambridge University Press.

Home Arguments Software Resources Comments The Consensus Project Translations About Support

Twitter Facebook YouTube Mastodon MeWe

RSS Posts RSS Comments Email Subscribe


Climate's changed before
It's the sun
It's not bad
There is no consensus
It's cooling
Models are unreliable
Temp record is unreliable
Animals and plants can adapt
It hasn't warmed since 1998
Antarctica is gaining ice
View All Arguments...


Username
Password
New? Register here
Forgot your password?

Latest Posts

Archives

The albedo effect and global warming

What the science says...

Select a level... Basic Intermediate

The long term trend from albedo is of cooling. Recent satellite measurements of albedo show little to no trend.  

Climate Myth...

It's albedo

"Earth’s Albedo has risen in the past few years, and by doing reconstructions of the past albedo, it appears that there was a significant reduction in Earth’s albedo leading up to a lull in 1997. The most interesting thing here is that the albedo forcings, in watts/sq meter seem to be fairly large. Larger than that of all manmade greenhouse gases combined." (Anthony Watts)

At a glance

What is albedo? It is an expression of how much sunshine is reflected by a surface. The word stems from the Latin for 'whiteness'. Albedo is expressed on a scale from 0 to 1, zero being a surface that absorbs everything and 1 being a surface that reflects everything. Most everyday surfaces lie somewhere in between.

An easy way to think about albedo is the difference between wearing a white or a black shirt on a cloudless summer's day. The white shirt makes you feel more comfortable, whereas in the black one you'll cook. That difference is because paler surfaces reflect more sunshine whereas darker ones absorb a lot of it, heating you up.

Solar energy reaching the top of our atmosphere hardly varies at all. How that energy interacts with the planet, though, does vary. This is because the reflectivity of surfaces can change.

Arctic sea-ice provides an example of albedo-change. A late spring snowstorm covers the ice with a sparkly carpet of new snow. That pristine snow can reflect up to 90% of inbound sunshine. But during the summer it warms up and the new snow melts away. The remaining sea-ice has a tired, mucky look to it and can only reflect some 50% of incoming sunshine. It absorbs the rest and that absorbed energy helps the sea-ice to melt even more. If it melts totally, you are left with the dark surface of the ocean. That can only reflect around 6% of the incoming sunshine.

That example shows that albedo-change is not a forcing. That's the first big mistake in this myth. Instead it is a very good example of a climate feedback process. It is occurring in response to an external climate forcing - the increased greenhouse effect caused by our carbon emissions. Due to that forcing, the Arctic is warming quickly and snow/ice coverage shows a long-term decrease. Less reflective surfaces become uncovered, leading to more absorption of sunshine and more energy goes into the system. It's a self-reinforcing process.

If you look at satellite images of the planet, you will notice the clouds in weather-systems appear bright. Cloud-tops have a high albedo but it varies depending on the type of cloud. Wispy high clouds do not reflect as much incoming sunshine as do dense low-level cloud-decks.

Since the early 2000s we have been able to measure the amount of energy reflected back to space through sophisticated instruments aboard satellites. Recently published data (2021) indicate planetary albedo, although highly variable, is showing an overall slow decrease. The main cause is thought to be warming of parts of the Pacific Ocean leading to less coverage of those reflective low-level cloud-decks, but it's early days yet.

Albedo is an important cog in the climate gearbox. It appears to be in a long-term slow decline but varies a lot over shorter periods. That 'noise' makes it unscientific to cite shorter observation-periods. Conclusive climatological trend-statements are generally based on at least 30 years of observations, not the last half-decade.

Please use this form to provide feedback about this new "At a glance" section. Read a more technical version below or dig deeper via the tabs above!


Further details

"Clouds are very pesky for climate scientists..."

Karen M. Shell, Associate Professor, College of Earth, Ocean and Atmospheric Sciences, Oregon State University, writing about cloud feedback for RealClimate.

Earth's albedo is the fraction of shortwave solar radiation that the planet reflects back out to space. It is one of three key factors that determine Earth's climate, alongside the evolution of both solar irradiance and the greenhouse effect. Back in the 1990's, the evolution of Earth's albedo was by far the least understood of the three key factors. To address that uncertainty, it was proposed to measure Earth's albedo continuously over at least one full solar cycle. The long data series thereby obtained also helped scientists to explore potential correlations between varying solar activity and albedo change.

Thus was born the Earthshine project. It began in the Big Bear Solar Observatory (BBSO) in California in the mid-1990's. Measuring Earth's albedo was done by making observations of the illumination of the dark side of the Moon at night by light reflected off the dayside Earth. This method was pioneered in 1928 by French astronomer Andre-Louis Danjon (1890-1967).

Trial Earthshine observations were made in 1994–1995 and regular, sustained data-collection commenced in 1998. Data-collection continued until the end of 2017, representing some 1,500 nights spread over two decades.

 Illustration of Earthshine.

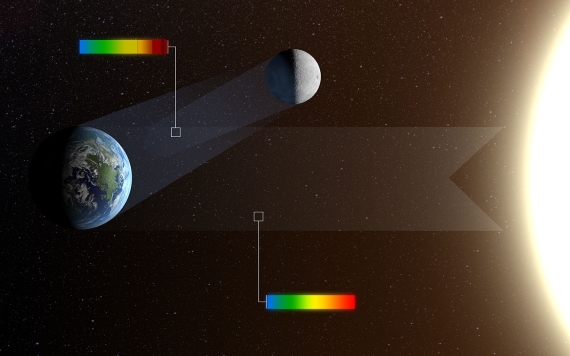
Fig. 1: When the Moon appears as a thin crescent in the twilight skies of Earth it is often possible to see that the rest of the disc is also faintly glowing. This phenomenon is called earthshine. It is due to sunlight reflecting off the Earth and illuminating the lunar surface. After reflection from Earth the colours in the light, shown as a rainbow in this picture, are significantly changed. By observing earthshine astronomers can study the properties of light reflected from Earth as if it were an exoplanet and search for signs of life. The reflected light is also strongly polarised and studying the polarisation as well as the intensity at different colours allows for much more sensitive tests for the presence of life. Image and caption credit: ESO/L. Calçada.

In 2005, a new automated telescope was installed in a small, dedicated dome at the BBSO. The two telescopes, new and old, were then run together from September 2006 through to January 2007, for calibration purposes. Observations made with the more accurate automated telescope were then made through to the end of 2017.

Since the early 2000s, scientists have also been measuring planetary albedo with a series of satellite-based sensors known as Clouds and the Earth’s Radiant Energy System, or CERES. These instruments employ scanning radiometers in order to measure both the shortwave solar energy reflected by the planet - albedo in other words – and the longwave thermal energy emitted by it. The overall aim is to monitor Earth's ongoing energy imbalance caused by our copious greenhouse gas emissions.

The Earthshine project and the CERES satellite-based measurements (2001-present day) both record great variation in albedo. That is as might be expected, because cloudiness is such an important albedo-controlling factor and varies so much. However, a slightly decreasing trend was detected (fig. 1, Goode et al. 2021).

Earthshine annual mean albedo anomalies 1998–2017. 

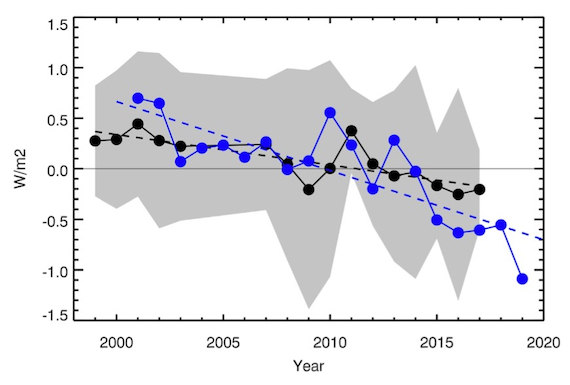
Figure 2: Earthshine annual mean albedo anomalies 1998–2017 expressed as reflected flux in Wm. The error bars are shown as a shaded grey area and the dashed black line shows a linear fit to the Earthshine annual reflected energy flux anomalies. The CERES annual albedo anomalies 2001–2019, also expressed in Wm, are shown in blue. A linear fit to the CERES data (2001–2019) is shown with a blue dashed line. Average error bars for CERES measurements are of the order of 0.2 Wm/2. From Goode et al. 2021.

The data cover two solar maxima, in 2002 and 2014, plus a solar minimum in 2009. Recorded variations in albedo show no correlation with the 11-year solar cycle, the cosmic ray flux or any other solar activity indices. Therefore, the data do not support any argument for detectable effects of solar activity on the Earth's albedo over the past two decades.

In comparison with the CERES data, both show a downturn in recent years, even though they cover slightly different parts of the Earth (Goode et al. 2021 and references therein). To put some numbers on things, in the earthshine data the albedo has decreased by about 0.5 Wm, while for CERES data, 2001–2017, the decrease is about 1.5 Wm. CERES data shows the sharp downturn to have begun in 2015.

The explanation put forward for the difference in albedo decrease between Earthshine and CERES has been further investigated and calibration-drift, a known issue with satellites, has been discounted. Instead, a recent and appreciable increase in sea surface temperatures off the west coasts of North and South America has been cited. The increase has led to reduced overlying low level cloud-deck cover. That would certainly cause significant albedo-decrease. The sea surface warming is attributed to a flip in the Pacific Decadal Oscillation (PDO), beginning in 2014 and peaking during the 2015–2017 period. It began to decline before the end of the decade.

However, a lot of this is very new, as pointed out by Gavin Schmidt at Realclimate in 2022. The role played by, for example, aerosols is not quantified in any great detail yet. But qualitatively, these developments demonstrate how impacts to the long-wave radiation combined with cloud feedbacks can lead to big shifts in short-wave reflectivity. Needless to say, this complex area is the firm focus of much ongoing investigation and will be for the foreseeable future.

Last updated on 3 March 2024 by John Mason. View Archives

Printable Version  |  Offline PDF Version  |  Link to this page

Argument Feedback

Please use this form to let us know about suggested updates to this rebuttal.

Comments

Prev  1  2  3  Next

Comments 26 to 50 out of 66:

  1. Here's my question: If the albedo doesn't appear to be shrinking, where is all the energy coming from that is supposed to be causing the warming - specifically the 3 C rise in temperature from 2xCO2?
  2. Read further down articles - it may be shrinking though CERES says stable. However, Flaner discussed elsewhere here indicates albedo decreasing faster than expected. However, to the primary point of your question. Albedo (unless otherwise stated) refers to energy reflected back in visible spectrum. Obviously, this is an important feedback but the source of the energy for warming by GHG is the increase in DLR. The reduction in OLR due to increased GHG is not captured by measurement of albedo.
  3. scaddenp, "Read further down articles - it may be shrinking though CERES says stable. However, Flaner discussed elsewhere here indicates albedo decreasing faster than expected." Do you have a free link to the paper? I'm not paying $18 to read it, and the summary is too vague. "However, to the primary point of your question. Albedo (unless otherwise stated) refers to energy reflected back in visible spectrum. Obviously, this is an important feedback but the source of the energy for warming by GHG is the increase in DLR. The reduction in OLR due to increased GHG is not captured by measurement of albedo." I understand, but it takes over 16 W/m^2 of additional power at the surface for a 3 C rise in temperature. The intrinsic absorption of 2xCO2 is only 3.7 W/m^2, so even assuming all of this is directed toward the surface, it needs to be amplified greater than 4 times over. The average gain of each W/m^2 from the Sun at the surface is about 1.6 - only about one third of that required for a 16 W/m^2 rise. 3.7 W/m^2 x 1.6 = 5.9 W/m^2 - leaving a deficit of over 10 W/m^2. The amount of the albedo from the surface is only about 23 W/m^2 according to Trenberth's diagram. That means the surface albedo would need to decrease by nearly half to get 16+ W/m^2 for a 3 C rise. That doesn't seem possible from just a 1 C global average intrinsic rise from 2xCO2 given we seem to be relatively close to minimum ice.
  4. First, 3.7W/m2 is "effective top of troposphere forcing", so this is effectively the same as 3.7W/m2 of downward. Talking "even if all directed at surface" is misunderstanding how the forcing is calculated. Second, sensitivity would be much lower as you suggest if there were no feedbacks. Albedo plays big role when ice sheets large, now, not so much. The other big feedback is GHG effect of water vapour.
  5. scaddenp, "First, 3.7W/m2 is "effective top of troposphere forcing", so this is effectively the same as 3.7W/m2 of downward. Talking "even if all directed at surface" is misunderstanding how the forcing is calculated." For the purposes of my question, I'm willing to accept this. "Second, sensitivity would be much lower as you suggest if there were no feedbacks. Albedo plays big role when ice sheets large, now, not so much. The other big feedback is GHG effect of water vapour." Why is the water vapor 'feedback' not embodied in the gain of about 1.6?
  6. Its not clear to me where you get your 1.6 from? Geometric correction? Why do you assume the solar number includes water vapour feedback when the CO2 value explicitly does not. There is little value in talking about TOA forcings if there is a feedback value included. The extent of feedback for a given forcing is the key to calculating climate sensitivity. (how many degrees of temp rise for a doubling of CO2). There is no back of the envelope way to do this - its an output from full GCM - and, yes the greatest uncertainty in the system. However, if you look at Realclimate's latest model/data comparison , you will see that AR4 values of about 3 fit well with data.
  7. scaddenp, "Its not clear to me where you get your 1.6 from? Geometric correction? Why do you assume the solar number includes water vapour feedback when the CO2 value explicitly does not." How could the roughly 239 W/m^2 of post albedo power from the Sun (amplified to about 390 W/m^2 at the surface) not include the effects of water vapor 'feedback'? In other words, how could the effects of water vapor not have fully manifested over decades or even centuries? Even over a hundred years ago, the gain was still about 1.6. For what physical or logical reason would the water vapor response be radically different from each W/m^2 of power from the Sun? "There is little value in talking about TOA forcings if there is a feedback value included. The extent of feedback for a given forcing is the key to calculating climate sensitivity. (how many degrees of temp rise for a doubling of CO2)." I'm not referencing just "TOA forcings" - but the intrinsic forcing of 3.7 W/m^2 plus gain, which is about 5.9 W/m^2. "There is no back of the envelope way to do this - its an output from full GCM - and, yes the greatest uncertainty in the system. However, if you look at Realclimate's latest model/data comparison , you will see that AR4 values of about 3 fit well with data." I know what the models are outputting, but fit well with what data, specifically? I don't see anything in that link about water vapor, which you claim is a big 'feedback' I'm not accounting for.
  8. RW1 - I am very concerned about this use of "gain" and "amplification". It suggests you are thinking about this via a very inappropriate electronic analogy. There is no "fixed gain" controlling how incoming flux translates to surface heat flux. That depends on GHG gas composition and surface temperature and a host of other elements. Your translation of 3.7 to 5.9 is plain wrong. Science of Doom has a series of lengthy articles with a lot of discussion on the actual mechanisms. I can only suggest a detailed study and throw out the "gain" concept. As to model output. The real physics, not simplistic analogy, including the role of water vapour as a feedback are calculated in the models. The output from the model is surface temperature through time given the actual forcings of solar, GHG concentration, volcanoes etc. From the output, you work backwards from temperature to determine the value of sensitivity - which comes to about 3. The validity of the model is tested by comparing forecast surface temperature actual observed surface temperature. If the sensitivity - which involves all those feedbacks is wrong- then temperature prediction would be too. I thought this was plain in the article.
  9. RW1 - let me expand here a bit. To see why idea of fixed gain doesnt work, consider what happens if there is no CO2. If it gets cold enough from loss of DLR and increasing albedo, then all water vapour is condensed out of atmosphere and there is no GHG effect. There is then no "gain". Likewise increasing the GHG increases your "gain". It seems to be that you are trying to use some heuristics and the Trenberth diagram to predict what the Trenberth diagram would look like with 2xCO2 from pre-industrial. You have to use the models to do this. Assuming models are correct then the changes would be like this: No change to TOA inputs. The 3.7W/m2 for increased is CO2 is "effective" not a real change to TOA flux. You could get change in cloud and surface albedo from model results but for simplicity assume increases in one are cancelled by decrease in other. Evaporation etc also change but are minor players. Surface OLR changes to from 390 to 406 and DLR increases from 324 to 340. Your "gain" as you have defined it, increases from 1.63 to 1.69. What is your "gain" when you put two blankets on your bed at night instead of one?
  10. "To see why idea of fixed gain doesnt work" I don't claim the gain is fixed. I know it isn't.
  11. A rise of about 1 C or 5.9 W/m^2 results in a new gain of only about 1.66 from 1.63 (396/239 = 1.66), which is a negligible increase. More importantly, it is still much less than the over 4x needed to get 16+ W/m^2 for a 3 C rise. More importantly If the effects of the 'feedbacks'(including specifically water vapor) are not embodied in the gain, then explain why it doesn't take over 975 W/m^2 at the surface to offset the 239 W/m^2 coming in from the Sun? Then also explain why the response of 'feedbacks' on next 3.7 W/m^2 at the surface will all of the sudden be nearly 3 times greater than the response of 'feedbacks' acting on the original 98+%?
  12. RW1 - The "gain" isn't the correct way to treat the issue, since the relative value is an output of the models, not a simplification you can use for input purposes. A 3.7 W/m^2 imbalance at the TOA results in about 1C of surface warming (5.9 or so W/m^2 higher IR at the surface, although backradiation also increases with atmospheric warming, so that's not a direct imbalance). And then feedbacks occur, changing levels of water vapor, long term albedo from ice melt, CO2 balance with the ocean, etc., each of which induce additional TOA imbalances and subsequent warming. Once feedbacks kick in their TOA imbalances are in addition to the original 3.7 W/m^2 forcing from doubling CO2. As I recall, we had a ~450 post discussion, primarily on these issues with you and George White (who apparently originated this "gain" idea) - I don't believe a single person on the thread agreed with you two, for a lot of very good reasons. You might want to take that into consideration...
  13. RW1 - the increase in "gain" (which certainly does include feedback) is 406/239 from model results. Again it seems you are trying to predict feedback (the increase in "gain"). Its a bogus procedure to say that "gain" * increase in CO2 will be the increase backradiation. You have to calculate it properly.
  14. As for sudden increase in gain... Gain for 0ppm of CO2 = 1 (no amplification) " 360ppm " = 1.63 (1997 value of CO2) " 580ppm " = 1.69 (doubling of CO2) using your definition of "gain" as surface OLR/(solar-albedo) and my calculation of Trenberth using values for models with sensitivity of 3 from above.
  15. Of course, the importance of water vapour is common (misunderstand) skeptic argument. See Water vapour for more detail.
  16. scaddenp, "RW1 - the increase in "gain" (which certainly does include feedback) is 406/239 from model results. Again it seems you are trying to predict feedback (the increase in "gain"). Its a bogus procedure to say that "gain" * increase in CO2 will be the increase backradiation. You have to calculate it properly." The 406 W/m^2 you quote isn't from any measurement but from model predictions from numerous assumptions that only exist in a computer. The 3.7 W/m^2 from 2xCO2 is from empirical measurement, so is the gain of about 1.6, which represents the amplification at the surface for each 1 W/m^2 of energy from the Sun. If 3.7 W/m^2 of additional infrared from 2xCO2 is amplified to 16+ W/m^2 at the surface, why isn't the 239 W/m^2 from the Sun amplified by proportionally the same amount to over 1000 W/m^2?
  17. KR, "A 3.7 W/m^2 imbalance at the TOA results in about 1C of surface warming (5.9 or so W/m^2 higher IR at the surface, although backradiation also increases with atmospheric warming, so that's not a direct imbalance). And then feedbacks occur, changing levels of water vapor, long term albedo from ice melt, CO2 balance with the ocean, etc., each of which induce additional TOA imbalances and subsequent warming. Once feedbacks kick in their TOA imbalances are in addition to the original 3.7 W/m^2 forcing from doubling CO2." Why don't the same feedbacks occur (excluding the surface albedo) on the 239 W/m^2 from the Sun?
  18. "Why don't the same feedbacks occur (excluding the surface albedo) on the 239 W/m^2 from the Sun?" What makes you think they don't? There is some water vapor in the air already, is there not? Why is it there in the first place?
  19. They do. Water vapour amplifies any surface temperature increase (and vice versa). However, your "Gain" analogy is inadequate to quantify those feedbacks.
  20. "so is the gain of about 1.6, which represents the amplification at the surface for each 1 W/m^2 of energy from the Sun." Again, this is bogus way to do it. You need a certain amount of energy to get past the threshold of having any water vapour at all. With zero CO2, you would still have same sun, but snowball earth and no water vapour. Above a certain point, the solar minus albedo is strong enough to give water vapour and get that feedback. Note also that albedo feedback becomes more important at lower temperatures too. The 3.7W/m2 is calculation by the way too, but you can the verify the RTEs used to calculate it empirically. I repeat, you have to calculate feedback with a model, not some half-baked "gain" idea. And the actual response of surface temperature to increasing CO2 gives a way to empirically estimate sensitivity (or test the sensitivity of model). 3 looks pretty good, but see the IPCC WG1 for variety of other empirical estimates.
  21. Continuing from another thread RW1 - I am lost at what you are trying to do here but pretty obviously, you dont lose 48W/m2 for each m2 of cloud! You seem be trying to predict something about change in albedo associated with clouds but what about calculating the +ve change in DLR too? Clouds do both.
  22. scaddenp (RE: 46), (Sorry I'm late on this) "RW1 - I am lost at what you are trying to do here but pretty obviously, you don't lose 48W/m2 for each m2 of cloud!" According to Trenberth's numbers, you do: Clouds cover about 2/3rds of the surface, so 341 W/m^2*0.67 = 228 W/m^2 average incident on the clouds. 79 W/m^2 divided by 228 W/m^2 = 0.34 average reflectivity of clouds. 1/3rd of the surface is cloudless, so 341 W/m^2*0.33 = 113 W/m^2 average incident on the cloudless surface. 23 W/m^2 divided by 113 W/m^2 = 0.20 average reflectivity of the cloudless surface. 0.34-0.20 = 0.14. 341 W/m^2*0.14 = 48 W/m^2 loss for each additional m^2 of cloud cover. "You seem be trying to predict something about change in albedo associated with clouds but what about calculating the change in DLR too? Clouds do both." I'm well aware clouds do both. The whole point is incrementally more clouds reflect away more energy than they re-direct back to the surface; thus, the energy needed to get the 16+ W/m^2 for a 3 C rise can only come from a reduced albedo.
  23. scaddenp (RE: 46), Let's run the numbers on how much energy incrementally more clouds trap: If, according to Trenberth, the cloudy sky has a transmittance of 30 W/m^2, and the surface emitted through the cloudy sky is about 265 W/m^2 (396 x 0.67 = 265). 265 W/m^2 - 30 W/m^2 = 235 W/m^2 absorbed by the cloudy sky. The clear sky has a transmittance of 40 W/m^2, and the surface emitted through the clear sky is 131 W/m^2 (396 x 0.33 = 131). 131 W/m^2 - 40 W/m^2 = 91 W/m^2 absorbed by the clear sky. 91 W/m^2 divided by 131 W/m^2 = 0.69; 235 W/m^2 divided by 265 W/m^2 = 0.89. 0.89 - 0.69 = 0.20 difference between the cloudy and clear sky. 0.20 x 396 W/m^2 = 79 W/m^2 additional absorbed for each additional m^2 of cloud cover. If we assume that roughly half of the absorption and re-emission is back toward the surface (Trenberth actually has this being less than half), that comes to about 39 W/m^2, or about 10 W/m^2 less than the 48 W/m^2 reflected away.
  24. The main point I'm getting at here is if the albedo is NOT decreasing (or has even slightly increased), where is the energy coming from that is supposed to be causing the warming? If, as you claim, an additional 3.7 W/m^2 at the surface is to become 16.6 W/m^2 then why doesn't it take more like 1075 W/m^2 at the surface to offset the 239 W/m^2 coming in from the Sun (16.6/3.7 = 4.5; 239 x 4.5 = 1075)?? Looked at from another angle: In energy balance terms, it takes about 390 W/m^2 at the surface to allow 239 W/m^2 to leave the system, offsetting the 239 W/m^2 coming in from the Sun (power in = power out). If, as you claim, it will take an additional 16.6 W/m^2 at the surface to allow an additional 3.7 W/m^2 to leave the system to restore equilibrium, then why doesn't it take 1075 W/m^2 emitted at the surface to allow 239 W/m^2 to leave the system to achieve equilibrium? What is so special about the next few watts at the surface that the system is all of the sudden going to respond to them nearly 3 times a powerful as the original 98+%? Furthermore, since the atmosphere cannot create any energy of its own, the remaining difference of about 10.6 W/m^2 (3.7 x 1.6 = 6 W/m^2; 16.6 - 6 = 10.6 W/m^2) can only come from a reduced albedo. So again, where is all the energy coming from that is supposed to be causing the warming?
  25. RE: My #48, If anyone doubts my calculations, I have backed check them by assuming that if half of the absorption is directed up out to space, then the weighted average totals should correspond to a temperature of about 255K. 0.69/2 (absorbed clear sky) + 0.31 passing through the clear sky = 0.66 and 0.89/2 (absorbed cloudy sky) + 0.11 passing through the cloudy sky = 0.55; 0.66 x 0.33 (clear sky) = 0.22 and 0.55 x 0.67 (cloudy sky) = 0.37; 0.22 + 0.37 = 0.59 emitted to space from the surface; 396 W/m^2 x 0.59 = 234 W/m^2 (about 254K), which is pretty close.

Prev  1  2  3  Next

Post a Comment

Political, off-topic or ad hominem comments will be deleted. Comments Policy...

You need to be logged in to post a comment. Login via the left margin or if you're new, register here.

Link to this page


The Consensus Project Website

THE ESCALATOR

(free to republish)


© Copyright 2024 John Cook
Home | Translations | About Us | Privacy | Contact Us