


 Arguments


Climate Sensitivity Single Study Syndrome, Nic Lewis Edition
Posted on 18 April 2013 by dana1981
Nic Lewis has written a paper on the subject of the Earth's climate sensitivity (how much surface temperatures will warm in response to the increased greenhouse effect from a doubling of atmospheric CO2, including amplifying and dampening feedbacks) which has been accepted by the Journal of Climate. First of all, we would like to offer kudos to Lewis for subjecting his analysis to the peer review process, which is something few climate contrarians are willing to do.
The paper is an outlier, finding a lower climate sensitivity than most other studies, and outside the likely range cited in the Intergovernmental Panel on Climate Change (IPCC) report. It's most important not to fall into the trap of thinking that any single study will overturn a vast body of scientific evidence, derived from many different sources of data (or as Andrew Revkin calls this, single-study syndrome). This was also recently an issue with regards to a similar and unpublished Norwegian study.
Lewis' is just one paper using one of many possible methods to estimate climate sensitivity. The overall body of evidence indicates that the Earth's surface temperatures will warm 2–4.5°C in response to a doubling of atmospheric CO2.
Lewis (2013)
Lewis took the approach of revising an analysis by Forest et al. (2006), applying Bayes' Theorem to a combination of an intermediate complexity climate model and recent instrumental data of surface and ocean temperatures. This Bayesian approach involves making use of prior knowledge of climate changes to establish a probability distribution function for climate sensitivity.
Lewis describes his approach here. Forest et al. applied Bayes' Theorem to three climate model parameters – climate sensitivity, effective ocean diffusivity, and the aerosol forcing. Lewis applied it to the data rather than the model parameters, and also added six more years of data to the analysis. The resulting climate sensitivity estimate in the Forest approach was 2.1–8.9°C surface warming in response to doubled CO2, with a most likely value of 2.9°C. Using an 'expert prior' reduced the 90% confidence interval to 1.9–4.7°C. Using his approach, Lewis estimated the 90% confidence interval at 1.0–3.0°C, with a most likely value of 1.6°C.
The Climate Variability Question Mark in Lewis' Approach
Another new paper by Olson et al. (2013) attempts to determine the amount of uncertainty that the short-term internal variability of the climate system brings into this sort of analysis. In fact, the study mentions Forest et al. (2006) as an example of the sort of approach that's vulnerable to large climate variability uncertainty – those which estimate climate sensitivity with intermediate complexity climate models in conjunction with recent historical observations. Olson et al. investigate three main sources of what they call "unresolved climate noise":
(i) climate model error;
(ii) unresolved internal climate variability; and
(iii) observational error.
The study concludes,
"each realization of internal climate variability can result in a considerable discrepancy between the best CS [climate sensitivity] estimate and the true value ... average discrepancy due to the unresolved internal variability is 0.84°C"
"These results open the possibility that, recent CS estimates from intermediate complexity models using global mean warming observations are systematically higher or lower than the true CS, since they typically rely on the same realization of the climate variability. For this methodology, the unresolved internal variability represents a critical roadblock."
In short, one should be very cautious about putting too much weight on any single study using the methodology of Forest and Lewis, because short-term natural internal variability can considerably bias the result on either the high or low side.
Effective vs. Equilibrium Climate Sensitivity
Even though Lewis refers specifically to "equilibrium climate sensitivity," The methodology used by Lewis is also not even necessarily an estimate of equilibrium sensitivity, but rather of effective climate sensitivity, which is a somewhat different parameter. The two may hypothetically be the same if all energy changes in the global climate system are accounted for (and to their credit, Forest and Lewis do include estimates of ocean heat content, including for the deep oceans), and if climate feedbacks remain constant. However, recent research by Armour et al. (2012) suggests that the latter may not be the case.
"Time-variation of the global climate feedback arises naturally when the pattern of surface warming evolves, actuating regional feedbacks of different strengths. This result has substantial implications for our ability to constrain future climate changes from observations of past and present climate states."
Considering the Full Body of Evidence
Lewis' approach is of course just one way to estimate the climate sensitivity. There are many others, as illustrated in Figure 1 from Knutti and Hegerl (2008).

Figure 1: Distributions and ranges for climate sensitivity from different lines of evidence. The circle indicates the most likely value. The thin colored bars indicate very likely value (more than 90% probability). The thicker colored bars indicate likely values (more than 66% probability). Dashed lines indicate no robust constraint on an upper bound. The IPCC likely range (2 to 4.5°C) is indicated by the vertical light blue bar. Adapted from Knutti and Hegerl (2008).
For example, one common way to estimate climate sensitivity is to examine past climate changes (paleoclimate). A project called the PALAEOSENS workshop put together paleoclimate estimates of climate sensitivity from nearly two dozen investigations of many different geological eras, and published their results in the journal Nature. They found that all of these paleoclimate studies resulted in a likely equilibrium climate sensitivity estimate of 2.2–4.8°C surface warming in response to a doubling of atmospheric CO2 (Figure 2).
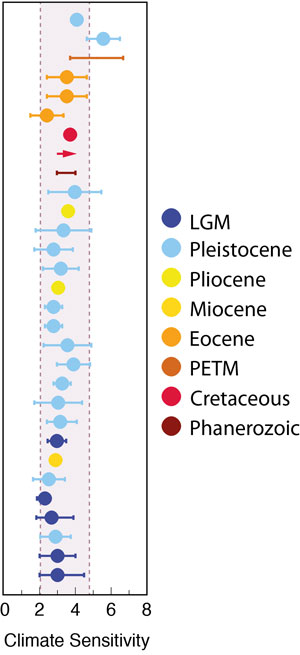
Figure 2: Various paleoclimate-based equilibrium climate sensitivity estimates from a range of geologic eras. Adapted from PALEOSENS (2012) Figure 3a by John Cook.
Note that Lewis' best climate sensitivity estimate of 1.6°C is incompatible with the likely range (68% confidence interval) from these many paleoclimate-based estimates, though it is within the 95% confidence interval (1.1–7.0°C).
In Figure 3, the PALEOSENS team also illustrates the amount of warming we can expect to see at various atmospheric CO2 levels, based on these paleoclimate studies, using several different approaches. Doubling of CO2 from 280 to 560 parts per million results in close to 3°C global surface warming at equilibrium, when accounting for relatively fast feedbacks. The paper also discusses various estimates of 'Earth System Sensitivity', which includes slower feedbacks that operate over thousands of years. They estimate this longer-term warming in response to doubled CO2 would be closer to 7°C.
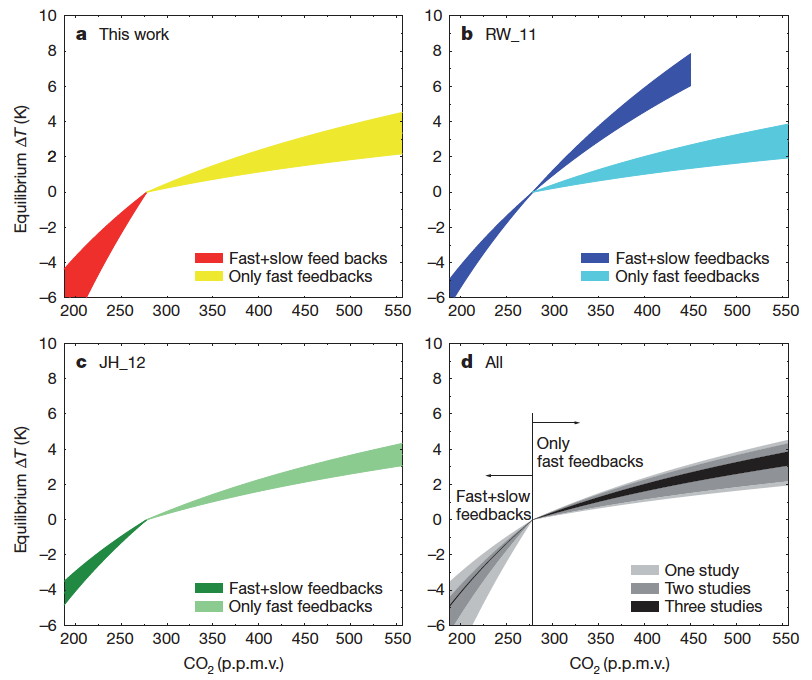
Figure 3: Equilibrium response of the global temperature as a function of CO2 concentrations, based on three different approaches. a) from the PALEOSENS workshop, using data from the late Pleistocene of the past 800 kyr; b) Using data of the past 20 Myr from RW_11; c) Based on JH_12 using similar data of the past 800 kyr as in a); and d) Combination of all three approaches. Plotted areas include uncertainty estimates of one standard deviation.
Misrepresenting Aldrin et al. (2012)
One significant issue in Lewis' paper (in his abstract, in fact) is that in trying to show that his result is not an outlier, he claims that Aldrin et al. (2012) arrived at the same most likely climate sensitivity estimate of 1.6°C, calling his result "identical to those from Aldrin et al. (2012)." However, this is not an accurate representation of their results.
The authors of Aldrin et al. report a mean climate sensitivity value of 2.0°C under certain assumptions that they caution are not directly comparable to climate model-based estimates. When Aldrin et al. include a term for the influences of indirect aerosols and clouds, which they consider to be a more appropriate comparison to estimates such as the IPCC's model-based estimate of ~3°C, they report a sensitivity that increases up to 3.3°C. Their reported value is thus in good agreement with the full body of evidence as detailed in the IPCC report.
Lewis's claimed value of 1.6°C appears nowhere in the paper itself. Rather, Lewis apparently ignored the authors' reported findings in favor of the mode he estimated from graphs in the paper. This misrepresentation both gives a false sense of agreements between the reported senstivity estimates as well as hides the mainstream values reported by the authors of Aldrin et al. These issues are discussed in detail at The Way Things Break along with the relevant figures from the paper.
Most climate sensitivity analyses report the average value rather than the mode, including Alrdin et al. By instead reporting the mode, Lewis is not allowing for an apples-to-apples comparison with most previous climate sensitivity studies. However, this is less of an issue than presenting just one of several climate sensitivity estimates from the Aldrin paper, and one which excludes cloud and indirect aerosol effects.
Beware of Single Study Syndrome
It can be tempting to treat a new study as the be-all and end-all last word on a subject, but that's generally not how science works. Each paper is incorporated into the body of scientific literature and given due weight. It's particularly important not to fall victim to single study syndrome for this type of study, which Olson et al. (2013) documented is subject to large possible biases due to noise from short-term internal variability. As Michael Mann and I noted in a recent article, many people made a similar mistake in giving undue weight to the results of a very similar (not yet published) paper from Aldrin's Norwegian group.
There remains a very large body of evidence consistent with an equilibrium sensitivity most likely close to 3°C surface warming for a doubling of CO2, likely between 2 and 4.5°C. Nic Lewis' result is an outlier, and is inconsistent with past climate changes during many different geologic eras. Another new paper (in press) from Hansen et al. finds that based on paleoclimate data, equilibrium climate sensitivity is likely to be at least 3°C and potentially toward the upper end of the IPCC range, whereas Masters (2013), which is based on recent observational ocean heat content data, suggests the value is toward the lower end of the IPCC range.
It is certainly laudable that Lewis was willing to subject his results to the peer review process, but it's still just one out of many published studies on the subject of climate sensitivity. Every study has its own shortcomings. Paleoclimate estimates are based on past climate conditions which are not identical to those today or in the future, while estimates based on models and recent observations are subject to biases from natural variability and uncertainties such as those associated with aerosols, for example. Ultimately we still can't pin climate sensitivity down better than the IPCC 2–4.5°C range, and we have to be careful not to put too much weight on any single paper.


From comparisons of satellite measurements from 1979-2012 of global temperature with estimates of these temperatures from 1975-2025 by 44 GCMs, Roy Spencer has shown divergence of satellite readings from model readings, with satellite readings indicating weaker warming, than the average from the GCMs. He notes that although the average of the models was higher than the satellite measurements, a few models, usually those with lower climate sensitivity, support weaker warming. These comparisons are in accord with Lewis's suggestion of lower climate sensitivity. Spencer's comparisons are here
dana,
Great post, just what we need. The point about single studies is one that contrarians will ignore of course.
There is some confusion between the Aldrin(2012) paper and the "unpublished Norwegian study". Some commentators seem to think these are the same.
There have been other papers published in the last couple of years, on the transient climate sensitivity (TCS) and the equilibrium climate sensitivity (ECS).
Padilla et al (90% conf 1.3 - 2.6C for TCS)
Gilett et al (1.3 -1.8C for TCS)
Bitz et al (1.72C for TCS)
Schwartz (1.6 to 4.3C for ECS)
Schmittner et al (1.4 to 3.5C likely range for ECS).
Hargreaves et al (2.5C for ECS)
Hansen et al Forthcoming (2 to 4C for ECS)
Putting these with Aldrin (1 - 4C for ECS, PALEOSENS (2.2 to 4.8 for ECS), Lewis (1 - 3C for ECS) is indeed an outlier. However, I think James Annan's point is borne out that values about 4C are increasingly of low probability. How much we should "bet" on that is another matter. A re-drawing of Figure 1 for more recent estimates of ECS would be useful.
Contrarians emphasise the whittling back of the long upper tail in earlier estimates as a reduction in the value of ECS, but this is not so.
PS Does anyone else find the TCS, ECS and now Effective Climate Sensitivity as confusing as I do? I thought I was clear on the TCS and ECS, but now I have to understand another parameter (sigh!). :(
Links to papers:
Padilla et al (90% conf 1.3 - 2.6C for TCS)
http://journals.ametsoc.org/doi/abs/10.1175/2011JCLI3989.1
Gilett et al (1.3 -1.8C for TCS)
http://onlinelibrary.wiley.com/doi/10.1029/2011GL050226/abstract
Bitz et al (1.72C for TCS)
http://journals.ametsoc.org/doi/abs/10.1175/JCLI-D-11-00290.1
Schwartz (1.6 to 4.3C for ECS)
http://www.ecd.bnl.gov/steve/pubs/ObsDetClimSensy.pdf
Schmittner et al (1.4 to 3.5C likely range for ECS).
http://people.oregonstate.edu/~schmita2/pdf/S/schmittner11sci_man.pdf
Hargreaves et al (2.5C for ECS)
http://onlinelibrary.wiley.com/doi/10.1029/2012GL053872/abstract
Hansen et al Forthcoming (2 to 4C for ECS)
http://arxiv.org/vc/arxiv/papers/1211/1211.4846v1.pdf
Mod,
Typo in above post - " I think James Annan's point is borne out that values above 4C are increasingly of low probability."
An acquaintance alerted me to a post on Bihop Hill's blog that a forthcoming paper by Troy Masters estimates ECS as
Dana linked Troy Master's paper at the end of the article, along with the new Hansen paper. I haven't digested the content, but it's very well written.
We've got a lot of evidence emerging from three stands of evidence on sensitivity - paleo, GCM and recent climate. A review article trying to collate these and detect any patterns would be really interesting. Publishable if done well.
My impression is that the recent climate results are coming out lower than the other two, even without taking into account the recent black carbon result. The aerosol uncertainty plays a big role too - if Hansen is right about a higher aerosol forcing then some of the discrepancy is resolved, however most sources I've looked at use lower values than Hansen.
My naive 2-box model gives a TCR of 1.7 with Hansen's forcings (in line with GCMs), dropping to 1.4 for the Potsdam forcings (which are missing the 2nd aerosol indirect effect), and 1.0 if I simply double the black carbon term (I don't know how it should evolve over time though - maybe BC grew earlier, causing the early 20thC warming and plateau).
One very interesting result from the 2-box model is that including the last decade increases rather than decreases the TCR. Adding a few more years of high temperatures pulls TCR up because the hotness of those years is more significant than the lack of trend within that period. This contradicts James Annan's comments on the subject. It would be interesting to investigate that discrepancy.
Here's another: van Hateren http://link.springer.com/article/10.1007/s00382-012-1375-3
TCR of 1.5. He gives a 'millenium scale' sensitivity of 2.0, but with heavy caveats on it.
The big challenge in comparing these is to work out which forcings they've used, and most importantly how big the aerosol term is.
A CS of 1.6C pushes global temperatures >2C above pre-industrial levels in ~100 years at present emission rates.
So even if Lewis (2013) is accepted at face value, it doesn't support a a case for business as usual emissions.
Ray - The issues of satellite vs. radiosonde vs. model temperatures have been long and rather complicated; Thorne et al 2011 has a good review.
Radiosondes have limited sampling and poor consistency in instrumentation over time, satellite data has multiple identified (corrected) and suspected (not) biases, and it may well be that models are insufficiently handling ozone or other factors. Satellite and model results are the furthest apart, with radiosondes somewhere in between. Right now, given the uncertainties in each of these, all that can be said is that the various numbers are not far enough apart given uncertainties to distinguish between their values.
From that report: "...a person with one watch always knows what time it is, but with two watches one is never sure."
I would suggest taking further discussion on those topics to the threads on satellite tropospheric measurements or those on the tropospheric 'hot spot'. Given those uncertainties, I would consider sensitivity estimates from tropospheric temperature model comparisons to be far less accurate than other methods right now.
While recent research has suggested that an equilibrium climate sensitivity (ECS) above +4.5 C is highly unlikely, a meta analysis of all the evidence continues to stubbornly show a best estimate of ECS to be near +3 C.
This is pretty worrisome given that on our current trajectory we will probably quadruple CO2 levels before the end of the century (remember that estimates of ECS are traditionally for "only" a doubling of CO2).
Yet, "skeptics" are trying to reframe the argument by using the Lewis paper (which IMHO looks to have yielded an estimate of transient sensitivity rather than for ECS). "Skeptics" seem to think that a few studies out of literally dozens suggesting a relatively low ECS means that humanity should bargain/bet on ECS being < 2 C so that we can continue on with business as usual. This is both risky and irresponsible. Engineers design components to fail at the upper end of the range, not the most likely value, nevermind the lower range.
I doubt many of us would willingly board an aircraft or spaceship that we have been told meets only the minimum safety criteria. Well, planet earth is our one and only spaceship and we would be prudent to not bet on ECS being < 2 C, especially given the preponderence of evidence to the contrary.
Thanks for putting this together, Dana! Nic Lewis seems unwilling to accept the current (AR5 SOD) aerosol forcing estimate. The total anthropogenic ARF (all direct + indirect effects in terms of adjusted TOA forcing) is -0.9W/m2 since 1750. The most likely range is –1.5 to –0.3 W/m2. Scaling it to 1860 (Lewis' start year) might reduce the aerosol forcing slightly to -0.7 or -0.8 W/m2. However, his prior for the total ARF distribution lies between +0.5 and -1.5 W/m2. Correspondingly, he got a median posterior of -0.3 W/m2 with his method. It is certainly a underestimate, no doubt about that. So I don't put much credibility into his most likely ECS values, as they are an underestimate too (perhaps strongly so). He put an aerosol forcing which he believed to be true and he got a low ECS which he (apparantly) wishes to be true. What a surprise! I am underwhelmed ...
I really don't understand why no one has bothered to check the assumptions which went into his approach. Why hasn't the unwarrantedly low aerosol forcing prior not been picked up during peer review? I am a bit surprised to see what makes it through peer review as of late. Perhaps just stronger awareness or pure coincidence.
Hi Karsten @ 10,
"Correspondingly, he got a median posterior of -0.3 W/m2 with his method. It is certainly a underestimate, no doubt about that. So I don't put much credibility into his most likely ECS values, as they are an underestimate too (perhaps strongly so)."
You have just raised a huge red flag. His value for aerosol forcing is undoubtably wrong and as such way too small.
Remember, peer review is not perfect. Also, this paper was published in a reputable journal, but even they err from time-to-time. It is my understanding from what Lewis has been saying that two of the reviewers were very tough. They allegedly even brought in a forth reviewer to help settle things.
Regardless, the true test of Lewis starts when it appears in press. Somehow I very much doubt that it will stand the test of time. With that all said, kudos to Lewis for submitting his work for peer review; it also shows that there is no censoring going on in journals as "skeptics" claim.
Interesting point, Karsten. That's an issue with a Bayesian approach - it's important to use accurate informed priors.
It bothers me a bit that the misrepresentation of Aldrin's results and calling this an estimate of equilibrium sensitivity weren't caught during the peer-review process, or at least weren't fixed in the final version. It's possible that the issues were raised in the extensive review comments but Lewis disagreed and the editor allowed the errors to be published. Whatever the reason, those are significant issues with the paper, in my opinion. He should at least have discussed the relationship between effective and equilibrium sensitivity. As it stands, the paper simply says it's estimating equilibrium sensitivity, which isn't accurate. And the Aldrin error being in the abstract is unfortunate too.
Dana @12,
Agreed. The misrepresentation of Aldrin et al by Lewis is egregious and should have been caught. The journal can still correct the paper (the online version is an "early release" and not necessarily the final version), or failing that Lewis should publish a corrigendum.
It's not that Nic wouldn't have been aware of the aerosol forcing issue. PaulS and myself, we had an interesting discussion with him over at James Place. His reluctancy to accept the opinion of other (more informed) people on the subject struck me as quite bold. Realizing that he didn't even discuss the uncertainties regarding the aerosol prior in the paper, is something which I consider a huge disappointment. Had he applied a more objective areosol forcing estimate (one may think of an "expert prior"), he wouldn't have come up with such a low ECS (or effective CS for that matter) number. I think he missed the opportunity to demonstrate that his method is superior to Forster et al. 2006 (who were using uniform priors). Too bad ...
K.a.r.S.t.e.n
# 10; # 14
I remember your discussion with NL and PaulS at James Annan's very well. And most illuminating it was too. What puzzles me (troubles me?) about this is that this study has been accepted by J. Climate (not say, E & E) after an apparently long period under review and yet these questions apparently remain outstanding.
Dana, Aldrin et al quote a mean CS of 2 C. Lewis quotes the mode of the Aldrin PDF on climate sensitivity as 1.6 C, which is correct. The confusion arises because he is citing a different value.
Lewis, in fact, has a penchant for quoting the mode of climate sensitivity analyses because it is, as he says, the maximum likilihood result. Personally I do not think it is the best value to quote. Rather the median (where it can be determined), ie, the 50/50 mark is far more informative if you must quote a single number. Of course, with a long tailed PDF, the mode will always be less than both the median and the mean of the PDF. Without going so far as to say that is Lewis' reason for preferring it, that does make it a tremendously convenient number for "skeptics" to quote.
BBD @15, the main result of Lewis 2013 is the different approach to bayesian estimates of climate sensitivity, ie, the application of uniform priors to the observations rather than to the parameters. Regardless of the merits of the final estimate of CS, if that method is not transparently flawed it should be placed before the scientific community so that its merits can be discussed and analyzed.
As to the estimate of climate sensitiivty itself, it uses the output of a single 2 dimensional model to quantify likilihood of the three paramaters. Consequently it is no better than the accuraccy of that model. Further, the final quoted value depends on the addition of a number of La Nina effected years to the data. Given the use of a 2-D climate model, there is no way the effects of El Nino on temperature are modelled, and in consequence the resultant estimate of climate sensitivity is certainly too low. The 2.4 K mode quoted for the change of method only is therefore more likely to be accurate than Lewis' final result. Ideally, given that the model does not account for ENSO, it should be used against ENSO adjusted temperature data, such as that from Foster and Rahmstorf. Doing so will likely give a mode between 1.6 and 2.4 K, but closer to the later than the former; and is likely to give a mean value (the value cited by the IPCC and therefore the correct comparison with the IPCC range) slightly higher than that.
Moderator [JH]
Unless you have just added the defintion of PDF to your glossary, it is already there. The term is underscored in text and the definition appears in a pop-up when the cursor is passed over it.
[JH] I may have been viewing it on the rolling summary of all comments. It appears that our nifty glossary does not do its magic in that venue.
Tom Curtis # 17
By happy coincidence I have just said the exact same thing as your first paragraph in a comment elsewhere ;-)
I haven't read the paper (only the blog posts NL has made elsewhere) but I suspect that what you go on to say is correct. Must reserve judgement for now, though.
BBD @19, I also haven't read the paper. However, based on the abstract, the main result, ie, that which is discussed first, is the change in methodology and its effect on the climate sensitivity estimate. Of course, Lewis may want to put his revised low CS estimate up front in discussion, but that should not be assumed to be the reason the paper was published.
Tom Curtis, #17,
My Master's thesis supervisor always emphasised that in Bayesian Methods, the parameters took on probabilities, and the data was regarded as a static "given", somewhat the reverse of Frequentist Methods. Lewis' work does seem to be a departure from that, and possibly has philosphical implications?
The key moves seem to be "whitening" the observations by an "optimal fingerprint transformation", using Bayes to derive a PDF for the data. Another move is a "dimensionally reducing change of variables" in the parameter space. I am just summarising the abstract, but this is claimed to result in the tightly constrained estimates. The suspicion is that the "tight constraint" is the subjective motivation rather than the objective result.
Unfortunately, my own knowledge is insufficient to properly critique his methods, but I hope somebody does. After all, the statisticians flocked around to "help" Michael Mann! If they can do it for a physicist, they can do it for a retired businessman.
Albatross #9 gives the best synopsis in my view - the meta-estimate of ECS is still stubbornly in the 2.5-3C range, and I somehow doubt if we will even pin it down more accurately. Deniers are just arguing the decimal points, as Professor Scott Denning told the Heartland Institute in 2011, but of course they did not listen then either.
Tom @16 - to be precise, Lewis is quoting what he thinks the mode of the Aldrin PDF is. I'm fairly sure that Aldrin never reports that mode. That being said, the abstract does say he's comparing the modes of the two studies.
I should also note again that he's only looking at the Aldrin sensitivity distribution that excludes cloud and aerosol effects when he uses that 1.6°C mode figure.
Dana @22 & 23, the mode (unlike other parameters) is easilly estimated from the PDF shown in Fig 6 a. Using a pixel count, I can confirm the estimate of 1.6 C for the mode of the main analysis.
Contrary to your main article, this is not "simply a misrepresentation" of Aldrin et al. It is misleading in that he does not point out the difference between the modal value and the central estimate commonly quoted for the IPCC, and that they are not directly comparable. However, it is not incorrect on any matter of fact. That is, the modal value of Aldrin et al is the value Lewis quotes, and he does specify that it is the modal value he is citing. Consequently, as it stands, your section on "Misrepresenting Aldrin" is more misleading than is Lewis' citation of Aldrin.
Further, Aldrin et al do not exclude cloud and aerosol effects in general. The nine forcings included in the main analysis are specified as:
(My emphasis)
Aldrin et al do exclude cloud lifetime effects from the main analysis and other cloud effects (ie, other than the aerosol indirect effect and cloud life time effects) from all analyses. As these are not defined as forcings in the IPCC AR4, they may or may not be included in other estimates of climate sensitivity. De facto, they will be included in purely observational estimates, but their inclusion in model based estimates (or hybrid estimates such as Lewis 2013) may well be doubtfull.
For what it is worth, by eyeball, inclusion of a cloud lifetime effect of -0.25 W/m^2 lifts Aldrin's modal estimate of climate sensitivity to about 1.8 C, and including a feedback of -0.5 W/m^2 lifts it to about 2.2 C. Aldrin et al cite confidence interval for the effect of -0 to -1.5 C from Isaksen et al (2009), and from consulting the figures for Isaksen et al (it is pay walled), the mean estimate is about -0.3 W/m^2.
Much to ponder.
Without going so far as to suggest that this study is intended as a distratction, there is no doubt that it will be used as such in the 'debate'.
Perhaps this bears repeating:
# 21 shoyemore:
Thanks Tom!
In order to be more transparent, I uploaded the principal figure from Lewis 2013 (Fig 3). It shows the posterior PDFs in comparison with Forest et al. 2006 (which I erroneously referred to as Forster et al. 2006 in #14):
Figure caption: "Marginal posterior PDFs for the three climate system parameters by diagnostics employed, method used and either upper-air diagnostic EOF truncation parameter (panels a, b and c) or surface diagnostic EOF truncation parameter (panels d, e and f). Panels a, b and c use the F06 diagnostics; panels d, e, and f use revised surface and deep-ocean diagnostics, and no upper-air diagnostic. Panels show marginal posterior PDFs for, from the top, Seq (ECS), Kv (effective vertical deep-ocean diffusivity) and Faer (total aerosol forcing). In panels a, b and c, the solid red lines show marginal PDFs using the new objective Bayesian method and kua=12 (number of EOFs for upper air (ua) and surface (sfc) diagnostics), while marginal PDFs using the F06 method are shown at kua=12 (solid green lines) and at kua=14, as used in F06, (dashed blue lines) , and the dotted black lines show the published F06 PDFs. In panels d, e and f, marginal PDFs using the new objective Bayesian method are shown with ksfc=16 (solid red lines) and ksfc=14 (dotted blue lines), while corresponding marginal PDFs using the F06 method are shown with respectively solid green and dotted black lines. The box plots indicate boundaries, to the nearest fine grid value, for the percentiles 5–95 (vertical bar at ends), 25–75 (box-ends), and 50 (vertical bar in box). Parameter ranges are given by plot boundaries."
His prior assumptions for Seq, Kv and Faer are: 0.5 to 15 K, 0 to 64 cm2/s, -1.5 to 0.5 W/m2.
He explicitly states that: "Faer represents net forcing (direct and indirect) during the 1980s relative to pre-1860 levels, and implicitly includes omitted forcings with patterns similar to those of sulfate aerosols." As aerosol forcing seems the most constrained parameter, I wonder what a small shift in the prior to a more plausible range of -1.5 to 0.0 W/m2 would do to the final results. Given that the F06 aerosol forcing mode isn't too far off the one in Lewis 2013, it seems that the method is very sensitive to the prior choice. I might very well be wrong in this regard.
Note that there the paper comes with Supporting Information, which isn't available yet.
OK, this question has finally puched me into what I've been meaning to do for a long time, and get my simple response function model online.
With this you can vary the strength of the different forcings and see how that affects the fit to 20thC climate, the TCR and the RCP projections, as well as a few other things. You can also see the effect of switching between GISS and Potsdam forcings.
While on defaults the model gives a very similar result to CMIP-5 projections, that proves nothing. Try switching to the Potsdam forcings and you get a smaller response. Try doubling the Black Carbon term (in line with the recent study) and you get a yet smaller term. The main take-home is that while current forcing can explain 20thC climate, the forcing are sufficiently uncertain that this doesn't allow us to very significantly constrain future climate change.
A few notes:
1. I don't think the Potsdam forcings include the 2nd aerosol indirect effect. You can try multiplying it by 1.5 to compensate.
2. Hansen's aerosol forcing is larger than most.
3. I've rushed this out, there may well be mistakes.
4. Start date is fixed at 1880, so not directly comparable.
See what you can do with it.
I'm not following this closely, but the implication is that Nic Lewis is a known climate contrarian. This would make his exercise, laudable admittedly for peer review publication, an excercise in motivated reasoning. Now admittedly there are good reasons to try to find out how you can create low ECS estimates. Determining what ECS is most sensitive to would seem a sensible procedure. But the question of biases built into Bayesian priors, the ability to skew the results as a result of those choices coming from a prior advocacy position sets a Bayesian prior of its own: Will a contrarian cherry pick to get a desireable result? Wouldn't past history with Watts and crew suggest that the Bayesian prior for this would be a strong "Yes"? Will Bayesian priors selected by a contrarian be likely to face questioning by Climate Hawks? Undoubtedly the prior here is a strong yes also.
So, as part of any exposition on this, should we be looking to experimental determinations rather simply allowing people to make prior estimates? (When I retire I'm really going to have to take some refresher stat classes)
Dave123,
I tried to address this in #21. Lewis claim is that his transformations of the data and the parameter space renders his prior distributions objective, and makes his results tightly constrained. I lack the experience to pass judgment, but I am sure somebody can. From earlier discussions, James Annan (who also uses Bayesian methods, as do many climate scientists) has previously said he sees nothing wrong with Lewis' methods. Perhaps the best person to look at it might be Andrew Gelman, a well-known Bayesian statistician at Columbia U, author of many books, who blogs here:
http://andrewgelman.com/
KR #8 To give credit where credit is due, the two different clocks analogy is based on Einstein's Special Theory of Relativity from the following paper "ON THE ELECTRODYNAMICS OF MOVING BODIES" By A. Einstein, June 30, 1905.
[DB] Hyperlinked paper.
It seems inconsistent to cite a single paper (Olsen et al 2013) to buttress a point, when citing single studies is repeatedly advised against.
Dana, if Tom Cutrtis is right, and the modal value Lewis gives is consistent with Aldrin, you should update the article. You will need to revise your argument on that.
Barry@31,
Dana might disagree with me, but the following text from Dana's post is correct:
"Lewis's claimed value of 1.6°C appears nowhere in the paper itself. Rather, Lewis apparently ignored the authors' reported findings in favor of a value he estimated from graphs in the paper"
What Lewis did amounts to cherry picking and in turn being deceptive.
As for your claim that:
"It seems inconsistent to cite a single paper (Olsen et al 2013) to buttress a point, when citing single studies is repeatedly advised against."
Nonsense. Please stop trying to bait people, your argument makes no sense in the context of the discussion.
Albatross @32, Dana correctly describes Lewis as claiming that the mode (most likely climate sensitivity) of his result is identical to the mode of Aldrin et al, but then incorrectly calls that claim a simple misrepresentation. It is not a misrepresentation. The modes of the two studies are identical to the first decimal point. It is, however, misleading in that it is an apples and oranges comparison. Given that other studies report the mean, in comparing with other studies the mean should be reported, or it should be made absolutely clear that not only are you reporting the mode, but that the authors you are reporting on reported the mean.
Dana then engages in his own apples and oranges comparison, stating (correctly) that Aldrin et al reported a climate sensitivity of 2 C, without stating that it was the mean. As the preceding paragraph mentioned only modes of the climate sensitivities, contextually that indicates that Aldrin reported the mode, which is false. It thereby creates a misleading impression. It further misleads because the requirement to be responsive is ignored. It appears that Dana is contradicting Lewis, whereas he is merely reporting a different value. As it is his clear intention to rebut Lewis, readers should be able to reasonably expect that his counter evidence will be responsive.
Further, the claim that the 1.6 C modal value appears nowhere in the paper is at best an evasion, and at worst directly untrue. The figures are part of the paper, and the information in the figures therefore appears in the paper. As such, the modal value of the main analysis, which is easilly identified from the figures, appears in the paper. Dana is welcome to show that the figure does not show a modal value of 1.6 C if he likes, but simply pretending it is not part of the paper is not appropriate.
It would be easy to correct the article by removing these flaws. The discussion could be replaced with an informative discussion of the reason climate sensitivity studies report means (or central estimates) and why reporting only the mode in making those comparisons is misleading.
Hi Tom @33,
Either Dana or I will respond to your post, but I for one would like to investigate this more closely before doing so. Thanks for your patience.
Albatross,
I often point out to people ('skeptics', usually) the error of relying on a single study, and most often it is with climate sensitivity estimates. It's good to see that caution explained here. I'm not trying to bait anyone. After reading at several places in the article that one should not lean on a single study, it simply leapt out at me that this had been done to make a point about uncertainty on climate sensitivity estimates from intermediate complexity models. Is it inappropriate to apply the same standard to this question as it is to climate sensitivity estimates?
Andy, thanks for this thoughtful piece. When you wrote this statement, though:
" Taken to an extreme, that viewpoint can lead to a fatalistic approach, in which efforts to mitigate climate change by cutting emissions are seen as futile"
it concerned me that you might be falling into a syndrome I usually associate with the denialist camp--deciding what the science should be based on what we think people's reaction to the science might be. I believe it was Inhofe that was quoted as saying that he believed in GW till he started looking into some of the policy and tax implications of dealing with it. Then he decided not to believe in it any more.
I don't think we want to do the same thing on the other side. If even some legitimate science points to feedbacks leading to some version of 'run way' global warming, we should consider that this is a posiblity, and not reject it merely because we think it might have an effect on some people's psychology that might be detrimental to the 'cause.'
I am thinking especially of the MacDougal study that came out last fall on permafrost thaw, that you and a number of other sites covered. An honest presentation of the science, it seems to me, should include that crucial study, even if you then decide it is flawed in some way, or just one study needing further confirmation...
We have to front the facts that the best science presents us with, not pick and choose whatever articles fit into our emotional landscape (or into the imagined emotional landscape of others).
It is good form to flag when you have changed the text of an article post-publication, as they do at realclimate. I see Tom Curtis' notes have been taken up re the changed text around the Aldrin study section. Hat tip to you, Tom.
Nick's misrepresentation of the Aldrin et al. paper is egregious. And make no mistake, it is a misrepresentation as Dana has shown and as I will again demonstrate below.
Additionally, nowhere in AR4 or meta analysis papers on climate sensitivity (e.g., Knutti and Hegerl 2008) that I am aware of do they use the mode to quantify climate sensitivity. They use either the median and interquartile range or confidence intervals. It is quite the coincidence that Lewis managed to find the one value (of many) in Aldrin et al's extensive data analysis that fits his desired narrative for a lower climate sensitivity.
Lewis could only obtain his desired number by using three cherry picks:
1) Using the mode rather than median
2) Ignoring Aldrin et al's higher sensitivity when including the indirect aerosol effect
3) Ignoring Aldrin et al's even higher sensitivity when including the impacts of clouds
Now including #2 and #3 above act to make the estimates more consistent and inline with processes the real world. That is, higher. Yet, Lewis decided to ignore those values... ;)
What Lewis has done is to cherry pick a particular scenario, then cherry pick a unconventional measure of climate sensitivity from Aldrin et al. (a value that Aldrin et al. did not even explicitly calculate or speak to anywhere in their paper) and then elevate it to front-and-centre in his abstract.
Sorry, but the above actions reveal Lewis's bias/agenda. It would also be very disappointing if a prestigious journal like J. Climate were to turn a blind eye to such shenanigans.
PS: As Barry noted at #37, Dana did edit the post based on Tom's recommendation.
Barry @35,
You claim:
"I often point out to people ('skeptics', usually) the error of relying on a single study, and most often it is with climate sensitivity estimates. It's good to see that caution explained here. I'm not trying to bait anyone."
I'm open to the possibiity that there has been a misunderstanding on my part. But the fact is that there are multiple, independent lines of evidence that still point to a best estimate of equilibrium climate sensitivity (ECS) near +3 C for doubling of CO2. As far as the limitations of using the instrumented record to estimate ECS go, Dana happened to cite one study, but there are more. For example, below is a quote from Knutti and Hegerl (2008) when referring to using the surface record and the climate's response to volcanic eruptions (such as Pinatubo) to estimate ECS [my bolding]:
"The advantage of these methods is that they consider a state of the climate similar to today’s and use similar timescales of observations to the projections we are interested in, thus providing constraints on the overall feedbacks operating today. However, the distributions are wide and cannot exclude high sensitivities. The main reason is that it cannot be excluded that a strong aerosol forcing or a large ocean heat uptake might have hidden a strong greenhouse warming."
I will (if the moderators permit) post a rather belated response to comments made by Albatross on 1 May, just to set the record straight.
I made no misrepresentation of the Aldrin et al.(2012) paper. Dealing with Albatross's numbered claims:
1) The claim that nowhere in AR4 is the mode used to quantify climate sensitivity is ludicrous. Figure 9.20 in AR4 WG1 gives climate sensitivity PDFs from a number of observationally-constrained studies. Figure 9.20 showed the median and mode (the median being marked with a dot in the uncertainty range bar, the mode being visually obvious). And the accompanying Chapter 9 text states "This figure shows that best estimates of the ECS (mode of the estimated PDFs) typically range between 1.2°C and 4°C". Far from disparaging the mode, the IPCC describe it as the best estimate.
In addition to the mode, AR4 referred to the median – the value with equal probability (area under the PDF) above and below it. However, it would have been difficult to be certain of the accuracy of a median estimate measured from Figure 6.a) of Aldrin et al 2012, and the mode has the advantage of being less affected than the median by the choice of prior distribution. I do not consider the mean, quoted by Aldrin et al., to be a suitable central measure for climate sensitivity PDFs, because the PDFs are skewed. Consistent with my view, the relevant chapter of IPCC AR4 refers to modes and medians for climate sensitivity estimates, but not to means. The IPCC also gives uncertainty ranges for climate sensitivity estimates. Likewise, I gave in my paper the 5–95% climate sensitivity range for the main Aldrin et al. (2012) results, of 1.2–3.5°C.
2) Albatross repeats the unfounded claim by Dana Nuccitelli that the main results climate sensitivity estimate I cite from Aldrin's study excludes cloud and indirect aerosol effects. It seems that neither of them have read Aldrin et al (2012); certainly they lack even a basic understanding on this point. Sections 2.3 and 4.8 of the paper show that the study did include indirect aerosol forcing (cloud albedo effect), and Table 1 and Figure 4 of the Supplementary material give details of the prior distribution used for the main results.
3) In support of his misrepresentation allegation, Albatross goes on to draw on Nuccitelli's claim that "When Aldrin et al. include a term for the influences of indirect aerosols and clouds, which they consider to be a more appropriate comparison to estimates such as the IPCC's model-based estimate of ~3°C, they report a sensitivity that increases up to 3.3°C". As stated under 2) above, the Aldrin et al. (2012) study does make allowance for a negative cloud albedo indirect aerosol effect. Its main results do not make explicit allowance for any cloud lifetime indirect aerosol effects.
However, if Albatross or Nuccitelli understood Bayesian statistical inference and the relevant climate science, and had studied Aldrin et al.'s paper closely, they would realise that, as it is a hemispherically-resolving observationally-based study, all indirect aerosol effects, including any negative cloud lifetime effect, would already be fully reflected in the (posterior PDF) estimate of the cloud albedo indirect aerosol effect. Only if the prior distribution for the aerosol indirect effect did not extend to sufficiently negative values would that not be so. But the 2nd panel of Figure 15 in Aldrin et al.'s Supplementary Material shows that, far from that being the case, the 95% uncertainty range for the aerosol indirect effect prior distribution extends well beyond the 95% range for the posterior PDF on the negative side, but not on the positive side. Therefore, the observational evidence for any actual negative cloud lifetime effect will be fully reflected in the main results.
However, when the aerosol indirect effect prior distribution is made more negative still to allow for a possible negative cloud lifetime effect, it overlaps even less with the values implied by the observations. Therefore, the resulting increase in estimated climate sensitivity merely reflects the new prior assumption, that the cloud lifetime effect is material, overriding the best observational evidence. Moreover, recent mainstream estimates of the uncertainty range for total indirect aerosol forcing are much less negative than that assumed by Aldrin et al. Accordingly, Aldrin et al.'s main results sensitivity estimate is the appropriate one to compare with the IPCC's estimates, not the alternative estimates with even more negative aerosol forcing prior distributions.
Incidentally, Karsten's comments about aerosol forcing estimates in my study are also completely wrong, and show a fundamental lack of understanding of the estimation methods used.
I also take this opportunity to comment on some other unfounded claims made by Dana Nuccitelli in the main 'Nic Lewis single study syndrome' article
a) Nuccitelli claims: "The methodology used by Lewis is also not even necessarily an estimate of equilibrium sensitivity, but rather of effectiveclimate sensitivity, which is a somewhat different parameter."
I believe that the methodology I used does actually estimate equilibrium climate sensitivity. I suggest that Nuccitelli reads the relevant papers by Chris Forest and his co-authors if he wants to understand why that is. In any event, I would point out that the x-axis of Fig 9.20 in the IPCC AR4 WG1 report, where the F06 and other sensitivity PDFs were shown, is labelled "Equilibrium Climate Sensitivity" and in the text the estimates are described as being of equilibrium climate sensitivity (using the acronym ECS), notwithstanding that several of the studies (such as Gregory 02 and Forster/Gregory 06) actually estimated Effective Climate Sensitivity, indicating that the IPCC, correctly in my view, in practice sees very little difference between the two.
certainly are for estimates of effective climate sensitivity. That indicates that the IPCC authors, correctly in my view, see little practical difference between estimates of effective climate sensitivity and estimates of equilibrium climate sensitivity.
b) Nuccitelli floated "The Climate Variability Question Mark in Lewis' Approach". Referring to the 2013 study by Olson et al., he stated that they investigate "three main sources of what they call "unresolved climate noise": (i) climate model error; (ii) unresolved internal climate variability; and (iii) observational error".
In fact, Olson et al. focus only on item (ii). Their findings have limited relevance to my study, which (a) makes due allowance for internal climate variability and the uncertainty arising therefrom; (b) does not attempt (as Olson et al. did) to estimate aerosol forcing from purely global temperature measurements; and (c) avoids the uniform priors they use.
c) Nuccitelli stated that my paper was an outlier. If it were, as his title suggested, the only study showing a low climate sensitivity – one below the bottom of the IPCC 4th assessment report (AR4) 2–4.5°C 'likely' (2/3rds probability) range – then that would be a fair point. But it seems increasingly clear that warming over the instrumental period (from the mid/late nineteenth century to date) indicates a lower 'likely' range for climate sensitivity than 2–4.5°C.
As well as the Norwegian study (Skeie et al.) to which Nuccitelli referred, four recent peer-reviewed instrumental-observation-constrained studies (Ring et al, 2012, Atmospheric and Climate Sciences; Aldrin et al., 2012, Environmetrics; Otto et al., 2013, Nature Geoscience; and Masters, 2013, Climate Dynamics) all point to a considerably lower 'likely' range for climate sensitivity than 2–4.5°C.
d) Nuccitelli stated that the Bayesian approach I employed involves "making use of prior knowledge of climate changes to establish a probability distribution function for climate sensitivity".
In fact, the purpose of my using an objective Bayesian approach was to avoid making use of prior knowledge or assumptions about the likely values of the climate system parameters being estimated. Typically, Bayesian climate sensitivity studies have inappropriately used a wide uniform prior distribution for climate sensitivity (and often for other key parameters), and thereby greatly exaggerated the risk of climate sensitivity being high.
Then you're wrong, as is rather obvious from the fact that you're using data from a system that is well out of equilibrium. Now you can try to argue that effective and equilibrium sensitivity are identical - I've discussed reasons to very much doubt that - but you're clearly estimating effective, not equilibrium sensivity.
It clearly is. The existence of one or two similar results (Skeie is unpublished and Aldrin does not have similar results, as discussed in the above post) does not change that - there can be multiple outliers in any data set.
dana@ 41, Lewis is correct that the paper reports equilibrium climate sensitivity. The method in the paper is to run a simple model with a tunable climate sensitivity, and from this to develop a PDF of the best prediction of transient response. The climate sensitivity needed to give that best prediction of transient response is then the result of the paper. The paper states (section 3.1):
In fact, the approach used by Aldrin really represents a model based estimate of climate sensitivity, the main difference from more conventional model based estimates being that he uses the simplicity of the model to do multiple runs and thus generate a PDF. As a model based estimate, it is no more reliable than the model used. In this case the model used has surface water downwelling in polar oceans and abyssal water upwelling in the tropics, entirely contrary to the thermohaline circulation. Given that, and that the estimate is an outlier, it must be considered dubious.
An ammendment to my post @42. I clearly became confused between the paper on which Lewis based his method and Aldrin et al. Nevertheless, the methods are very similar so that the method reports an equilibrium climate response is still correct.
I believe what you're describing is an effective sensitivity calculation and calling it equilibrium sensitivity, Tom.
dana, the process is that they select the equilibrium climate sensitivity that, in the model gives the best match to the effective climate sensitivity, but then report the equilibrium climate sensitivity. So they are comparing effective responses, but reporting equilibrium climate sensitivity.