


 Arguments


Recent Comments
Prev 1000 1001 1002 1003 1004 1005 1006 1007 1008 1009 1010 1011 1012 1013 1014 1015 Next
Comments 50351 to 50400:
-
JosHagelaars at 21:08 PM on 27 December 2012Contrary to Contrarian Claims, IPCC Temperature Projections Have Been Exceptionally Accurate
Dana, many thanks for the informative posting. I compared your figure 9 for the A4 multi-model projections with this figure of Gavin Schmidt. Schmidt plotted the observational data together with the A1B model data and due to i.a. the La-Nina's in 2008 and 2011 the observations are running a bit lower than the model average. This is also visible in your figure 9, but due to the different scaling it is less distinct than in the RealClimate image. How would the scaling you use in figure 9 work out for the hindcast as is shown in the RealClimate image? I checked the IPCC A2 model data and calculated a warming trend over 2000-2012 from the average of the A2 model data and got 0.19 °C/decade (ranging from min 0.03 to max 0.35). You got 0.16 °C/decade. Am I using the wrong data? -
John Russell at 21:04 PM on 27 December 2012Contrary to Contrarian Claims, IPCC Temperature Projections Have Been Exceptionally Accurate
I just noticed that one can drag-and-drop the '©' symbol from the bottom left corner of this page where it says '© Copyright 2012 John Cook'. Can I suggest a degree (°) symbol is placed somewhere near there—or alongside the heading 'Post a Comment'—then anyone can drag and drop it into their comment while typing. Speaking personally I'd also like a '—' character too. I usually have to use two hyphens--like this--but the correct symbol would be useful. -
mikeh1 at 20:21 PM on 27 December 2012Contrary to Contrarian Claims, IPCC Temperature Projections Have Been Exceptionally Accurate
@Doug H "& deg;" is a HTML code which applies to all op systems. See the full list here. http://www.w3schools.com/tags/ref_entities.asp -
John Mason at 20:08 PM on 27 December 2012Food Security: the first big hit from Climate Change will be to our pockets
Joe (#7) - yes I'm sure I have some stuff at home which I'll dig into when I get back. My personal experience of one C3 plant - the potato - is that if there's one thing guaranteed to lead to wipeout - as the Irish sadly discovered in the early 19th Century - is prolonged and very damp, humid and mild conditions - the conditions under which blight thrives. So we have two clear sets of variables (among many) to contend with here - potential yield and potential hazards (biological, meteorological and so on). -
Doug Hutcheson at 17:53 PM on 27 December 2012Contrary to Contrarian Claims, IPCC Temperature Projections Have Been Exceptionally Accurate
dana1981 @ 8, thanks for the explanation. FAR and SAR were based on models using a lower ECS than the IPCC thought they were using. I take it that the graphs would look different again (worse), if we plugged in the current best estimate for ECS (3°C). As for the degree symbol, I am using Linux. It turns out that I can use the HTML code '& deg;' with no spaces - see this page. -
dana1981 at 17:24 PM on 27 December 2012Contrary to Contrarian Claims, IPCC Temperature Projections Have Been Exceptionally Accurate
Doug @3 - no, what I was trying to say is that the FAR and SAR thought they were using models with 2.5°C ECS; however, because they overestimated the forcing associated with doubled CO2, the actual ECS of the models was about 2.1°C. All I've done in my graphs is take actual GHG emissions into account - I haven't done anything with regards to climate sensitivity there. On a Mac the degree symbol is shift-option-8, by the way. On a PC it's Alt-176 I think. -
Rob Honeycutt at 14:46 PM on 27 December 2012Contrary to Contrarian Claims, IPCC Temperature Projections Have Been Exceptionally Accurate
Well, Dana has special cyborg powers, so creating such symbols is easy for him. ;-) -
Doug Hutcheson at 13:50 PM on 27 December 2012Contrary to Contrarian Claims, IPCC Temperature Projections Have Been Exceptionally Accurate
Rob @ 5, yes, it was because Dana is using it that I thought it must be invoked by using special html code. The standard HTML for superscript is 'sup', but that does not work here. Never thought of cutting and pasting it - doh! "8-\ -
Rob Honeycutt at 13:37 PM on 27 December 2012Contrary to Contrarian Claims, IPCC Temperature Projections Have Been Exceptionally Accurate
Hm... No sooner did I post that then I noticed Dana able to use the ° symbol. (I just cut and pasted it from Dana's post.) -
Rob Honeycutt at 13:35 PM on 27 December 2012Contrary to Contrarian Claims, IPCC Temperature Projections Have Been Exceptionally Accurate
Doug... I'd suggest just using "C" to denote temp. That's pretty much the standard format used everywhere. Remember, lots of folks are in the US where the degree symbol will be construed as degrees F. -
Doug Hutcheson at 12:55 PM on 27 December 2012Contrary to Contrarian Claims, IPCC Temperature Projections Have Been Exceptionally Accurate
dana1981 @ 2, I'm still confused, so I am obviously missing something. If I have read the OP correctly, FAR and SAR originally used 2.5o ECS, the revised graphs were based on 2.1o and the real ECS is approx. 3o. To my confused little mind, the revised graphs should use 3o. Where am I going wrong? PS: I still cannot get superscript tags to work, to render the degrees symbol: I am using the HTML codes 'sup' and '/sup' inside pointed brackets, but that is not working. -
villabolo at 12:37 PM on 27 December 2012Food Security: the first big hit from Climate Change will be to our pockets
Doug @ #10 I think that the attitude the conservative elite in the US, political and religious, have regarding disaster victims will spark civil unrest at some time in the near future. These people are so arrogant as to blame the victims of Sandy and Katrina for their plight. They actually state that the homeless were negligent because they chose not to have flood insurance! As for the role that religion will play in the future we have no further than the past to look for answers. The clerical elite will serve as an opiate for the masses to deaden the pain. Yes we're living in interesting times. -
dana1981 at 12:24 PM on 27 December 2012Contrary to Contrarian Claims, IPCC Temperature Projections Have Been Exceptionally Accurate
Thanks Doug @1, typo fixed. Yes, the current best equilibrium climate sensitivity (ECS) estimate is 3°C. However, remember that's equilibrium sensitivity, and we're far out of equilibrium. More relevant would be the transient climate response, but that wasn't reported in earlier IPCC reports. It's not so simple as adjusting for lower ECS, because it could just be that the model transient response is too fast or too slow, irrespective of ECS. So while the 'best estimate' models in the FAR and SAR had roughly 2.1°C ECS, we don't know what their transient climate responses were, so we can't adjust for that. -
Doug Hutcheson at 12:04 PM on 27 December 2012Contrary to Contrarian Claims, IPCC Temperature Projections Have Been Exceptionally Accurate
Minor niggle: under 'Don Easterbook' you have the typo 'bsaed', instead of 'based'.The SAR also maintained the "best estimate" equilibrium climate sensitivity used in the FAR of 2.5°C for a doubling of atmospheric CO2. However, as in the FAR, because climate scientists at the time believed a doubling of atmospheric CO2 would cause a larger global heat imbalance than current estimates, the actual "best estimate" model sensitivity was closer to 2.1°C for doubled CO2.
I'm confused by this. I thought the current best estimate of equilibrium sensitivity was about 3oC? I gather from the text that, if we take models used in FAR and apply a 2.1oC sensitivity, we come closer to observations. Is that a correct understanding, or am I missing the point? Mods: what is the correct code to render a degree sign? -
Doug Hutcheson at 11:37 AM on 27 December 2012Food Security: the first big hit from Climate Change will be to our pockets
villabolo @ 9, the future I see as increasingly likely, is one of mass unrest. It is said that we are only three meals from anarchy and our supermarkets habitually keep about three days' supplies on hand, being utterly dependent upon just-in-time deliveries of food products to keep their doors open. When food supplies become scarce and expensive, due to a combination of crop failures and rising energy prices, wealthy countries and individuals will have the survival advantage of being able to pay the higher price. The disadvantaged are not likely to accept starvation without putting up a fight, just as those living in low-lying coastal areas are not likely to quietly drown without resistance as sea levels rise. The resulting civil and international wars could destabilise even the strongest economies. In addition, pests and diseases of ourselves and our food sources are likely to migrate to areas where they do not currently exist, causing sickness and death in populations having no natural resistance to them. The global human population supportable by the coming climate will likely be far lower than it stands at present. War, pestilence and starvation will take care of that equation for us. The survivors may choose to follow an entirely new political paradigm for what passes for civilisation, but I would put my money on the emergence of fragmented populations held together by the equivalent of warlords. It will be of academic interest to see what role religion plays in the new world order. -
Ron King at 10:51 AM on 27 December 2012This is Global Warming - A Lesson for Monckton and Co.
dana 1981 The slope of your Fig 1 OHC graph reduces sharply around 2004 indicating a reduced imbalance. This coincides with the full deployment of the Argo floats and their use for OHC measurement. Before the wide coverage of Argo - ocean heat content measurement was sparse and very doubtful reliability. So the slope of the graph has decreased in the Argo period. So I don't understand what you mean by; "Estimates of the global energy imbalance may be changing, but that's not the same as the imbalance itself changing". Both the estimates of warming imbalance (Hansen and others) and the measurement have reduced since 2004-05 which seems inconsistent with an increasing radiative imbalance from steadily higher CO2 levels. -
villabolo at 07:48 AM on 27 December 2012Food Security: the first big hit from Climate Change will be to our pockets
Somewhat off topic but, on the issue of adaptation and the inevitable population collapse let me offer a possible solution. Our civilization simply cannot be reformed. It will collapse and turn into something resembling a feudalistic state. Or perhaps a network of communities like Arcosanti. Arcosanti is an experimental community under construction 70 miles north of Phoenix, Arizona. It is designed to be self reliant in food and economically. When finished, it will house approximately 5,000 residents. Of utmost importance, its food will be grown in greenhouses sheltered from the worse of weather. Basic infrastructure will all be within a ten minute walk from all residencies. This will minimize the need for long distance commuting. A global network of Arcosanties replacing our current urban/suburban/rural civilization would be sustainable into the indefinite future. -
Muzz at 07:40 AM on 27 December 2012Food Security: the first big hit from Climate Change will be to our pockets
John Mason's piece does remind me of what Hanrahan said: http://en.wikipedia.org/wiki/Said_Hanrahan -
JoeT at 06:53 AM on 27 December 2012Food Security: the first big hit from Climate Change will be to our pockets
Excellent post John, thank you for this. A question: the Tao & Zhang results (I haven't read their paper) are especially interesting. Do you know of any similar studies done for C3 plants? -
John Hartz at 06:23 AM on 27 December 2012West Antarctica warming more than expected
Here’s how Prof. Ricky Rood (University of Michigan) summarized the Bromwhcih et al paper which is the subject of the OP. Since this blog was first published, David Bromwich and colleagues published the paper, Central West Antarctica among the most rapidly warming regions on Earth, in Nature Geoscience. This paper is a complex study, which uses models to reconstruct and complete the temperature record in West Antarctica since the 1950s. They explain in detail their evaluation techniques and search for cause and effect of the regional warming that they find. Their ultimate conclusion is that West Antarctica is warming rapidly, especially in summer. They point to the summer of 2005, which saw significant surface ice melting, and warn that the temperature is getting to the point that melting might accelerate. This is especially significant in West Antarctica because the base of the ice sheets there are below sea level and especially vulnerable.”, Source: Things Going Fast, a Blog post by Dr. Ricky Rood, Weaterunderground.com, Dec 21, 2012 -
william5331 at 05:38 AM on 27 December 2012Food Security: the first big hit from Climate Change will be to our pockets
Perhaps Lovelock is correct. He predicted that some time this century the population of the earth would reach 1b. Even worse than climate zones shifting northward would be flickering. That is the climate shifting back and forth between the present regime and the new one. Farmers would have no idea what to plant each year. More catastrophic than the present, gradual 4km per year creep of the climate zones northward is if they lurch northward. This may occur if the Arctic ocean collects enough energy to reverse the polar Hadley cell. The polar jet stream which indicates where the Polar Hadley cell and the Ferrel cell meet looks suspiciously like a top that is slowing down just before it tips over and stops. ps. Here in New Zealand lots of rain interspersed with sunshine. Just harvesting a bumper crop of garlic. Raspberries going nanna brained and all the fruit trees on line for a great crop. http://mtkass.blogspot.co.nz/2012/11/greenland-melting.html -
Philippe Chantreau at 05:25 AM on 27 December 2012IPCC Draft Report Leaked, Shows Global Warming is NOT Due to the Sun
Pol8 "proved" and "intuitively" do not belong in the same sentence when talking about science. There is absolutely nothing new in what you presented. -
villabolo at 04:13 AM on 27 December 2012Food Security: the first big hit from Climate Change will be to our pockets
Here in southern California my 3 Sisters garden (corn, beans and squash interplanted as companion crops) did fairly well. We have a Mediterranean climate here and the weather is relatively stable. I might even be able to get two crops in the extended warm season. Water is piped in though. -
Terranova at 03:50 AM on 27 December 2012Arctic continues to break records in 2012: Becoming warmer, greener region with record losses of summer sea ice and late spring snow
@ John Russell #4 I was speaking merely from a biology/ecology perspective. But, since you brought it up, I do expect to see oil production in the not so distant future. I also think it can be done with minimal impact to wildlfe and will actually occupy a miniscule footprint. To draw an analogy from work I do with cellular tower construction companies -the demands of society will lead to development. It is our job as biologists to ensure that the construction of these towers does not impact (or we minimize to the fullest extent of the law) any Threatened or Endangered Species, Migratory Birds, etc... That leads to moving site locations, installing different lighting, etc... I am not naive enough to think there will be no impact from oil exploration/production, but it can certainly be reasonably managed. And, as far as shipping over the "top of the world" goes, I can't envision any significant or moderate environmental impact. In fact, if you look at the reduced distance travelled you would find that less fuel will be consumed and that should be a benefit. Yes, we've been in a reasonable steady state for the bulk of modern human history, but you know as well as I do that has not always been the case and flora/fauna and ecosystems have changed and spread and shrunk and appeared and disappeared. Survival of the fittest in action. And, yes, we do have a hand in that climate change, but one has to be a realist. Everyone on the planet needs to do their best at minimizing our impact to the environment, but any near-future moving away from FF is unlikely. Those cell towers I mentioned earlier? Don't even get me started on the much greater environmental impact that wind farms and solar farms have. There are certainly good applications for each, but for the most part the impact I have seen from them has been quite significant. Villabolo and Sphaerica: I did not mention agriculture and I do understand the limitations of different types of soil. I am not a geologist, but we do have to work closely with them when doing T&E surveys. But, it should be noted that the increased biomass in natural ecosystems on land and in the ocean will have a greater uptake of CO2 due to increased photosynthesis. -
VictorVenema at 01:48 AM on 27 December 2012West Antarctica warming more than expected
As Tom Curtis @2 already noticed, the legend: "On this map, the color intensity indicates the extent of warming around Antarctica." is wrong. The figure shows the correlations of the measurements at Byrd with reanalysis data as the text at the colorbar states. Anyway, I would interpret this study with care. There were changes in the instrumentation and location, which may cause non-climatic temperature changes. Especially in such a hostile environment. The supplemental information suggests that there were only corrections for calibration problems and drift and that they did not search for inhomogeneities in the data by comparison with neighbouring stations. This may also be difficult as the figure suggests, but does not show, that the station at Byrd does not correlate well with its neighbours. I do not have access to the paper itself, but I would expect that there are thus likely non-climatic changes in the time series. -
John Mason at 01:04 AM on 27 December 2012Food Security: the first big hit from Climate Change will be to our pockets
Good to see I'm not alone in my experiences of 2012. Some people I know simply gave up but I think it's well worth continuing to experiment to see what can take such a mix of conditions. At present, Swiss chard looks a good candidate, once you get the young plants past the most slug-vulnerable stage. Keep the comments coming in, growers! Bernard, you are of course right: history is littered with examples, the Year Without a Summer - 1816 . -
Bernard J. at 00:53 AM on 27 December 2012Food Security: the first big hit from Climate Change will be to our pockets
It would only take a couple of years of this sort of climatological mayhem to be repeated globally for the planet to plunge into serious trouble. Surprisingly few people seem to be aware of what is lurking just around the corner, and at this stage there's a rapidly diminishing range of responses available... -
BWTrainer at 00:46 AM on 27 December 2012Matt Ridley Risk Management Failure Deja Vu
"...although we would still have to take serious steps to prevent human greenhouse gas emissions from rising so much that even a low sensitivity scenario would result in extremely dangerous levels of global warming" I wish this article would've discussed this further (maybe another article?). The deniers conveniently ignore that we're on pace to possibly quadruple atmospheric CO2 levels in the next century, complicated by the potency of methane as we move more towards natural gas, so we're still screwed even with an unlikely low sensitivity. -
Bernard J. at 00:43 AM on 27 December 2012Matt Ridley Risk Management Failure Deja Vu
The only difficulty I can see is that you need to have taken flying lessons to really understand the significance.
A bit like the various sciences associated with climate change, in some ways... -
Bernard J. at 00:40 AM on 27 December 20122012 SkS Weekly Digest #51
William, the problem is that a large part of the inaction that has manifested has originated with the activity of deniers. If fora such as Skeptical Science did not work strenuously to rebut the denial campaign, all that will be left for the rest of us to do will be to "document the changing climate"... -
chris at 23:28 PM on 26 December 2012IPCC Draft Report Leaked, Shows Global Warming is NOT Due to the Sun
col8, taking your paragraphs one by one: 1. Not true. The IPCC has considered all of the scientific evidence on factors having potential to contribute to climate change/warming including all solar contributions that are under study in the scientific community. The significant number of papers published on real and potential GCR effects are all obviously considered in arriving at periodic IPCC assessments as inspection of the references cited in the IPCC reports shows. A major reason for rejecting the CRF effect as relevant for contemporary warming is that the CRF has trended in a slightly cooling direction as temperatures have risen markedly during the last 50 years. 2. You’ll need to provide some evidence for those assertions! There is very little evidence that the GCR component of the solar output is responsible for any apparent correlations between climate-related proxies and solar-related proxies. Since the solar effect of the CRF marches pretty much in lock-step with the other solar variabilities (solar irradiance, sunspot number, solar open flux etc.) any apparent correlation is just as likely to be due to the solar irradiance component of the solar variability. Obviously CRF variability cannot be relevant for contemporary warming since the CRF has trended in a slightly cooling direction as temperatures have risen markedly during the last 50 years 3. The cloud chamber experiments including the CERN CLOUD study have very little to say about the possibility for a GCR effect on Earth climate/surface temperature variability. The fact that high energy particles created in a particle accelerator can induce the condensation of potential nucleating species is not a particular surprising result, and doesn’t have very much at all to say about the possibility that CRF variations in the real world significantly affects cloud formation in a manner that is significant for long term and persistent changes in the climate/warming. 4. Dragic et al.’s data relates to apparent correlations between rare CRF spikes (Forbush Decreases or FD) and diurnal temperature range (DTR) in Europe. At least two groups have subsequently addressed Dragic’s interesting observation. Erlykin and Wolfendale cast some doubt on Dragic’s statistical analyses, but do find some evidence for a 13 day and/or 27 day lagged response of DTR to FD. These authors conclude that these weak correlations are more likely due to solar irradiance changes. There is also the problem that these lags (13 day) are really too long to be related to the putative CRF effect on cloud formation. Laken et al performed an analysis of 60 years worth of DTR and solar activity and found no evidence for the link purported by Dragic et al. Both groups show that some apparent correlation between solar activity (aka CRF but not necessarily so!) and DTR in subsets of data like that of Dragic et al. is likely to be found simply by chance. There are probably more than two dozen related analyses of the potential CRF climate/temperature link. The overall conclusion is that there is no decent evidence for supposing such a link is significant for climate/temperature variation in the real world. One needs to assess all of the scientific data and analyses (that’s what the IPCC do!) rather on relying on the occasional paper that conforms to a preferred view. And one should definitely look at the papers that cite your “preferred” paper, since if something is problematic, it will likely come to light subsequently. 5. But it can’t be significant since the warming of the last 50-odd years has occurred during a period when the CRF variation has been mildly in the cooling direction… 6. Looked at objectively, Svensmark’s “mechanism” has a pretty poor record in fact. etc ... -
CBDunkerson at 22:32 PM on 26 December 2012Models are unreliable
JackO'Fall, setting aside the scientific issues (which others have dealt with extensively) I find your economic argument bizarre on a few different levels. First, you argue that 'fixing a broken window does not improve the economy'. Let's take the situation on a grand scale... hurricanes break lots of windows. You argue that cannot possibly lead to economic improvement... yet reality shows that the reconstruction boom after major hurricanes has greatly benefited local economies time and time again. The same thing has been seen with wars. When the US entered WWII and built all those planes and ships the economy took off. Planes and ships obviously don't inherently improve the economy... indeed, many of them were built to replace others that had been blown up (more 'broken windows'). You argue that giving the people who built the planes and ships (or replaced the broken windows) money cannot possibly result in economic growth... and yet here in reality it has done so time and time again. It's all very well to subscribe to anti-Keynesian / freshwater / Chicago style economics, but you do still need to make an attempt at reconciling these beliefs with reality if you want to be taken seriously. The second big problem with your argument is that it seems to reverse the situation... global warming is the thing which is going to 'break a lot of windows'. Spending money now to prevent that would be the equivalent of putting up shutters to protect the windows. Basically, you're arguing against disaster prevention on the grounds that disasters are bad for the economy... which makes absolutely no sense. Finally, your idea that having money tied up in investments generates greater economic efficiency than having that money circulating through the economy is simplistic and wrong more often than not. Think about it. If 100% of the currency were in investments no one would be able to buy food, gas, housing, et cetera and the economy would collapse over night. If 0% of the currency were in investments then people would go on buying things and the economy would be fine... just with less money devoted to speculation. Between those two extremes the economy suffers proportionally as the percentage of investment goes up. This can be offset if the investment leads to new technologies which grow the economy, but given that the vast majority of investment these days is in financial flim-flammery rather than production of new technology it is really just a heavily rigged form of gambling and a further drain on economic efficiency.Moderator Response: [TD] Please take the economic discussion elsewhere. JackO'Fall already apologized for being off topic. -
littlerobbergirl at 22:20 PM on 26 December 2012Food Security: the first big hit from Climate Change will be to our pockets
Bad news here in se england too: late frost, then drought, heatwave,them months of relentless rain. Zero crop from sqashes, french beans, sweetcorn. Massive losses to slugs, even things like sage were attacked! All potatoes badly affected by blight, even the resistant sarpo varieties got it, where in previous years they got no more than the odd spot on leaves. Crop about half usual. Brassicas from late sowing seriously protected from slugs (for furst time ever i bought pellets) did well but now eaten by hungry pigeons that broke in past the nets. Local crops rubbish: beans stunted and rotting were mulched back on, wheat on the chalk other side of village looked great, on this side on clay pathetic. I dont like this new normal, i planted grapes, olives (dead now) etc expecting mediterranian weather, lulled by a few good years where only prob was drought! Last two winters wading through feet of snow, at moment mud. But it could be worse; russia and ukraine stuck under the high pressure have record cold, hundreds dead already. Having to pump out flooded septic tank small prob in comparison.. Happy new age, all! -
Dikran Marsupial at 21:46 PM on 26 December 2012Models are unreliable
JohnApplied Maths While weather is indeed chaortic, that does not mean that climate (long term statistical properties of the weather) is chaotic. It is straightforward to find examples of this, for instance consider a double pendulum made of iron placed near an electromagnet. We are unable to predict the exact trajectory of the pendulum, but we can predict the effects of the electromagnet, which will bias the mean position of the pendulum. Similarly, while we can't expect to predict the internal variability, we can predict the effects of the forcings (which correspond to the force applied by the electromagnet), and that is exactly what the modellers attempt to do. The thing about quasi-periodic behaviour is that in the long run, it averages out to zero, but the effect of the forcing do not, so there is good reason to think the GCMs will have skill over a timespan long enough for the quasi-periodic chaotic features suce as ENSO to average out. -
col8 at 21:39 PM on 26 December 2012IPCC Draft Report Leaked, Shows Global Warming is NOT Due to the Sun
With regard to whether or not there is significant “Svensmark” contribution to 20th century GW …… The IPCC, in repeated reports, consistently dismissed solar radiance as a factor … correctly …… but has, for 15 years, consistently ignored whether or not Sun varying magnetic field strength has modulated GCR input to Earth, & hence, low cloud cover/Earth temperature. CO2,CH4 (+ feedbacks) getting nearly all the cudos). Historically, the ‘Svensmark contribution‘ to CC has a lot going for it; ‘matching’ numerous (92%) CC events in the past millions of years, including more recent events such as the Ice Ages, the bronze age warming, Roman warming, MWP, LIA, the 35 year period of strong warming in the 1st half of the 20th century (just as strong as the warming in the last 35 years), the ~ 30 years of cooling - 1950-1978 ….. the Sun magnetic field strength again resuming it’s strong 20th century rise in 1978; a rise of > 100% over the last century (& the largest rise in at least the past 1,000 years) ….. but this rise petering out by the late 80’s ….. whilst Earth temperature has continued to increase ….. Thus, the Svensmark’s (partial) explanation of recent GW dismissed! Svensmark’s ‘cloud chamber experiments’ of 1997 & more recently, that showed a GCR connection to cloud formation were ‘poo-pooed’ …… CERN ‘proof’ being required. The long awaited (15 years) CERN #1 experiment eventually carried out last year & showed that GCR’s can indeed facilitate cloud nuclei formation ….. but in no way proving that the ‘Svensmark mechanism’ for CC is particularly relevant to large scale cloud formation/loss & significant effect on Earth temperature. A sigh of relief for the IPCC! However, far more conclusive evidence for Svensmark has come to light. Dragic, et al have taken a simple approach to proving/disproving Svensmark. They have analysed ‘diurnal temperature variation’ for 184 European weather stations over the last 50 years & compared this with 50 years of ‘muon counts’ (measured in Germany) during strong Solar flare events. We all recognise that on any given cloudy day, it’ll be cooler than a clear day, & similarly we all recognise that a cloudy night is warmer than a clear night. Guess what - for strong Solar flares a very strong correlation to Earth cloud cover (intuitively) proved! A few days after a strong Solar flare (lasting a couple of hours) Europe gets 0.38C hotter for a couple of days; after a very strong Solar flare, a couple of days later, Europe is 0.5C hotter for a couple of days. (the observed delay is the period for dissipation of existing clouds & reduced formation of replacement clouds) I have no idea what the correlation of a few hours of strong Solar flare activity producing a couple of days of significantly raised Earth temperature is ….. compared to decades of (100%) raised Sun magnetic field on diminished Earth cloud cover/raised Earth temperature – but i’d presume it to be also significant over most of the last century. Thus, I am reluctant to dismiss the Svensmark ‘mechanism’ for CC which has such a good historical record & is now proven to be an operative mechanism in cloud formation. Setting aside any contribution from CO2,CH4, are we perhaps missing something? We talk about GHG’s referring to (mainly) CO2 & CH4 & bringing in H2O (gas) as a climate forcing agent. Note that H2O as CLOUD is condensed water. CO2, CH4 have discrete absorption peaks which only account for a very small portion of Earth OLR absorption, whilst clouds REFLECT energy, this reflectance being a much, much larger factor in Earth energy balance as it operates over the FULL Earth OLR ….. Perhaps, even a small mechanism that affects cloud formation has a large ‘multiplier’ effect? Why have the World’s oceans, to a depth of 52 metres (at least), been in a cooling trend for two decades? And exhibited a huge thermal uptake & release of heat? – a cyclic temperature variation of 0.25C/11 years; this cycle in temperature far greater than any change in overall Earth temperature during this period & in accord with the Sun’s solar cycle. (SODA data) And why has there been considerably greater heating of just the northern hemisphere in the past couple of decades? & loss of Arctic ice whilst Antarctica has apparently being gaining 49Gt/annum recently, & overall, getting colder? The population & pollution in the northern hemisphere is far greater than in the southern hemisphere (whilst CO2 is the same everywhere). Could it be that settling pollution particles are turbidifying the surface water of the northern hemisphere oceans & thus trapping more Sun energy at the surface (AKA a farmer’s cloudy dam which looks inviting for a dip on a hot day – but is ‘brass monkeys’ when you break through the hot surface water), the top ½ metre or so of the ocean, this hotter water being in contact with the atmosphere & causing it to heat. With the turbid surface water trapping more energy, the Sun’s rays penetrate more weakly, explaining the temperature decline of the ocean over the last 20 years to a depth of 52 metres – roughly the depth of the penetrating power of the Sun’s rays ….. Just some thoughts for comment – whilst I continue to be a ‘fence sitter” -
JohnApplied Maths at 21:30 PM on 26 December 2012Models are unreliable
You boys completely miss the point The Earth's weather system is a chaotic dynamical system which is part of the Solar System which was proven to be a chaotic dynamical system by H.Poincare. A feature of any chaotic dynamical system is that even if it appears to exhibit quasi- periodicity its future behaviour cannot be predicted.Moderator Response: [TD] For additional information beyond Dikran's response, see the Skeptical Science Argument "Climate is chaotic and cannot be predicted." Please make further comments on that topic there, not here. Even if you wish to respond to Dikran's comment, do so there. He will see it anyway, because he like most regular readers monitor the Comments page that shows the union of all comment streams. -
John Russell at 21:04 PM on 26 December 2012Food Security: the first big hit from Climate Change will be to our pockets
I echo everything John says. Our crops have been right down this year; potatoes, beans, peas, courgettes, lettuce almost non-existent: if the wet didn't get 'em, the slugs did. And now we're looking like we'll be hit by Chalara Fraxinea (ash dieback) which is worrying me because I've probably got 30 acres of ash trees in total. The farmers round here in the SW UK (some in their 70s and 80s) tell me they've never known a summer like it in all their years. To cap it all they're now running out of silage for the cattle over the winter because they just weren't able to take enough cuts off the fields this year. And the bad news is that there's nothing to suggest it will be any different in 2013. This is the reality of climate change in the UK. Problem is, most townies -- insulated from the environment -- haven't realised it yet. This is a disaster. -
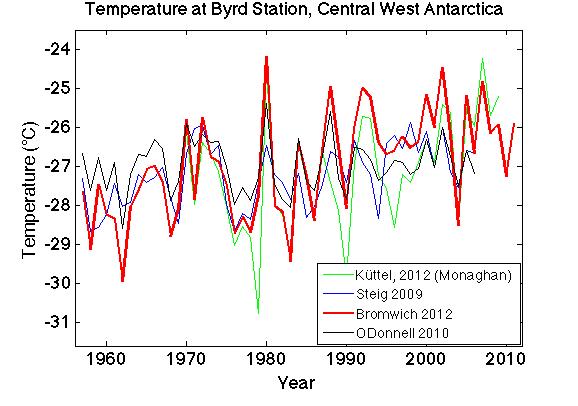
Tom Curtis at 12:13 PM on 26 December 2012West Antarctica warming more than expected
Philip Cohen @1, the map shows only correlation to Byrd Station temperature anomalies. It does not show temperature increases at all. Indeed, when Byrd Station temperatures are falling, bright red portions of the map will also, most probably, be falling as well. In that respect, the caption attached to the map is simply wrong, and contradicts the legend provided within it. William Connolley discusses the BBC's use of the map at Stoat. He also presents the far more useful in his (and my) opinion figure 2 from the paper, which actually shows the reconstructed Byrd Station temperatures: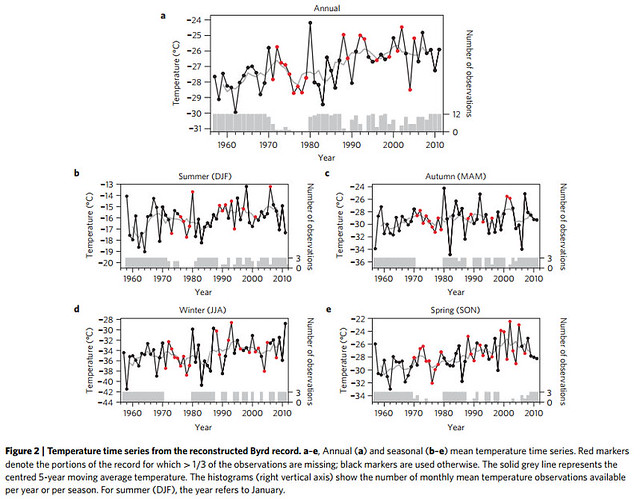 Also of interest, from Real Climate, is this comparison of this reconstruction of Byrd Station temperatures with prior reconstructions:
-
Treesong2 at 09:32 AM on 26 December 2012West Antarctica warming more than expected
Speaking as someone who knows nothing about the NCAR study besides what's here, and couldn't evaluate it even if he read the whole thing, I wonder if the much-processed instrumental record of a single site can bear the weight of the reinterpretation. How can West Antarctica warm so much more than East Antarctic coastal areas that are much further north? Is it elevation? I also don't understand the map. Does the color show temperature (per the caption) or temperature correlation (per the legend at right), and if the latter, what are the units? And why is the Antarctic Peninsula showing up with the dark blue of least warming/least correlation? -
Hans Petter Jacobsen at 09:00 AM on 26 December 2012Solar Cycle Model fails to predict the recent warming
SSH mention briefly that both total solar irradiance, ultraviolett light and cosmic rays change during a solar cycle. They do not highlight any of these processes in particular. The calculations within SSH's Solar Cycle Model are independent of which of these processes that is the strongest. The bottom line is that SSH's model cannot explain the global warming since the mid-1970s, regardless of the relativ strength between these processes. -
dana1981 at 08:44 AM on 26 December 2012This is Global Warming - A Lesson for Monckton and Co.
Ron @55 - NOAA only has pentadal data available for 2000m OHC, except since 2005, so that's all we had to use. The graph ends circa 2009 because that's the average of 2007 through 2011. DK12 were using just 0-700 meter data and focusing on short-term changes (a.k.a. noise) and calling every little bump a 'climate shift'. As you can see from Figure 1, the global energy imbalance (essentially the slope of the graph) isn't decreasing. Estimates of the global energy imbalance may be changing, but that's not the same as the imbalance itself changing. -
John Russell at 04:10 AM on 26 December 2012Matt Ridley Risk Management Failure Deja Vu
Bert #24 It is an excellent analogy. The only difficulty I can see is that you need to have taken flying lessons to really understand the significance. -
Tom Dayton at 00:07 AM on 26 December 2012It's cosmic rays
Update 2012: RealClimate posted "A review of cosmic rays and climate: a cluttered story of little success." -
Tom Dayton at 23:50 PM on 25 December 2012Sun and climate moving in opposite directions, says leaked IPCC report
RealClimate just posted "A review of cosmic rays and climate: a cluttered story of little success." -
Ron King at 23:25 PM on 25 December 2012This is Global Warming - A Lesson for Monckton and Co.
dana 1981 Looking at your paper cited above ref Fig 1, I was interested in why you and your co-authors used pentadal data and why it would make such a difference with DK12 data which you claim is focused on short term noise. note: "Our 0-700 meter result differs from that of DK12 over the 2002-2008 period because we use pentadal data whereas DK12 use quarterly data. This result highlights the fact that the DK12 conclusions are a result of their focus on short-term noise" Also why is there such a sharp rise in the 0-700m OHC in the 1998-2003 period which is not reflected in the 700-2000m OHC over the same period. Also why does this OHC graph stop in 2008 and not up to 2011 (the paper published in March 2012). Finally, the warming imbalance you confirm in the 0.4-0.6Wm-2 range agrees with Hansen's recent estimates but not with his 2005 model result of 0.85+/-0.15Wm-2, which should be increasing with growing CO2 levels since 2005. Why is the imbalance decreasing from the 2005 level? -
shoyemore at 23:04 PM on 25 December 2012Powerpoint friendly version of SkS Christmas cartoon
Paul D, Commiserations. Here in Ireland, we seem to have escaped the deluge you have experienced. The island of Ireland is (roughly) the size of England, but with a far smaller population density. So we (possibly) have more natural sinks & more empty floodplains for water to drain into the sea. I presume we get the same rainfall, in fact I thought Ireland got more on the average! However, after the egregious bulding boom, it is only a matter of time before we are caught again on the wrong side of nature. To John Cook & Co: Happy Christmas to the Skeptical Science team! -
milka at 22:05 PM on 25 December 2012Powerpoint friendly version of SkS Christmas cartoon
Hi John Wishing you, your family and Skeptical Science another successful year! Sandi Keane (and the Planet.....) -
Paul D at 21:20 PM on 25 December 2012Powerpoint friendly version of SkS Christmas cartoon
Actually JC, if you had put it up earlier, I could have printed it out and sent it as a Christmas card. -
shoyemore at 20:17 PM on 25 December 2012New research from last week 51/2012
chriskoz #1 I disagree. The report of the Presidential Council may be scientifically inaccurate by what we know today but in its own time it was cutting edge. It is certainly of enormous historical importance. Historians wondering why it was never followed up may blame the 1970s Oil Crisis, though that brought in the first wave of practical energy efficiency measures in industrial economies. Considering that President Carter made a determined effort to research alternatives to fossil fuels (efforts that were negated by the Reagan Administration from 1980), the 1970s look like an opportunity lost. -
chriskoz at 20:04 PM on 25 December 2012Powerpoint friendly version of SkS Christmas cartoon
Happy Christmas, John! Chris Koziarz.
Prev 1000 1001 1002 1003 1004 1005 1006 1007 1008 1009 1010 1011 1012 1013 1014 1015 Next


