


 Arguments


Recent Comments
Prev 1017 1018 1019 1020 1021 1022 1023 1024 1025 1026 1027 1028 1029 1030 1031 1032 Next
Comments 51201 to 51250:
-
tobyjoyce at 23:41 PM on 10 January 201316 ^ more years of global warming
Well done, lads. The "pauses" and "no warming for * years" brigade from been in full cry recently, no doubt hoping to disract from the extreme weather news from around the globe (UK 2nd wettest year ever, Sandy largest exra-tropical cyclone, USA warmest year ever, Australian heat records shattered, Arctic lowest ever ice extent, extreme cold records broken in China and Russia). -
cynicus at 22:35 PM on 10 January 201316 ^ more years of global warming
Very nicely done! I assume that the corrections for natural causes depend on indexes? Which indexes have been used and why that index? I have faith that the indexes and values are (largely) correct, but I'm just asking to have answers before the other side of the mirror does... -
CBDunkerson at 22:34 PM on 10 January 2013A Brief Note on the Latest Release of Draft IPCC Documents
Doug Hutcheson @14 wrote: "I imagine many products and services we take for granted in a high-fossil-carbon economy will become, at least, more expensive; at worst, unobtainable, when we turn off the pumps." I do not. Most of our current fossil fuel use comes from precisely two things... electricity generation and automobiles. We now have technology which can generate all of our electricity needs without any fossil fuels and cars that can run from rechargeable batteries. Ergo, we can 'turn off the pumps' just as soon as we build the infrastructure to convert to these new technologies. At that point the CO2 content of the atmosphere is decreasing and we can still use petroleum, coal, natural gas, et cetera for everything else we do currently... and have a lot more of those resources available for these other uses. More supply at fixed demand equals lower costs for other applications after we 'turn off the pumps'. Also: "I don't expect it to be business as usual, but have only a hazy idea of how Mr. and Mrs. Average would conduct their daily lives." I expect it to be business as usual... except that you'd park your car over an induction charger in the driveway each night rather than periodically going to something called a 'gas station'. Long term there'd also be vast health and economic benefits, but there are too many variables in how those would play out to predict changes on everyday life. -
John Brookes at 22:32 PM on 10 January 201316 ^ more years of global warming
When we have the next strong El Nino, the "skeptics" will be hiding. And that could be pretty soon. -
skywatcher at 20:43 PM on 10 January 201316 ^ more years of global warming
Really nice animation and description. These kinds of videos have real communication power to reach large audiences that may have neitehr the time nor the inclination to read the literature. Well done! Leo Hickman's article is pretty poor IMHO - far too much time devoted to known denial enablers, such as Tisdale or the Daily Fail. Throughout the piece, Hickman demonstrates precious little comprehension of the concept that the change in trend is statistically insignificant, while the long-term trend remains strongly statistically significant. The long-term trend is, in many cases, steeper when you include post-2000 data than it is when you leave it out. Does that sound like a "slowing down"? Remedial stats class required! Armed with this information, Hickman could actually critically evaluate whether the likes of Tisdale or the Mail had anything worthwhile to say, rather than uncritically repeating the nonsense. Leo, if you read this, please do some proper critical analysis before repeating everything you read on the Internet! A ray in the confusion of the article is the posting of this great video, however. -
Cornelius Breadbasket at 20:19 PM on 10 January 201316 ^ more years of global warming
dorlomin @ 28. Then tweet him a link. That is our job - Kevin has done his. -
dorlomin at 20:09 PM on 10 January 201316 ^ more years of global warming
Cheers for this, but even on the Guardian, Leo Hickman has been touting the 'no warming' meme. -
Cornelius Breadbasket at 19:51 PM on 10 January 201316 ^ more years of global warming
A long-term skeptic tea-break colleague that is. -
Cornelius Breadbasket at 19:49 PM on 10 January 201316 ^ more years of global warming
Strike one. A long-term tea-break colleague convinced. Please can we have more of these short pithy little no-nonsense videos on the other most persistent myths? -
Kevin C at 19:41 PM on 10 January 201316 ^ more years of global warming
Philippe: Thanks. But don't over-interpret the slight change in trend, it is not remotely statistically significant - it's noise. Depending on the assumptions you make the difference can go either way - I just showed the most parsimonious model using all the data. Indeed using a 2-box model on the whole 130 years and taking into account the CFC reductions after Copenhagen the temperature trend is projected to be very marginally less after the mid 90's. Copenhagen really made a difference. There are (a few) more details in the advanced rebuttal. -
Glenn Tamblyn at 18:45 PM on 10 January 201316 ^ more years of global warming
70rn Already done -
Rob Painting at 17:19 PM on 10 January 2013Observed Warming of the Ocean and Atmosphere is Incompatible with Natural Variation
Composer99 - It's actually the reduced thermal gradient through the cool-skin layer that causes the oceans to warm in response to elevated atmospheric CO2 concentrations. I'll amend the text to remove any ambiguity. -
70rn at 16:54 PM on 10 January 201316 ^ more years of global warming
This really needs to go on youtube - with a title like 'No Global warming for 16 years?' The problem with these websites is that they don't perhaps reach a large enough audience. Which ought to be everyone. -
gpwayne at 16:36 PM on 10 January 2013A Brief Note on the Latest Release of Draft IPCC Documents
It seems very unfortunate that we have to endure so much hypocrisy from climate change sceptics. Many of their attacks have been on the scientists rather than the science, which does not support their denial of the problem. In particular, the CRU emails focused on the probity and ethics of climate scientists. It appears that this is something of a one way street: demands for ethical behaviour are not accompanied by demonstrations of it. One rule for us, another for climate change deniers, apparently... -
Philippe Chantreau at 16:00 PM on 10 January 201316 ^ more years of global warming
I'll my voice to congratulate you on a brilliant piece of work. The animation is excellent. It's interesting that the recent 16 year "trend", once removed the ENSO/volcanic influences, is actually a smidge faster than the trend since 1980... -
Philip Shehan at 15:40 PM on 10 January 2013The Y-Axis of Evil
Apologies to moderators for my personal remarks about Boehm, I have tried to be polite in discussions with folks over at WUWT even when they are slightly snarky and even abusive, but Boehm is apparently permitted to tip buckets of manure over people in post after post, and I had had enough of being on the receiving end. Tom Curtis informs me that we are not permitted to discuss "ethical issues" here, and that is what I was really getting stuck into Boehm about. Tom Curtis: Thank you for your explanation. I am still a little confused. According to the Wood For Trees help section: Mean (Months) Running mean over the given number of months. Keeps the number of samples the same, but smooths them by taking the average of that number of months around each sample. Isolate (Months) Does the same running mean as 'mean', but then subtracts this from the raw data to leave the 'noise' I thought the functions you mention were performed by (quoting from WFT help again) Scale (Scale factor) Multiplies each sample by the given scale factor Offset (Offset amount) Adds the given offset to each sample (can be negative) Normalise - Scales and offsets all samples so they fall into the range 0..1 I posted the following to you over at WUWT but appear to be now banned. Do you have any comment? My suspicions were aroused by informal inspection of the graph (and presentation of another graph from the same source in which extraneous processing had been used which did nothing but introduce extraneous lines which flattened the temperature data obscuring the curve of the data which the graph was supposed to be showing did not exist) shows that the match of the data sets is ridiculously good. Given that temperature is affected by solar cycles, aerosols, volcanic eruptions, El Niño and la Nina events etc etc, how could there be such a near perfect correlation between temperature and CO2 content alone? Well we now know there isn’t. -
Composer99 at 14:35 PM on 10 January 201316 ^ more years of global warming
My congratulations as well to Kevin C and Daniel Bailey for their effort in putting this post and especially the video together. -
YubeDude at 14:21 PM on 10 January 201316 ^ more years of global warming
Hit the wrong button...please edit out the last 2 words and this post -
YubeDude at 14:20 PM on 10 January 201316 ^ more years of global warming
Is someone going to send a link to WUWT? Any chance we can get Climate Depot to review the video? Might have to rework my YT channel and make this video my homepage. Is it -
John Brookes at 13:37 PM on 10 January 201316 ^ more years of global warming
This is right up there with the escalator as a beautiful exposition. -
Alpinist at 13:09 PM on 10 January 201316 ^ more years of global warming
Very nice post! Good work Kevin and Daniel! -
Cornelius Breadbasket at 12:16 PM on 10 January 201316 ^ more years of global warming
Brilliant work. More please. -
Lotharsson at 12:11 PM on 10 January 201316 ^ more years of global warming
Not sure where to put this thought, but the left sidebar has a "Most used" climate myths list. What about having a "Trending" or "Currently hot" climate myths list for claims that are currently getting some media attention? -
littlerobbergirl at 12:03 PM on 10 January 2013A Brief Note on the Latest Release of Draft IPCC Documents
Lars @ 7; sorry for leading you into an ad feminem i couldnt resist such a juicy pun. On quote you give us; its also a non seccutur, embracing a 'greener, slower' etc way of life does not mean throwing out all tech at all! The rightest on hippies i know use solar, smartphones etc , even the amish use gm seed i believe. putting the two ideas in opposition is so not fair and so effective. -
Daniel Bailey at 11:46 AM on 10 January 201316 ^ more years of global warming
Thanks for the accolades and plaudits, everyone, but Kevin C is the real star here. Kevin did all the heavy lifting: concepting, storyboarding, scripting, programming and editing. Others contributed, but this is his moment. -
Doug Hutcheson at 11:35 AM on 10 January 201316 ^ more years of global warming
Animating the removal of forcings such as ENSO, solar and volcanic, is a brilliant way to get the message across. I will be keeping this post in mind, as I attempt to debunk contrarian nonsense in other venues. Thanks for the effort, Kevin and Daniel. I hope it gets translated, the same way the Debunking Handbook has been. -
LarryM at 11:27 AM on 10 January 201316 ^ more years of global warming
Kevin C - Thanks for this excellent teaching tool. One could speak a thousand words about the cooling effect of volcanic aerosols and the cyclical nature of ENSO being superimposed on AGW and it wouldn't sink in nearly as deeply as watching this 2-minute video. Nice work! Alexandre @11's comment caused me to go look at all the SkS climate graphics, and it is quite an impressive collection. Don't forget to add this one! -
Doug Hutcheson at 11:12 AM on 10 January 2013A Brief Note on the Latest Release of Draft IPCC Documents
Tom Curtis @ 15, I totally agree that Edenic civilisation would support far fewer people than are alive today. On the other hand, a 4°C-6°C warmer world would also support far fewer people, but in a hostile environment. I was not meaning to suggest that we have the opportunity to return to Eden; I was just expressing the view that the relatively few people who could be supported by a return to Eden at today's temperatures, would have an easy life compared with the lifestyles we could expect our (smaller) population to enjoy(?) in a world transformed by AGW. I see what you mean about non-biodegradable plastics being a form of carbon sequestration, but their manufacture would still require us to be pumping oil out of the ground: wouldn't that rather defeat the purpose? Making plastics from plant materials sounds like a good idea. The few times I have encountered this, it has been expressed as a proof-of-concept technology that has not yet reached commercial scale. This Scientific American article concludes:The research could become the basis of a process that turns biomass such as trees, cornstalks and algae into feedstock for chemicals, plastics and fuels at roughly 100 degrees Celsius (212 degrees Fahrenheit), which is a lot cooler than the 600 degrees C (1,112 degrees F) needed for oil refining or the high temperatures (as well as pressure) such oil must undergo when it is formed naturally. "A number of steps, including process development and optimization, have to take place before full-scale commercialization," Zhang notes. "It may take several years to reach that stage."
If the hurdles can be overcome and production can be ramped up to industrial scale, to keep the cost reasonable for the production of consumer goods, we will only have the problem of growing biomass quickly enough to feed the beast. At the scale required to feed our addiction to gadgets, plants-to-plastic might have a measurable effect on atmospheric CO2. Ditto plants-to-biofuels. I must admit to being somewhat sceptical that we could produce enough bio-plastic and bio-fuel to give our civilisation a seamless transition away from sucking oil out of the ground. Any way I look at it, I am led to the conclusion that a society free from fossil carbon fuels will consist of fewer members than the 10 billion expected around the middle of the century. Am I being unduly pessimistic? -
Tom Curtis at 10:15 AM on 10 January 2013A Brief Note on the Latest Release of Draft IPCC Documents
Doug Hutcheson @14, 1) Edenic agriculture would not be able to sustain even a quarter of the World's current population. However desirable (and I do not think it is) a retreat to eden is simply not a viable policy alternative. But as LaFramoise knows, suggestions that it is what her opposition desires sure makes a handy substitute for thought. Demonize your opposition and your accolytes will swallow any rubbish in justification. 2) Non-biodegradable plastics are an effective means of carbon sequestration, so will still by viable in a low carbon economy (though we may want substitutes for other reasons). Further, at need, plastics can be made from plant material, a process that will actually reduce atmospheric CO2 by small amounts. -
Doug Hutcheson at 09:54 AM on 10 January 2013A Brief Note on the Latest Release of Draft IPCC Documents
Lars Karlsson @ 7, you quote from the book:Apparently the answer is a return to Eden – to a slower, greener, more, ‘natural’ pace of life that embraces traditional values rather than mindless consumerism
To me, a return to Eden, a slower, greener way of life and no rampant consumerism sounds a great deal more attractive than the 4°C warmer world denialism is heading us to. CBDunkerson @ 8, I see challenges to our ability to build and deploy high technology, in a low-fossil-carbon future. The computer I am typing this message on consists of plastics and related materials that come from oil, as well as numerous metals that are already expensive to produce and distribute using machinery powered by fossil fuels. I imagine many products and services we take for granted in a high-fossil-carbon economy will become, at least, more expensive; at worst, unobtainable, when we turn off the pumps. The IPCC documents shine the light on where we are headed, in terms of temperatures and effects upon the biosphere, but do not map out the kind of society we can expect to develop under such environmental pressures. I have read that a 4°C increase in average surface temperatures is not compatible with organised global society, but have not found much discussion of the kind of society with which such a warmer world would be compatible. I have also not read much that discusses the changes and compromises we should expect, if we choose to move rapidly away from fossil fuels. I don't expect it to be business as usual, but have only a hazy idea of how Mr. and Mrs. Average would conduct their daily lives. -
Tom Curtis at 09:38 AM on 10 January 2013The Y-Axis of Evil
With reference to Philip Shehan's comment, this is the image used by Boehm to argue that temperature increases are responsible for the increase in CO2. The essential function used is the isolate function, which removes the trend and resets the mean of the series to zero. This has been illustrated here, with the "isolated" data offset for ease of comparison. As such, Boehme has joined a long list of deniers who have "proved" that temperature increases cause the rising trend of CO2 concentration by first removing that trend from the analysis. Shehan thinks such arguments raise serious ethical concerns, but that is not a permitted topic of conversation on SkS. I will note that Boehme rescales the CO2 data by a factor of 0.25. That means, even if we accept his premise, each degree rise in temperature will only cause a 4 ppmv increase in CO2. With temperatures rising by approximately 1 degree C since the pre-industrial revolution, that means at best he has shown that 4 ppmv of the 110 ppmv increase in CO2 is due to increased temperatures. Yet again we have a denier thinking only sufficiently to give himself a convenient sound bite, and not carrying the analysis through to see its full implications. That is, of course, because people who do carry the analysis through cease to be deniers (if they ever were). -
Philip Shehan at 09:05 AM on 10 January 2013The Y-Axis of Evil
A comment I have just posted on the WUWT thread for which the link is provided at comment 38 I refer to his post of January 9, 2013 at 11:37 am I recognise that this comment is decidedly "ad hominem' in the sense of being highly critical of Boehm personally as opposed to his adeas but I beleive the remarks are entirely justified being an reasonable description of his conduct and in the interest of exposing Boem's conduct I request it be posted. D Boehm Stealy [snip] I have previously drawn attention to your manipulation of Wood for trees data sets to flatten the appearance of the temperature data sets. Your conduct [snip] . Your chart in your post purports to be a plot of Muona Loa CO2 output and Hadcrut3 temperature data. It is nothing of the sort. As the WTF website states your use of the Isolate function means that you are plotting the noise after subtraction of the data, not the data itself. [snip]Moderator Response: TC: Ad hominens snipped. -
Tom Curtis at 09:04 AM on 10 January 2013Temperatures Continue Up the Escalator
Klapper @38, a person who is not a "simpleton thinker" does not stop their analysis when they have a convenient sound bite in support of their position. Thus, when they notice, for example, that the switch from generally negative ENSO conditions in the late sixties and early seventies to generally positive ENSO conditions may have contributed to the positive trend over that period (it did), they not only note that fact but find somebody who has quantified the effect; or if they have the skills, quantify it themselves. Doing so, they would find Lean and Rind 2012 and see that the ENSO contribution was minimal compared to the anthropogenic contribution to the rise in temperatures after 1975: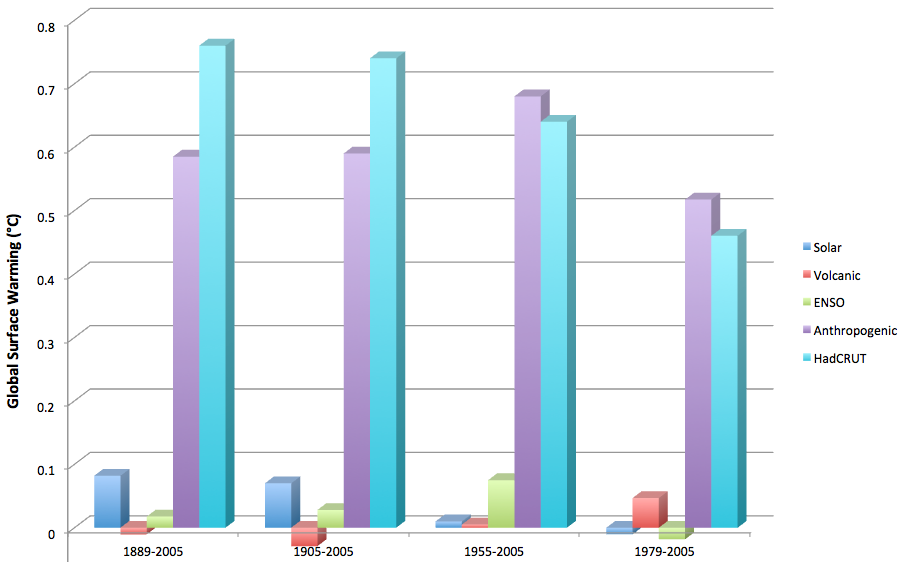 (Note in particular the 1955-2005 contributions.)
The problem is that while ENSO's contribution to global temperatures is large relative to the change in temperature due to AGW over short periods (say 16 years) it is small relative to the contribution over extended periods.
(Note in particular the 1955-2005 contributions.)
The problem is that while ENSO's contribution to global temperatures is large relative to the change in temperature due to AGW over short periods (say 16 years) it is small relative to the contribution over extended periods.
-
Alexandre at 08:39 AM on 10 January 201316 ^ more years of global warming
Heeeey... you guys are getting better and better. -
perseus at 07:47 AM on 10 January 201316 ^ more years of global warming
Great work everyone, and well timed! -
Bob Loblaw at 07:44 AM on 10 January 2013Water vapor is the most powerful greenhouse gas
Yes, KR's explanation is better. I was looking at the text in the rebuttal where it said "carbon dioxide contributes 32 W/m2 (Kiehl 1997). These proportions are confirmed by measurements of infrared radiation returning to the Earth's surface (Evans 2006).", and got messed up by the "earth's surface" part. Of course, with no atmosphere at all, there isn't any IR towards the earth's surface, but that still doesn't apply to an atmosphere with no CO2... which would have downward-direct IR at the surface. I was hasty, and messed up. The point that you need to be careful about surface vs. TOA fluxes is valid, but I'm not explaining the actual numbers that were asked about. -
dana1981 at 07:39 AM on 10 January 201316 ^ more years of global warming
By the way, there's a myth pervading the media that this year's Met Office global surface temperature prediction shows that global warming has 'stalled'. We'll have a post with a specific rebuttal to those articles tomorrow, which makes use of Kevin's video. -
Tom Curtis at 07:36 AM on 10 January 201316 ^ more years of global warming
Few presentations cut through the obfustication, contradictions and worse that constitute denier talking points as succinctly and clearly as this. Well done Kevin C; and well done also to Daniel Bailey for his excellent voice over. The sheer quality of this presentation will spark, I have no doubt, another round of conspiracy theories as the deniers refuse to admit that this work was done entirely by volunteers determined to cut through their bullshit to allow people to see the truth of global warming. -
Anne-Marie Blackburn at 07:36 AM on 10 January 201316 ^ more years of global warming
Brilliant work, Kevin. Good contribution, Daniel ;) Take a bow. -
Albatross at 07:36 AM on 10 January 201316 ^ more years of global warming
Superb. That the "skeptics" and those in denial have to keep pushing this particular meme speaks to their desperation. The sad part is that unless the media and public are educated/informed about such nuanced issues the "skeptics" will be able to keep trying to push this meme. Even as we speak Monckton and his enablers are scheming as how to cherry pick those time windows of time that produce statistically insignificant temperature trends. Unbelievable but true. So, hopefully this video can be used by the media to educate and inform the public. That way, people will turn a blind eye to ridiculous "skeptic" antics and efforts to obfuscate and the informed public will also be in a position to expose the disingenuous games of fake skeptics whenever they try and push it again. I sincerely hope that this video goes viral. -
Brian Purdue at 07:32 AM on 10 January 201316 ^ more years of global warming
Wow! What a video and post! This will have the pseudoskeptics boiling, but will educate the public on what the real “16 years” facts are. -
Rob Honeycutt at 07:30 AM on 10 January 201316 ^ more years of global warming
You have a great speaking voice, Daniel. -
Rob Honeycutt at 07:29 AM on 10 January 201316 ^ more years of global warming
That rocks!! -
Tom Curtis at 07:29 AM on 10 January 2013Water vapor is the most powerful greenhouse gas
Bob Loblaw @132, the 32 W/m^2 is the CO2 contribution to the net difference between surface upward longwave radiation and top-of-atmosphere upward longwave radiation, and hence its contribution to the total greenhouse effect as measured at the TOA. As such, KR's account of the situation is accurate. I initially skimmed your post and did not pick up that your account differed from that of KR and myself. As previously noted, the estimate of Kiehl and Trenberth (1997)given in the intermediate article has since been superceded by the estimate given by Schmidt et al, (2010). -
Composer99 at 07:27 AM on 10 January 2013Observed Warming of the Ocean and Atmosphere is Incompatible with Natural Variation
From the OP:So how do greenhouse gases accomplish this ocean heating? This is discussed in this SkS post, but briefly; greenhouse gases radiate heat (longwave radiation) back toward the surface and, although they cannot penetrate into the ocean itself, they warm the uppermost surface of the thin cool-skin layer. The thermal gradient in this [the cool-skin] layer dictates the rate of heat loss from the (typically) warmer ocean surface, to the cooler atmosphere above. When greenhouse gases increase, more longwave radiation is directed back at the ocean surface, which warms the cool-skin layer, lowers the thermal gradient, and consequently reduces the rate of heat loss. The sum effect is that the oceans trap more of the sun's energy and therefore warm over time. [Emphasis mine.]
Correct me if I am wrong: the thermal gradient in question is the gradient between the cool-skin layer and the ocean layers beneath it, correct? Could the paragraph cited be amended slightly to include this added precision? Personally speaking I feel the passage is ambiguous with regards to which thermal gradient is being reduced (especially since a warmer cool-skin ocean layer would have, as far as I am aware, a stronger thermal gradient with the atmosphere). -
Daniel Bailey at 07:19 AM on 10 January 201316 ^ more years of global warming
Nice job, Kevin! -
dana1981 at 07:18 AM on 10 January 201316 ^ more years of global warming
Super cool video guys, great job. Hopefully it gets spread far and wide to a large audience! -
Tom Curtis at 07:13 AM on 10 January 2013Water vapor is the most powerful greenhouse gas
AlanSE @132, as noted by Bob and KR, the 32 W/m^2 is the total strength of the greehouse effect from CO2, whereas the 8 W/m^2 is the change in the total strength of the greenhouse effect as atmospheric concentration increases from 278 to 1000 ppmv. I notice in reading the graph from Science of Doom, you use the highest estimate of radiative forcing (IPCC 1990). Subsequent to the publication of the IPCC first and second reports, Myrhe showed that models where then overestimating the forcing from doubling of CO2. The correct value is 6.85 +/- 0.68 W/m^2 for an increase in CO2 from preindustrial levels to 1000 ppmv. Further, since the intermediate article above was last updated, Schmidt et al, (2010) (PDF) have come up with a more accurate estimate of the all sky CO2 contribution to the GHE of 29.5 W/m^2 for 1980 concentrations. That will have increased by 0.8 W/m^2 since then, to 30.3 W/m^2. A further increase of CO2 concentration to 1000 ppmv will increase the CO2 contribution by 5.0 W/m^2 relative to 2010 levels, taking the total CO2 contribution up to 35.3 W/m^2. It should be noted that most of the non-CO2 contribution to the total greenhouse effect comes from water and clouds, which would largely disappear from the atmosphere given a lack of CO2, and hence constitute a feedback rather than a forcing. I should also add that while the formula given by KR above is accurate for calculating change in forcing for levels of CO2 found in the atmosphere over the last 600 million years, but becomes inaccurate for very low levels of CO2 and so cannot be used to calculate the total contribution. -
Water vapor is the most powerful greenhouse gas
AlanSE - The 32 W/m^2 value is for the difference between no CO2 at all and current values. 8 W/m^2 is for two doublings of CO2, with a logarithmic effect, estimated at: ΔForcing = 5.35 W/m^2 (ln [CO2_new/CO2_previous]) or ~3.7 W/m^2 per doubling of CO2. So these are indeed two different numbers for two different situations. The ΔF of 0ppm -> 390ppm does not equal the ΔF of 250pp -> 1000ppm, in particular since at low concentrations of a greenhouse gas (near zero) it will have a linear rather than logarithmic effect.Moderator Response: [DB] Fixed link. -
Bob Loblaw at 05:59 AM on 10 January 2013Water vapor is the most powerful greenhouse gas
AlanSE: Took a bit to find the 32 W/m^2 - it in the intermediate version of the rebuttal, which disappears when you go to the third page of comments. ...but to answer the final question you have: yes, they are different things. The 32 W/m^2 value refers to what is coming back down to the surface from the atmosphere. The other numbers (8 W/m^2 for 1000ppm CO2 - you'll also see other references that mention about 4 W/m^2 for doubled CO2, i.e. 600ppm) refer to the change in flux at the top of the atmosphere (i.e. the exchange with space). It is this latter value that creates the imbalance that leads to global warming - reduced losses to space require a warmer system to restore balance with absorbed solar. The failure to distinguish between surface fluxes and top-of-atmosphere fluxes is a common error.
Prev 1017 1018 1019 1020 1021 1022 1023 1024 1025 1026 1027 1028 1029 1030 1031 1032 Next


