


 Arguments


Recent Comments
Prev 1087 1088 1089 1090 1091 1092 1093 1094 1095 1096 1097 1098 1099 1100 1101 1102 Next
Comments 54701 to 54750:
-
JoeT at 02:30 AM on 1 September 2012Will the Wet Get Wetter and the Dry Drier?
Rob Painting, As I wrote above, the results presented by GFDL differ in several ways from the very recent paper by Dai that can be found here. Would you know what assumptions go into the models that account for the differences. The Sahel region of Africa stands out in particular as one where the predictions diverge radically. Thanks. -
heijdensejan at 22:52 PM on 31 August 2012Arctic Sea Ice Extent: We're gonna need a bigger graph
Most worrying is the fact that PIOMAS is following the exponential decline https://sites.google.com/site/arctischepinguin/home/piomas. Result ice free in 2015. Next year will be interesting -
Daniel Bailey at 22:35 PM on 31 August 2012Why Arctic sea ice shouldn't leave anyone cold
A commenter over at Neven's ASI blog has offered up a very applicable & cogent argument. If if Arctic melts were as pronounced as Christy says relative to today then a graphical overlay of the two periods should be instructive. And that is just what deconstruct did. 1938 vs 2012 To highlight that difference, deconstruct also overlaid 1946 (representative of the colder mid-40s) with 2012:
 So that begs the question, which was the most comparable melt: 1938 to 2012...or 1938 to 1946?
Enquiring minds want to know.
So that begs the question, which was the most comparable melt: 1938 to 2012...or 1938 to 1946?
Enquiring minds want to know.
-
Rob Painting at 21:39 PM on 31 August 2012CO2 lags temperature
David Sanger - some recommended reading: 1. Interannual extremes in the rate of rise of atmospheric carbon dioxide since 1980 - Keeling 1995 2. The Carbon Cycle Response to ENSO: A Coupled Climate–Carbon Cycle Model Study - Jones (2001) -
L. Hamilton at 21:16 PM on 31 August 2012Arctic Sea Ice Extent: We're gonna need a bigger graph
I've been drawing simple bar graphs that track the minimum ice extent, area or volume for each year to date. With the PIOMAS August update (through 8/25) the results are striking: [LINK]Moderator Response: [DB] hot-linked URL. [RH] shortened link that was breaking page formatting. -
Rob Painting at 20:43 PM on 31 August 2012CO2 lags temperature
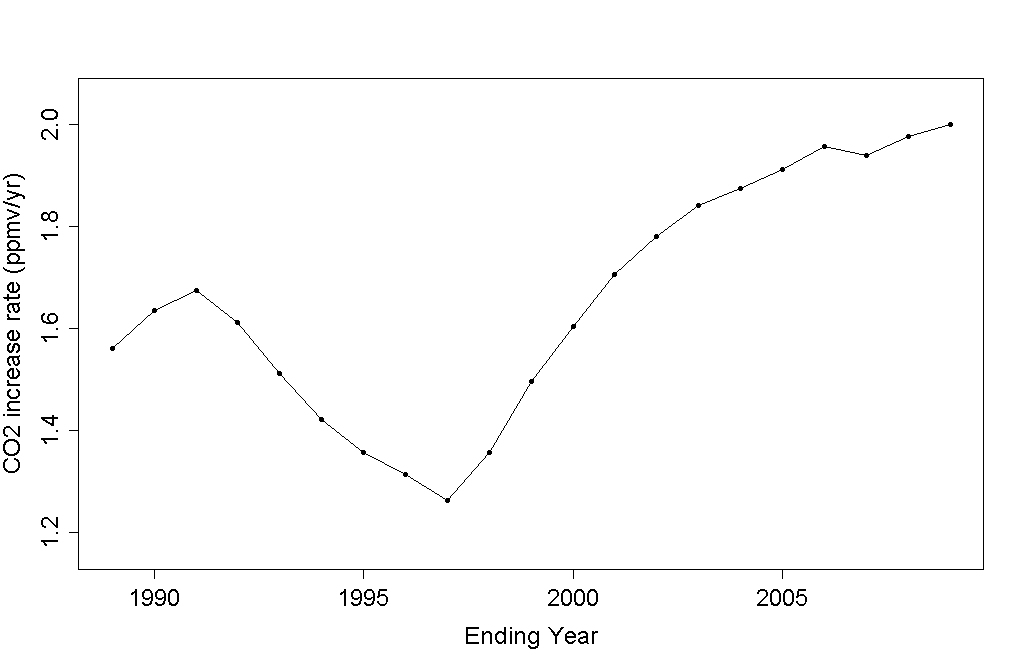
David Sanger - this is much easier if you understand that the oceans are Earth's main heat reservoir. Arguably the greatest climatic effect greenhouse gases exert is that they trap more heat in the ocean. During La Nina the oceans accumulate more energy - as heat is buried in the sub-surface ocean, and during El Nino this heat wells to the surface and is smeared across the central and eastern equatorial Pacific. Due to these characteristics, and the surface air-sea exchange of heat, the Earth is cooler-than-average during La Nina, and warmer-than-average during El Nino. But there's more to the story, there are two large competing effects on carbon exchange during ENSO. In a La Nina phase upwelling of acidified deep water along the western coast of North & South America out-gasses CO2 to the atmosphere. But this is more than compensated by the wetter-than-average rainfall which falls over the continents and particularly the tropical river basins of the world. More rainfall over such a vast land area generally means more plant growth and a draw down of atmospheric CO2. During El Nino the much of the continental land surfaces are drier-than-average. This is because the upwelled heat on the Pacific equatorial ocean surface draws moisture away from the continents, and rainfall is focused over the ocean. CO2 out-gassing may shut off, but again this is more than compensated for by land vegetation. As drought sets in on the continents, vegetation dies and CO2 is released back to the atmosphere. Warming air temperatures also elevate respiration which, again, releases more CO2 back to the atmosphere. These natural short-term CO2 fluxes dwarf human fossil fuels emissions, but unlike fossil fuel pollution they do not increase incrementally year after year. It is, of course, more complicated than that. For example the distribution of rainfall is vitally important, but that is the general picture. Armed with that knowledge you can now under see that Humlum & co aren't telling us something we don't already know. They just lack understanding of the physical mechanisms which drive this and, allied to ideological bias, therefore come to conclusions unsupported by the evidence. As for large volcanic eruptions - they can reduce atmospheric CO2 because they stimulate enhanced plant growth on a global scale. This is accomplished by the volcanic aerosols high in the stratosphere increasing light-scattering which more readily penetrates the leaf canopy. In the absence of other limiting factors, more sunlight equals more growth and hence draw down of atmospheric CO2. You can see this in the graph you presented - after the Mt Pinatubo eruption (1991) even the El Nino of 1991-92 saw a decline in atmospheric CO2 - the opposite of the normal response. -
shoyemore at 20:05 PM on 31 August 2012Arctic Sea Ice Extent: We're gonna need a bigger graph
I keep a daily chart on the ice extent from IARC-JAXA. Like everyone else I had to make space at the bottom this year for the new melt. Deep Climate is projecting 3.56m km^2 for minimum. Deep Climate Projection One striking this is how long the melt season is becoming - from a V-shape to a U-shape in the chart. Means the re-freezing will be almost as interesting as the melting. -
davidsanger at 18:57 PM on 31 August 2012CO2 lags temperature
scaddenp @378 Thanks for the link. That explain a lot about the context. I should have thought to search the site first for "Humlum" KR @381 So if I understand the graph then he's just showing that (sometimes) if the measured CO2 increases a bit more quickly year over year, then the temperatures increase a bit more compared to the previous year, and if the CO2 increase from year to year is a bit more modest the temperature increase is a bit less (or could actually be a decrease since the y-axes have different zero-lines). Whatever is causing the variability from year to year (even noise?) could then affect both measures in a similar manner. And none of this has anything to do with why either measure is trending upwards. Is that close? skywatcher @379 so would effects of ENSO and volcanic activity account for the seeming lag in the graphs where temperature differentials from the previous year appear to increase or decrease 12 months or so before measured CO2 differentials from the previous year? -
chriskoz at 17:14 PM on 31 August 2012Realistically What Might the Future Climate Look Like?
I agree with Tom's commentary on Dale's opinion. Further, I want to point that Dale's "BS" acronym can be taken as inappropriate, inflammatory term that he should also apologise for. As Dale admits in his closing comment @40, his opinion (or more precisely his way of opining) is indeed inappropriate, not only for this site but for any decent site. If Dale adheres to his closing comment do do not opine on this site anymore, I will not be missing him. -
Bernard J. at 16:30 PM on 31 August 2012Matt Ridley - Wired for Lukewarm Catastrophe
Bernard J. @46. I'm sorry, but without the supporting data all you have done is draw a pretty picture that you are asking us to take on faith. I have a math degree, so I don't think I will swoon if post [sic] the supporting data.
A degree in mathematics?! As others have noted, your naïve treatment of the CO2 data is very much at odds with that claim. However, if it is true, you shouldn't need to see my supporting data. You should be able to see that I performed an analysis that fits the entire Mauna Loa record, and with a bit of application of that claimed degree in mathematics, very soon have a close replication of the graph. I'm extremely curious to see if you are able to replicate the graph, because Tim Curtin with his self-styled skill in statistics never managed what is in the end really a simple procedure. If this turns out to be beyond the skills of someone with a mathematical degree, I might provide a step-by-step description of the process in a few more days, but I really would like to see that you've attempted to arrive at a fit rather more sophisticated than a linear or an exponential fit - for goodness' sake, your own graph and Tamino's explanation should tell you that an exponential fit is rather off base, even with a regression coefficient of 0.98. -
Dale at 16:13 PM on 31 August 2012Realistically What Might the Future Climate Look Like?
Tom: I've already given my opinion, but it was deemed not appropriate for this site. I will not be giving it again. Thanks -
Tom Curtis at 14:54 PM on 31 August 2012Arctic Sea Ice Extent: We're gonna need a bigger graph
Reflecting the title, the NSIDC Sea Ice Index is already at the bottom of the graph above and still heading south. At the next update, the graph will have run out of room. -
CO2 lags temperature
David Sanger - and other readers: The simple lesson from this particular paper is this: If someone de-trends the data, as Humlum did in that graph, they are no longer examining the trends, and therefore cannot conclude anything about them. This is actually a fairly common mistake - any number of papers have filtered out the trends, and then attempted to state conclusions about the very data they have excluded from analysis. Very sad...Moderator Response: [DB] Revised text per request. -
Tom Curtis at 14:41 PM on 31 August 2012CO2 lags temperature
David Sanger @377, the three authors of the paper are all well known climate change deniers, ie, part of the 1% of climate change scientists who do not agree with the consensus. It is possible that "skeptical" sites are over stating the claims made in the paper, but unlikely they are outright misrepresenting them. Without having read the paper, however, all I can say is that such claims have been made repeatedly before - and always the evidence and reasoning in support of the claims has been dubious at best. In the case of one particular claim, ie, that anthropogenic CO2 has not significantly contributed to increased CO2 levels, the evidence against the claim is so firm that we should greet any paper purporting to prove otherwise with the same astonishment we would greet a paper purporting to re-establish the Ptolemaic (terra-centric)model of the solar system. -
skywatcher at 14:38 PM on 31 August 2012CO2 lags temperature
David, all that graphic shows is that detrended air temperature, which is mostly ENSO and occasional volcanic influences, is related to detrended CO2 with the annual cycle removed too. So there is a relationship betweent he variability of both graphs, no surprise there. It says absolutely nothing about what is causing the overall rise in either one, though clearly the skeptics would want you to believe that ocean temperature rise is causing CO2 rise. They ignore many things: 1: what is causing ocean temperature to rise? 2: why is ocean pH decreasing, if CO2 is being released from the oceans (which should cause pH to rise)? 3: Where is all our CO2 going? We release ~30GT per year, yet annual CO2 rise is only half that. [the truth is that it is going into the oceans, acidifying them.] 4: As linked above, the chemical signature of the CO2 is that from FF-derived carbon, shown by several independent lines of evidence. So lots of suspension of disbelief required before you can accept the Humlum paper. In fact, I suspect I'll find the suspension of disbelief when watching The Hobbit later this year a whole lot easier!Moderator Response: TC: Humlum et al, 2012 discusses a number of topics, only one of which is on topic on this thread. Could detailed discussion of the anthropogenic origin of CO2 be moved to the previously suggested thread; and discussion of the ocean as the source of global warming be moved to "Why ocean heat can’t drive climate change, only chase it" Thank you. -
Tom Curtis at 14:33 PM on 31 August 2012Realistically What Might the Future Climate Look Like?
Dale @35, the article on obesity and global warming, or at least the so called "skeptic" commentary on it, is exactly why I cannot take global warming skepticism seriously as an intellectual position. The article reports on a study by two medical doctors published in the Lancet which concludes that, all else being equal, obese people have a larger carbon footprint than non-obese people. You want to purport that this sort of claim is, "the type of BS that is making people scoff". It is very far from evident, however, that the claim that obese people have a larger carbon footprint is BS of any sort. Indeed, the proposition is inherently plausible, although I doubt that loosing weight would be the most cost effective way for most westerners to reduce their carbon footprint. (On the other hand, it is a low cost method of doing so with substantial secondary benefits.) Of course, claiming that it is absurd to believe that obesity increases carbon footprints is a hard sell. So you misrepresent the article as claiming that obesity causes global warming. That of course, would be absurd, but it is not anything like what the author of the news article or the original study claim. Indeed, the word "cause" does not even appear in the article. The closest the article comes to saying anything like that is when it says:"Obese and overweight people require more fuel to transport them and the food they eat, and a literally swelling global population will make this source of greenhouse emissions worse, say UK researchers."
That is, obese people generate more CO2 emissions than equivalent non-obese people, and this source of additional emissions will increase with increases in obesity. At this point, if you have any intellectual integrity, you will apologize for providing such a misleading example; and you will be asking some hard questions of the AGW deniers that steered you wrong on this article. You will also be applying much more skepticism to those deniers. I doubt any of the above will happen, of course. Why would I expect anything like it from somebody who thinks Anthony (AHI*) Watts is as informative as SkS. (*Antarctic Heat Island) -
chriskoz at 14:32 PM on 31 August 2012Realistically What Might the Future Climate Look Like?
Sphaerica @8, Your latest ostrich defence reminds me past arguments by the "skeptics" that "warmists" are trying to "return us to the caves" and that "warmists" also deny the "skeptics" a voice is this "debate". Now we have an example of delialists trying to both deny climate scientist their voice (by suggesting they renounce their internet access) and return us to the caves (by dumping the non carbon-neutral technology rather than changing its underlying power infrastructure). Can you imagine a better comedy of self-contradicting nonsense? I don't know if I have to LOL or simply cry over the fact how low a human stupidity can descend... -
scaddenp at 14:24 PM on 31 August 2012CO2 lags temperature
This seems very similar to earlier effort with same message and also published at GPC. It is discussed at Realclimate here. -
davidsanger at 14:16 PM on 31 August 2012CO2 lags temperature
Thanks. I'm quite newly involved in climate issues and when I see a reference like this posted in a skeptic site always want to read the original paper (and any discussion here) to see if it really says what they say it does. Often a quote is pulled out of context where the authors meant something quite different indeed. When a paper is hidden behind a pay wall it is difficult and frustrating since there is no way to evaluate it. If this is really suspect then how can a paper like this be accepted in a journal? Here's a graph from the study (similar to ones I've seen on skeptic sites: It seems to be tracking changes in sea and air temperature and "global CO2". Is there some other process that would present the same seeming correlation and timing but which the authors are missing?
As a non-expert it is difficult to counter message like on Watts today without understanding what is going on. Thanks
It seems to be tracking changes in sea and air temperature and "global CO2". Is there some other process that would present the same seeming correlation and timing but which the authors are missing?
As a non-expert it is difficult to counter message like on Watts today without understanding what is going on. Thanks
-
Tom Curtis at 14:13 PM on 31 August 2012CO2 lags temperature
David Sanger @373, I have not read the paper which, as you say, is behind a paywall, but: 1) They appear to be ignoring Shakun et al, 2012 on the issue of CO2 lag; 2) They are absurdly wrong on the relation between CO2 increase and anthropogenic emissions (I also recommend Climate Change Cludoe: Anthropogenic CO2 on this issue); and 3) Arguments that ocean warming has called recent temperature rise generally start by assuming all ocean warming is natural, and then establishing a correlation between ocean temperature rises and global temperatures rises. As the ocean constitutes 705 of the Earth's surface, unsurprisingly they find a large correlation; but the argument is entirely circular. They assume what they set out to prove when they assume the ocean temperature increase is not caused by global warming. All three authors have a past history of exactly that sort of argument, so I do not expect anything different this time around. -
Paul Magnus at 14:12 PM on 31 August 2012Arctic Sea Ice Extent: We're gonna need a bigger graph
Looks like the graph function is transforming to a sawtooth! -
CO2 lags temperature
David Sanger - I have not yet had a chance to read through the paper, but some of the abstract is quite odd. "Changes in ocean temperatures appear to explain a substantial part of the observed changes in atmospheric CO2 since January 1980." - Based on ice core evidence, it takes 500-800 years for CO2 to respond to ocean temperature changes, and the 100 ppm change seen between glacial and interglacial periods is associated with 5-6C of temperature change. Since 1980 (32 years) we've seen 0.5C of warming and more than 50 ppm increase. Those numbers just don't support their conclusions. Even more damning, ocean CO2 is increasing as the oceans acidify. They cannot be the source of CO2 increase. Given those basic issues wherein the facts contradict this papers conclusions, I suspect the paper as a whole is not a contribution to science. -
Rob Painting at 13:38 PM on 31 August 2012CO2 lags temperature
David - you really do have to wonder how such nonsense gets published. Ocean acidification i.e. the increase of global atmospheric carbon dioxide dissolved in sea water renders the thrust of this paper null & void. For a relatively thorough treatment of this subject I'd recommend this SkS post: Climate Change Cluedo: Anthropogenic CO2 Where does Humlum think all human carbon dioxide emissions are disappearing to anyway? -
davidsanger at 13:20 PM on 31 August 2012CO2 lags temperature
Could someone comment on the paper released today in Global and Planetary Change : "The phase relation between atmospheric carbon dioxide and global temperature" Humlum, Stordahl and Solheim. Abstract is at http://www.sciencedirect.com/science/article/pii/S0921818112001658 but the full text is behind a pay wall. "Ice cores show atmospheric CO2 variations to lag behind atmospheric temperature changes on a century to millennium scale, but modern temperature is expected to lag changes in atmospheric CO2, as the atmospheric temperature increase since about 1975 generally is assumed to be caused by the modern increase in CO2." HIghlights "...►Changes in ocean temperatures appear to explain a substantial part of the observed changes in atmospheric CO2 since January 1980. ► CO2 released from use of fossil fuels have little influence on the observed changes in the amount of atmospheric CO2, and changes in atmospheric CO2 are not tracking changes in human emissions." Has this paper gone through peer review and what do SKS regulars think of it. What's the issue or explanation?Moderator Response: [DB] Please do not hit the refresh after submitting a comment. This forces the browser to post a duplicate message(s). -
Doug Bostrom at 12:31 PM on 31 August 2012Realistically What Might the Future Climate Look Like?
Back in the early sixties when we began seriously talking of going to the moon, none of us believed we'd get there by going outside-- alone-- and urgently flapping our arms and vigorously jumping. No matter how sincere or generous was our individual desire to make a footprint separated 385,000km distant by nothing but two deep gravitational wells, we knew we couldn't do it by acting as individuals, without the distinguishing human characteristic of informed organization on a massive scale. By all means, look out for opportunities to lessen your footprint. But recognize that items such as halogen bulbs, polyethylene water tanks, metal fasteners and a myriad of other articles-- even, unfortunately, solar panels-- needed to implement a solo effort are presently themselves part and parcel of the system of unaccounted external costs that are leading us to disaster. When it comes to addressing the dire curves Dana shows at the beginning of this article, we hang together or we hang separately, to paraphrase. The same hugely informed, massively powerful organizational skill that lets us do amazing things such as to entirely free spacecraft from our solar system is what's going to save us from the pickle we've created by using those same powers of organization more thoughtlessly, if anything can. -
EliRabett at 10:44 AM on 31 August 2012Global Warming - A Health Warning
Eli strongly suggests that Agnostic use the google. There is plenty of VOCs in Mexico City due to, among other things very incomplete combustion from crappy cars and buses. They are starting to control the problem but it is wrong to say that ozone is not a problem, along with aerosols and NOx. They got it all, in spaced. Mario Molina has spent a great deal of time trying to quantify and help relieve the problem there. Use the google. -
Tom Curtis at 10:29 AM on 31 August 2012Matt Ridley - Wired for Lukewarm Catastrophe
Joel Upchurch, this entire conversation reminds me of learned discussions of how angels select parners for pinhead dancing. You are taking a short record and trying to project growth 100 years into the future without any consideration of the relevant physical factors. It may be an interesting class room exercise, but has no bearing on the real world. Treated abstractly, there three major variables determining CO2 emissions. The three are population, per capita GDP, and carbon emissions per unit of GDP (carbon intensity). Taking just growth in GDP, if it continues at the historical average of about 3% per annum, then by 2100, emissions will have increased by a factor of 12 over current levels. That by itself is more than enough to increase atmospheric concentration of CO2 to 900 ppmv or more. On top of that is an expected growth of world population by 40% in the next 40 years. That does not simply add 40% to the expected emissions growth from GDP growth because most of the population growth will be in low GDP nations. Never-the-less, it shows that 900 ppmv by 2100 is an underestimate of likely CO2 concentration unless we significantly reduce emissions intensity. Just to maintain constant CO2 emissions, and hence a linear increase in CO2 concentration, that means we require a reduction in emissions intensity of 3% per annum for the rest of this century, with emissions intensity of only 8% of current values by 2100. Even that fails to allow for population growth, so the actual reduction required to maintain constant emissions is greater than 3% per annum. That assumes that constant emissions is actually OK. There is considerable reason to think that we must transition to effectively zero emissions by 2050, something that will require around 10% reduction in carbon intensity per annum, or 3% of 2010 carbon intensity per annum. Neither of these scenarios will happen without substantial government policies driving the issue. Even the 3% compounding per annum required just to maintain constant emissions is likely beyond the capacity of private industry unless explicit regulatory frameworks to encourage the reduction are in place. -
scaddenp at 10:15 AM on 31 August 2012Matt Ridley - Wired for Lukewarm Catastrophe
628ppm by 2100 would translate into around 2.2K of warming cf current day given best estimates of climate sensitivity though you would not expect all of that to realized by 2100. -
skywatcher at 10:05 AM on 31 August 2012Matt Ridley - Wired for Lukewarm Catastrophe
Joel, #54, you arrived on this thread (#21) by putting a naive linear fit through 30 years of temperature data. You followed that up (#23) by making a variety of naive proclamations about the relationship between CO2 and temperature (essentially assuming that CO2 was the only forcing, that there were no feedbacks, and that the response to CO2's forcing would be instantaneous). All those assumptions are wrong, and affect your conclusions. In #28 you demonstrate particularly poor statistical treatment of data by putting a linear trend through the CO2 concetration dataset that is clearly accelerating over time, ignoring assessment of the residuals (for example such as Tamino's). All the while you seem to be claiming a rigid, linear fit and extrapolation with no assessment of processes such as feedbacks or the time delay due to equilibration of the energy balance (which is why we talk of transient and equilibrium climate sensitivity, look it up). Yet somehow you expect us to think you're onto something here? The IPCC's scenarios (you do realise that emissions cannot be simply extrapolated, don't you?), are here. You'll note that the A1FI, A2 and A1B scenarios all cross 700ppm, A1FI and A2 cross 800ppm by 2100. The IPCC's emissions scenarios have considerably greater justification than any of the naive curve fits you've managed so far. Tamino didn't say the CO2 data "wasn't exponential", he showed it was "greater than exponential", and he showed this with considerably more rigor than you have managed to date. -
scaddenp at 10:04 AM on 31 August 2012Realistically What Might the Future Climate Look Like?
Dale, I agree with those points. But getting meaningful reductions in GHG by the energy conservation actions of concerned individuals alone seems very unlikely. I have the feeling from your posts that you do not support action on climate change. Is truly motivated by a belief in low climate sensitivity (and I dont see a post yet where you provide the evidence to support this), or because you dont like the proposed solutions? -
Joel Upchurch at 09:58 AM on 31 August 2012Matt Ridley - Wired for Lukewarm Catastrophe
KR @ 47 An exponential can be fit to almost any data. If you don't think it is exponential, then explain what curve you think fits the actual data better and the scientific justification for the curve is -
Joel Upchurch at 09:24 AM on 31 August 2012Matt Ridley - Wired for Lukewarm Catastrophe
Bernard J. @46. I'm sorry, but without the supporting data all you have done is draw a pretty picture that you are asking us to take on faith. I have a math degree, so I don't think I will swoon if post the supporting data. -
Joel Upchurch at 09:17 AM on 31 August 2012Matt Ridley - Wired for Lukewarm Catastrophe
KR @ 45 I looked at the graph and it actually looks like a good fit for real world data. Here is my latest graph: CO2 1958-2012 Exponential Fit R-Squared is .98 and visually the curve fits within the seasonal variation in CO2, but that isn't the important part. the article you cited has an interesting graph. Tamino CO2 You will notice that C02 follows a nice smooth curve since 1998, except for the last few years which is probably the recession. I have a graph for 2000-2012 CO2 from 2000-2012 That gives 628PPM by 2100. I can exclude the recession data by graphing just 1998 to 2006 if you like. C02 Spreadsheet Or you can download my spreadsheet and graph you own curve. Saying the data isn't exponential isn't very useful. The curve fitting routines can get an excellent fit for almost any data, unless you think there will be a singularity. What curve do you expect future C02 growth to follow? -
Dale at 09:05 AM on 31 August 2012Realistically What Might the Future Climate Look Like?
(Snip) Jeffrey @31: 'If we do A, then B will probably happen' is an opinion. That is not science. You can't experimentally test for that. However if you say something like 'When condition A exists, test show B is probable', that's experimental science. Personal opinion does not belong in science. Scientists may have personal opinions, but they have no place in science literature. Sphaerica: I did used to read a lot of papers in fact. Now, due to lack of time it's a lot harder. There's also an element of lack of interest too. That turning point I can pinpoint specifically. When "science" said that obesity causes global warming, that's when you lost me. http://www.abc.net.au/science/articles/2008/05/16/2247103.htm That's the type of BS that is making people scoff. The sad reality is that when the dust settles, no matter who "wins" science will be the biggest loser.Moderator Response:TC: Moderation complaint snipped. Dale, compliance with the comments policy is not optional. If you took the effort to comply, moderators would be saved considerable effort, and you could have as complete a conversation as you desire, provided you remain on topic.
[DB] As a subsequent comment to this by Dale was too egregious to survive moderation I am placing this warning here:
Please note that posting comments here at SkS is a privilege, not a right. This privilege can and will be rescinded if the posting individual continues to treat adherence to the Comments Policy as optional, rather than the mandatory condition of participating in this online forum.
Moderating this site is a tiresome chore, particularly when commentators repeatedly submit offensive, off-topic posts, knowingly false statements and continually complains about moderation. We really appreciate people's cooperation in abiding by the Comments Policy, which is largely responsible for the quality of this site.
Finally, please understand that moderation policies are not open for discussion. If you find yourself incapable of abiding by these common set of rules that everyone else observes, then a change of venues is in the offing.
Please take the time to review the policy and ensure future comments are in full compliance with it. Thanks for your understanding and compliance in this matter, as no further warnings shall be given.
-
Bostjan Kovacec at 08:36 AM on 31 August 2012Realistically What Might the Future Climate Look Like?
M Tucker @26 Coludn't agree with you more that only drastic and quick cuts in emissions can keep us at 2oC. 1.8 or 2.2 oC doesn't look like much of a difference- but based on what we've experienced in last 30 years it translates into additional 1 oC on top of 3,6 oC here at my place. Combined with reduced rainfall - yes, it's a big deal! Might just be the limit over which we can't addapt any more. New varietis of crops won't save us. Climate is progressing faster than any breeding of new varietis can. "Drought resistant" concept means the plant will die a bit later, but without water it simply won't grow. Not to mention heat stress. JohnMashey @27 Solar tractors might be fun at a golf course or small and flat plots, but feeding 9 billion people is a different story. Wind turbines on fields is a good idea. But then you can farm only in windy places. It requires heavy investment and I'm qite sure someone will be able to pay more for the electricity than falling yealds can bring in. Growing food is not that profitable, but if it was, most people couldn't afford eating much. Burning biomass can be short term solution, but after a few years soil looses fertility if it does't get organic material back. There's also nitrogen problem with it. Nothing grows without it, so we'd need to use much more fertilisers, meaning more energy imput. I'm quite skeptical about using biofuels to run agriculture. It simply doesn't make sense because we'd need to use more land than we're using for farming now, plus the fertiliser problem and emissons from land use. Transportation is easy to solve because it runs on roads. Agriculture needs living soils, water and right weather. -
Bob Lacatena at 08:33 AM on 31 August 2012Realistically What Might the Future Climate Look Like?
Dale, You can't tell the BS from the truth because you haven't studied the science enough. I strongly suggest that, if you have the time, you stop posting comments, stop getting angry at everything, and take it on yourself to truly and completely learn and understand everything there is to know about it. Only then will you be qualified to call "BS" on any particular claim. And no, you don't know nearly enough yet. Don't read articles and blogs and summaries. Read actual papers, and text books. Go down to the very source, and be skeptical even when reading that. But skeptical without arrogance. Beware of Dunning-Kruger. -
Jeffrey Davis at 08:01 AM on 31 August 2012Realistically What Might the Future Climate Look Like?
"Scientists aren't supposed to have opinions. " Who told you that? Scientists aren't something other than people. They have to have opinions. -
Jeffrey Davis at 08:00 AM on 31 August 2012Realistically What Might the Future Climate Look Like?
"Papers coming out like 'the climate dice' are not science but opinion (activism)." Ridiculous. "Dice" is simply a metaphor to illustrate probabilities. Probabilities are definitely a realm of science. -
Dale at 07:23 AM on 31 August 2012Realistically What Might the Future Climate Look Like?
scaddenp @28 No I haven't calculated how much CO2 I'm mitigating. But to me the issue isn't CO2. The issue is reducing man's footprint on the planet as a whole. I eat less hoofed meat as they cause much worse erosion than toed meat. I grow my own vegies to reduce the amount of chemically/GM grown vegies. I bought solar panels to move to sustainable energy. To me the problem isn't global warming, climate disruption, CO2, or whatever this week's catch phrase is. To me the issue is that human's have too large a negative footprint on the planet. -
Composer99 at 06:51 AM on 31 August 2012Matt Ridley - Wired for Lukewarm Catastrophe
Sphaerica @50: scaddenp @ 36, has, I suspect, correctly come to the point. Joel Upchurch appears to have confused climate forcings with feedbacks (inadvertently, I am sure) and appears to be accusing the IPCC of being in error on this point, apparently on the basis of your statements in #26. Hope that makes things clear (as mud). -
M Tucker at 06:20 AM on 31 August 2012Realistically What Might the Future Climate Look Like?
All discussion of limiting warming to 2 degrees is useless unless we end all GHG emissions. As long as the world’s total emissions keep going up we will pass that magic number. Unless the world is prepared to end all emissions in the next few years we will see the world’s average warming go beyond that. I base this on the fact that CO2 will linger in the atmosphere for hundreds if not thousands of years before natural processes begin to reduce them. The USGS has been conducting research on the Pliocene warm period since the 1980’s; it is called the PRISM project (Pliocene Research Interpretation and Synoptic Mapping). They have shown that with CO2 levels very much like we have today the world warmed about 2 to 3 degrees Celsius. This was without the addition of cooling aerosols that modern civilization also pumps into the atmosphere. So that magic number of 2 degrees, to my thinking, is past. The world will continue to belch CO2 for many decades to come because only China can control China and only India can control India. They will eventually reduce when they are good and ready and reduction will not get the job done. Reduction will only slow the growth of CO2 emissions, it will not end them. That, of course, also goes for the US and Canada and any other country the folks here would like to add to the list of relentless GHG emitters. The IPCC is notoriously conservative in their estimate of warming, ice melt and sea level rise. I have been influenced by the work done by the USGS, Dr James Hansen, Dr Michael Mann, Dr Gavin Schmidt, Dr Lee R Kump, and Professor Jonathan Foley. There are others who share their views but they are the ones who have convinced me. I’m sure a few here will disagree with me but I recommend that you investigate their work. My layman’s opinion does not really matter. Go to the meetings where these gentlemen present their work and have at them. Challenge them to defend their work. My opinion of the magic 2 degree “limit” is that it is bunk! If we stop at 1.8 degrees will we all be safe? If we arrive at 2.2 degrees are we all doomed? The world has experienced less than 1 degree so far and look at the chaotic disruptions to climate we have experienced. Will agriculture be able to keep up with ever rising demand and cope with further disruptions? Corp yields have been virtually flat for years. New seeds, if you are willing to accept the new engineered seeds, have been designed to cope with drought and ethanol production. The seed engineers have not been able to boost yield. I applaud all who have made personal choices to reduce their carbon footprint. I too have taken up the struggle but reduction will not bring us back to a pre-industrial climate. We are all in for a very challenging future. My children and grandchildren are in for a very challenging future. But focusing on 2 degrees is pointless. We need to focus on moving away from fossil fuel use, on carbon neutral solutions and on mitigation strategies so civilization can survive into the next century. -
scaddenp at 06:03 AM on 31 August 2012Realistically What Might the Future Climate Look Like?
Dale - now have you calculated what your CO2 percentage saving actually amounts to? Also, in the appropriate place (ie not in this thread), how about you post the science which makes you think IPCC is wrong about water vapour? You have also only commented on individual responsibility. Perhaps you might think what actions should government be doing (perhaps commenting here if appropriate. -
JohnMashey at 05:54 AM on 31 August 2012Realistically What Might the Future Climate Look Like?
Agriculture: 1) Electric tractors already exist, and one great thing about farm machinery is that it tends to have a limited radius of use. 2) Still, things like 300HP combines are tough, and they may well have to rely on biofuels. if at some point, nobody can grow corn because of lack of fuel, some of that corn will go into biofuel. Of curse, one would first want to electrify as much as possible, and before going to biofuel conversion, look at burning biomass to produce electricity. 3) In US MidWest, wind turbines are quite compatible with farms, since they consume only a few % of the acreage, given spacing requirements for big turbines. -
dana1981 at 05:52 AM on 31 August 2012Realistically What Might the Future Climate Look Like?
Bostjan @25 - it's plausible that agriculture could be run on biofuels, perhaps in combination with other technologies. It's impossible to say what sorts of technological developments we'll have in the next 30 years. If you prefer, you can make the ski slopes even steeper and leave some amount of the emissions budget for subsequent years. -
Bostjan Kovacec at 05:27 AM on 31 August 2012Realistically What Might the Future Climate Look Like?
Dana @24 Even if we exclude emissions from land use, cattle,etc. will still need something to run tractors and stuff on, loads of energy for nitrogen fixation, pesticides, and so on. At the moment we plow an area the size of S America. What on Earth are we going to run the machinery on after 2060's? Solar? Biofuels? I firmly believe that any scenario saying that by year xy we'll achieve zero emissions from fossil fuels is just wishful thinking and hardly serious science. I can believe that the author of figure 1 was well intentioned. Reductions presented in it are tremendous. But we always have to compare data/ideas to reality. In this case reality is saying that emissions simply have to collapse (vertically) today to a certain level which we'll give us enough emissions budget to keep farming. Otherwise we'll blow way pass the target emissions or we'll go hungry even before drought gets us. But agriculture is just one sector. I can imagine many other sectors will never possibly phase out fossil fuels completely. So, to answer the question about the future climate - here where I live it's going to be dry and sunny with temps up to 50 C most of the summer. Used to be quite cold and really wet. Somebody prove me wrong! I'd really appreciate. -
JohnMashey at 05:06 AM on 31 August 2012Matt Ridley - Wired for Lukewarm Catastrophe
re: 48 Smith Yes, certainly there may be prairie extension. Sadly, some of that might be assisted by bark beetles chewing through Alberta and working their way across the Boreal forest. I simply mentioned the Shield because I've more than once encountered people simply looking at a map and thinking there is a lot of land up North where agriculture can move without thinking in the slightest about the nature of the soils, rainfall, etc. Usually, people saying this have ~zero experience with farming. I wouldn't pretend to have seen detailed studies of Northwood movement of agriculture, although since we ski every year at Big White, I'm familiar with the Northward spread of viticulture in the Okanagan region. Anyway, if anyone has serious studies of Canadian soils and their suitability for framing assuming a warmer climate, they would be interesting to see. -
Johnb at 04:51 AM on 31 August 2012Arctic sea ice breaks lowest extent on record
Jake try this link for animation 2003 to April 2012 Johnb "Hybrid"(AMSR-E/SSMIS) Animation of Arctic sea ice concentration, Jan 2003 to April 2012; -
folke_kelm at 04:42 AM on 31 August 2012Arctic sea ice breaks lowest extent on record
it is very possible that you are right CBDunkerson with 4 square kilometer of ice in september. Taking into account that we roughly loose 1 km3 / year we have 4 years to go, which should remind us about Maslowskis prediction from 2006, that if the current trend continues, we will have near zero sea ice cover from 2016 +/- 3 years. That was a pretty god shot. http://neven1.typepad.com/.a/6a0133f03a1e37970b016769050b57970b-pi from: http://neven1.typepad.com/blog/2012/08/piomas-august-2012.html -
Smith at 03:49 AM on 31 August 2012Matt Ridley - Wired for Lukewarm Catastrophe
Bernard J @ 49: Can you please clarify your point regarding the geometry of moving north? Does this presuppose an equivalent loss of farm land on the southern end? Do you have any links to scientific papers, which have evaluated the relative greenhouse gas release from soil vs. that absorbed by expansion of the boreal forest? -
dana1981 at 03:30 AM on 31 August 2012Realistically What Might the Future Climate Look Like?
Bostjan @23 - thanks. Figure 1 just represents CO2 emissions from fossil fuel combustion. Though we would have to figure out agriculture sans fossil fuels to achieve zero emissions.
Prev 1087 1088 1089 1090 1091 1092 1093 1094 1095 1096 1097 1098 1099 1100 1101 1102 Next


