


 Arguments


Recent Comments
Prev 1118 1119 1120 1121 1122 1123 1124 1125 1126 1127 1128 1129 1130 1131 1132 1133 Next
Comments 56251 to 56300:
-
Daniel Bailey at 14:07 PM on 23 July 2012Trigger for past rapid sea level rise discovered
Barry, note that this SkS blog post is a reprint. -
barry1487 at 13:56 PM on 23 July 2012Trigger for past rapid sea level rise discovered
I think this article would be improved by including caveats. The scientific conclusions may be strong, but not definite. Uncomfortable with absolute language here. -
Bernard J. at 13:46 PM on 23 July 2012Greenhouse effect has been falsified
I'm certain he has an explanation. They always do.
Don't they just? And the operative word is "an". The explanation doesn't need to be the correct one, because the intent here is to sow fear, uncertainty, and doubt. Purely and simply. Richard Pearson's target audience is the unsure, non scientifically-educated swinging voters who form a large proportion of his and his colleagues' voting constituency. Sadly, most of them are not as cooly logical as Philippe, and frustratingly there never seems to be a simple way of getting across perceptive points such as his. Pearson doesn't need to be right; he just needs to be convincing. -
chriskoz at 13:42 PM on 23 July 20122012 SkS Weekly Digest #29
I'm annoyed by the vulgarity of the crude text-box to enter the comments. It's inconvenient to type those "a" "i" "blockquote" "img" tags, needless to say I never remember the syntax and i.e. often produce bad links. Preview button + hyperlink help is not enough. Is there any WYSIWYG editor that would do it for me? If not possible to link WYSIWYG editor to this Comment box, can anyone recommend a simple & easy external editor for that? -
Bernard J. at 13:37 PM on 23 July 2012Vision Prize Results
I also echo John Hartz @15 in that WUWT commenters are the radical fringe, not at all representative of the general public.
Dana and John. I certainly acknowledge that Watts' commenting fan-base is over-sampling from the extreme end of the anti-science pool. My concern is that they have a disproportionate influence in policy, and this was increased recently as a result of an off-the-cuff straw-poll a colleague conducted of non science-specialised students. Around a third believed that there was a serious scientific debate about the evidence for climate change, and of those a majority thought that the science had been done incorrectly or was compromised by personal interest on the part of scientists. Most of the students referred to "the internet" as a source for their doubts of the science. Whether this is more representative of such students generally still has us scratching our heads... Amongst my non-tertiary educated friends and relatives there is a strong propensity to believe that there is no smoke without fire in tabloid stirring of the idea of a debate about the science of climate change. It's classic fear, uncertainty, and doubt. I'm sure that they're not as extreme in their beliefs as the Watts crowd, but the issue is whether they let the fundamental notion of the 'unreliability' of the science influence their decisions when voting and 'consuming'. The overall glacial pace of government action around the world would seem to reflect this. In the Australian context I guess that one test of the general public's ability to balance the realities of climate science against the tabloid 'uncertainties' will occur at the next federal election. One counter to the FUD campaigns of the blog science-denial industry is the presence of initiatives such as the Vision Prize, and I certainly hope that they are able to separate the denial noise from the surveying of the signal of scientifically-qualified opinion. -
Daniel Bailey at 12:12 PM on 23 July 2012Trigger for past rapid sea level rise discovered
Chris Machens, I am considered one of the more "alarmist" among the SkS ranks, yet your claim on your blog of 100 meter SLR over the next 100-200 years is quite frankly incredulous. For one thing, not enough ice exists to cover that gap due to melt nor do 1-2 centuries give enough time for full thermal equilibria of the ocean depths to be reached to get the full thermal expansion effects. I'm happy to entertain many possibilities, no matter how wild, but in the end it comes down to physics and evidence. As the esteemed Martin Vermeer suggests on your blog, perhaps you should check your maths. As it stands, your comment is not very on-topic for the OP of this thread. -
Paul Magnus at 07:46 AM on 23 July 2012Trigger for past rapid sea level rise discovered
Anyone monitoring the height of the Greenland dome? -
prokaroytes at 06:25 AM on 23 July 2012Trigger for past rapid sea level rise discovered
Possible Sea Level Rise of 1-3 meters (or more) within the next 50 years Based on the current rate humans put Co2 into the atmosphere, which is 10,000 times faster than the natural processes. For that matter and potential singular positive feedbacks the rate of Sea Level Rise (SLR) can be assumed to rise with a similar rate. And for that matter there is no equivalent in the earth recorded history. The main SLR rise is likely not to come from melted water, rather then thermal expansion, which is attributed to be 70-75% of current observed SLR.Moderator Response: [DB] Fixed link. -
RonManley at 06:17 AM on 23 July 2012Yes, Virginia, There is Sea Level Rise
Rob Painting # 20. I don't say that the sea level rises all by itself. What the data do show that is the rate of sea level rise fluctuates in a quasi-cyclic way. You can download the Excel file I used here and check it yourself.Moderator Response: [DB] Fixed link. -
John Mason at 03:47 AM on 23 July 2012Joe Romm's Congressional Testimony
Good on Joe. It is high time we ditched the euphemisms and stopped pussyfooting about. We hung along for too long with the Banking industry - bowing to calls for deregulation etc - and look exactly where that has gotten us too. If that's not a wake-up call to us ordinary folk, what will it take? It's a brilliant world out there - under tremendous strain - but it is still managing, just about. Let's do everything in our power, however small that may be, to further the simple cause of wanting a brilliant world for our children and grandchildren and not a toxic, polluted mess where the last 'consumers' wander about looking for the last bargains. We can do this, folks - if we speak with one voice (and not a World Socialist Government voice, before anyone starts) - just the voice of the people, who love their gardens, the wildlife around them, getting their hands dirty with the soil of the land and who hate all the form-filling, box-ticking nonsense that is the facade of dealing with the biggest issue of our lives when pretence is the order of the day. I would rather see children knowing 100 plant-names and recognising 50 different butterflies by the age of ten - as I did many years ago - than knowing 400 brand-names by the age of five. That's just one aspect, but I hope people will see where I'm coming from! Rant over! -
Tristan at 03:13 AM on 23 July 2012Greenhouse effect has been falsified
I'm certain he has an explanation. They always do. -
Philippe Chantreau at 02:31 AM on 23 July 2012Greenhouse effect has been falsified
Tristan, if he is as bright as you suggest, then I'm sure he must have an explanation as to why there is so much more downwelling IR radiation reaching the surface than what the Sun emits. That is an easy, reliable, confirmed over and over, direct, real world observation, in total contradiction with the little experiment you link above. So allow me to be a little skeptical. Where does all that IR come from? -
Tristan at 21:15 PM on 22 July 2012Greenhouse effect has been falsified
Following from my earlier comment about our state MP who advocates against the science of climate change, here he is demonstrating that he's not just a politician but a brilliant scientist. -
Rob Painting at 19:41 PM on 22 July 2012Yes, Virginia, There is Sea Level Rise
Ron - The notion that the sea level simply rises all by its lonesome, as part of some mysterious natural quasi-cycle, is ridiculous. And yes, you are right climate models certainly don't allow for this physically impossible scenario. -
shoyemore at 18:40 PM on 22 July 2012The Mid-Wales floods of June 2012: a taste of things to come?
Found the Matthew Kahn video The Free Market as a Solution to Climate Change Kahn sees the insurance industry as a key "sender of a price signal" about housing. Governments should not help communities at risk because they will only attract more inhabitants to those areas. These ideas are refreshing. But one wonders, if inaction continues, how feasible is the "free market" if tens of thousands, if not millions, are simultaneously affected? -
Alan E at 18:29 PM on 22 July 20122012 SkS Weekly Digest #28
@ curiousd I have supported Carbon Community Foundation (http://carboncommunity.org.au) and know the two principles - Andrew Flint and Chris Trafford. CCF's mission is to replace kerosene lamps with solar lamps in villages that are off-grid. We're talking 300 million households so there's a lot to do. CO2 emissions are the tip of the iceberg - buying kero drains the household budget and burning it causes all manner of really bad health problems. And having cheap light at night aids home businesses and kids education. CCF are pretty young and have partnered with Barefoot Power (http://www.barefootpower.com/) and others who can bring the products and distribution channels. -
RonManley at 18:18 PM on 22 July 2012Yes, Virginia, There is Sea Level Rise
I should have posted a graph earlier to minimise the confusion. I calculated the rate of sea level rise based on the data of Church et al merged with the Jason-Topex data for recent years. The data start in 1870 so for every year from 1890 onward I calculated the rate of change of sea level in the preceding 20 years (very easy in Excel using LINEST). This plot shows that:
1. There is an underlying increase in the rate of rise. It works out at about 1mm per year increase every 70 years.
2. The rate of increase in sea levels is quasi-cyclical. Thus, depending on the phase of the cycle it is possible both to have an underlying acceleration and short term (c 30 years) drop in the rate of rise.
Despite the implications I am not a climate change denier. I believe that the acceleration in the rate of increase is almost certainly due to global warming alone. I am also in favour of the decision relating to the citizens of Virginia being based on science. However since the rate of sea level rise is quasi-cyclical and since as far as I know (correct me if I am wrong) none of the model projections include this then the four year pause to get better science may be to their advantage.
This plot shows that:
1. There is an underlying increase in the rate of rise. It works out at about 1mm per year increase every 70 years.
2. The rate of increase in sea levels is quasi-cyclical. Thus, depending on the phase of the cycle it is possible both to have an underlying acceleration and short term (c 30 years) drop in the rate of rise.
Despite the implications I am not a climate change denier. I believe that the acceleration in the rate of increase is almost certainly due to global warming alone. I am also in favour of the decision relating to the citizens of Virginia being based on science. However since the rate of sea level rise is quasi-cyclical and since as far as I know (correct me if I am wrong) none of the model projections include this then the four year pause to get better science may be to their advantage.
-
Neven at 16:32 PM on 22 July 2012The Mid-Wales floods of June 2012: a taste of things to come?
Like I said, it isn't working: Deadly mudslides sweep through Austria. More from the local media. Apparently we are witnessing a one-in-30-years storm here in Styria, except of course that the last one wasn't 30 years ago... -
Rob Painting at 13:54 PM on 22 July 2012Yes, Virginia, There is Sea Level Rise
Ron Manley - "Rob Painting #2. Your graph actually suggests the rate has been more or less constant from 2001 to 2009 at about 1 mm/year" Ron, I'm sure if one confines oneself to looking at any short interval you can find a short-term trend that affirms a preconceived notion. We call that cherry-picking. On the other hand understanding the physical mechanisms driving these trends is far more useful. For example, if a reasonably-sized El Nino develops this Southern Hemisphere summer I fully expect that sea level will rise abruptly - as the continental land masses, and particularly the tropical basins, dry out. Furthermore, as mentioned above, the loss of ice from Greenland & Antarctica is accelerating - this will manifest itself in greater sea level rise. The solar dimming of the Southern Hemisphere in the "noughties" has shielded the oceans from greater warming, but can much longer can that last? We've already seen that the slowdown in ocean heat content between 2004-2008 has been replaced by greater warming:
-
Tristan at 13:37 PM on 22 July 2012Yes, Virginia, There is Sea Level Rise
Hmm. I wonder if my childmind misinterpreted 2200 as 2022. Possible. -
Rob Painting at 13:28 PM on 22 July 2012Yes, Virginia, There is Sea Level Rise
Tristan @ 14 - never heard that one before, probably because it is nonsense. Certainly the paleodata indicate rates of sea level rise of well over a metre occurred in previous warm intervals (interglacials), but there's no evidence to support rates greater than that. They may have occurred, but the evidence is lacking. -
Albatross at 12:50 PM on 22 July 2012Yes, Virginia, There is Sea Level Rise
Tom @13, Good points. Steve Chase is also wrong about what he claims is stated in the video about global sea level rise. The video starts of with reference being made to a press release from the Niels Bohr Institute, the heading for that press release is: "Studies agree on a 1 meter rise in [global] sea levels" Nowhere do they state 1.8 m as the best estimate for the increase in global sea level by 2100. Admiral Titley does note in the video that sea levels could rise between 0.9 m and 1.8 m by 2100 (~3-6 ft), and that range is entirely consistent with the GRL paper referenced below. So we have some "skeptics" here cherry picking values to misinform and to fit their narrative. That Niels Bohr press release in turn refers to a paper just published in GRL by Jevrejeva et al. (2012) who conclude that: "With six IPCC radiative forcing scenarios we estimate sea level rise of 0.6–1.6 m, with confidence limits of 0.59 m and 1.8 m." So as new information becomes available the best estimates of increases in sea level are being revised upwards. Now 2100 is rather arbitrary, because sea levels will continue to rise well beyond 2100 because of global warming. -
Tristan at 11:52 AM on 22 July 2012Yes, Virginia, There is Sea Level Rise
When I was around 9 (1991) we were shown a video at school about global warming. My takeaway from that video was that the ice sheets could collapse as early as 2022 and this would result in a 60m sea level rise. Some of the kids in the class were crying. Does anyone here have an idea on what that video might have been or where it came from? Thanks in advance. -
Tom Curtis at 10:10 AM on 22 July 2012Yes, Virginia, There is Sea Level Rise
Steve Case @11, first I'll note that the sea level rise projected in that graph is approximately equal to the expected rise from thermal expansion alone assuming the IPCC A2 scenario (270 mm). However, if we linearly extend the rate at which ice sheets are loosing mass, we can expect a further 360 mm of sea level rise on top of that (and ignoring glaciers). That represents a sea level rise of 630 mm above 1980-1999 levels by 2100. That represents an increase of at least 50% above the approx 400 mm increase your projection shows over the same period.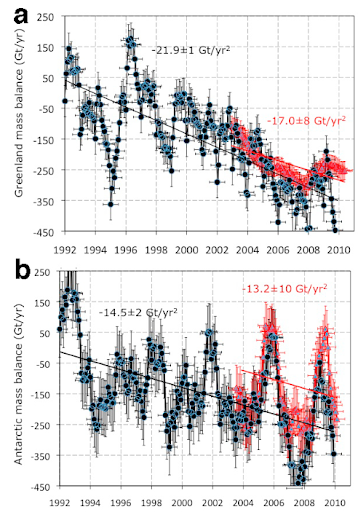 The CSIRO estimate that not more than 30% of the sea level rise since the 1950s has come from polar ice sheets. Based on that, and using your projection, the sea level rise contribution from other sources can be expected to be 280 mm from 1990, leading to a combined expected increase of 640 mm. That estimate is not based on models, it is simple extrapolation of known data.
That illustrates, in part, the folly of simple projection. Using two different projections methods, we arrive at inconsistent results which diverge by over 50%. It also shows how foolish it is to think you can assess future sea level rise without examining potential future changes in temperature, not to mention such wild cards as the potential instability of the West Antarctic Ice Sheet.
The CSIRO estimate that not more than 30% of the sea level rise since the 1950s has come from polar ice sheets. Based on that, and using your projection, the sea level rise contribution from other sources can be expected to be 280 mm from 1990, leading to a combined expected increase of 640 mm. That estimate is not based on models, it is simple extrapolation of known data.
That illustrates, in part, the folly of simple projection. Using two different projections methods, we arrive at inconsistent results which diverge by over 50%. It also shows how foolish it is to think you can assess future sea level rise without examining potential future changes in temperature, not to mention such wild cards as the potential instability of the West Antarctic Ice Sheet.
-
Albatross at 09:16 AM on 22 July 2012Yes, Virginia, There is Sea Level Rise
Steve @11, Can I please remind you about the topic of this post. You seem to be trying your best to obfuscate. I will also note that I cited Church and White (2008), not their 2006 paper. Regardless, nowhere in their paper do Church and White simply extrapolate the best fit line over the observed record as you appear to have done in your figure @11. Doing so is a no-no from both statistical and physical stand points. Readers might be interested to note what Church and White (2008) have to say about recent rates of sea level rise when referring to the figure below (their Fig. 6): Caption: "Projected sea-level rise for the 21st century. The projected range of global-averaged sea-level rise from the IPCC (2001) assessment report for the period 1990–2100 is shown by the lines and shading (the dark shading is the model average envelope for all SRES greenhouse gas scenarios, the light shading is the envelope for all models and all SRES scenarios, and the outer lines include an allowance for an additional land-ice uncertainty). The updated AR4 IPCC projections (90% confidence limits) made in 2007 are shown by the bars plotted at 2095, the magenta bar is the range of model projections and the red bar is the extended range to allow for the potential but poorly quantified additional contribution from a dynamic response of the Greenland and Antarctic ice sheets to global warming. Note that the IPCC AR4 states that ‘‘larger values cannot be excluded, but understanding of these effects is too limited to assess their likelihood or provide a best estimate or an upper bound for sea-level rise.’’ The inset shows the 2001 projection compared with the observed rate estimated from tide gauges (blue) and satellite altimeters (orange) (based on Church et al. 2001; Meehl et al. 2007; Rahmstorf et al. 2007)"
"The concern that the sea-level projections may be biassed low has been reinforced by a comparison of observed and projected sea-level rise from 1990 to the present. For this period, the observed sea level has been rising more rapidly than the central range of the IPCC (2001, 2007) model projections and is at the very upper end of the IPCC TAR projections (Fig. 6; Rahmstorf et al. 2007), indicating that one or more of the model contribu- tions to sea-level rise may be underestimated." [My highlighting]
In my opinion, those who wish or choose to believe, that uncertainty is skewed towards the lower end of outcomes, are being incredibly naive.
Caption: "Projected sea-level rise for the 21st century. The projected range of global-averaged sea-level rise from the IPCC (2001) assessment report for the period 1990–2100 is shown by the lines and shading (the dark shading is the model average envelope for all SRES greenhouse gas scenarios, the light shading is the envelope for all models and all SRES scenarios, and the outer lines include an allowance for an additional land-ice uncertainty). The updated AR4 IPCC projections (90% confidence limits) made in 2007 are shown by the bars plotted at 2095, the magenta bar is the range of model projections and the red bar is the extended range to allow for the potential but poorly quantified additional contribution from a dynamic response of the Greenland and Antarctic ice sheets to global warming. Note that the IPCC AR4 states that ‘‘larger values cannot be excluded, but understanding of these effects is too limited to assess their likelihood or provide a best estimate or an upper bound for sea-level rise.’’ The inset shows the 2001 projection compared with the observed rate estimated from tide gauges (blue) and satellite altimeters (orange) (based on Church et al. 2001; Meehl et al. 2007; Rahmstorf et al. 2007)"
"The concern that the sea-level projections may be biassed low has been reinforced by a comparison of observed and projected sea-level rise from 1990 to the present. For this period, the observed sea level has been rising more rapidly than the central range of the IPCC (2001, 2007) model projections and is at the very upper end of the IPCC TAR projections (Fig. 6; Rahmstorf et al. 2007), indicating that one or more of the model contribu- tions to sea-level rise may be underestimated." [My highlighting]
In my opinion, those who wish or choose to believe, that uncertainty is skewed towards the lower end of outcomes, are being incredibly naive.
-
Steve Case at 07:42 AM on 22 July 2012Yes, Virginia, There is Sea Level Rise
#6 RonManley said, "If a rise of 1 metre is to be attained by 2001 [sic] then the change in rate will be such that changes observed in the past pale into insignificance." The video actually predicted six feet or about 1.8 meters of sea level rise by 2100. #9 Albatross put up a graphic of the Church and White data. That data is available on the Church and White Data Page as Church and White (2006) If you graph it out and extend the Y axis to include the 1.8 meter prediction and extrapolate the time line out to 2100 as the video said, it looks like this: It's merely a question of whether Sea Level rise will accelerate enough to make that prediction come true.
-
Albatross at 05:05 AM on 22 July 2012Yes, Virginia, There is Sea Level Rise
Ron @8, Please make up your mind, @1 you said [my bolding] " Whilst the data do show an underlying acceleration in the rate of sea level rise it is less that the models project. " But now @8 you claim that "over a 20, 10 or 5 year period the rate of rise is lessening." Please stop playing word/rhetorical games. The Senate in Virginia wishes to deny all the science (both empirical and theoretical) that indicates that, in the long-term, the rate of sea-level rise will continue to accelerate. Does it not trouble you in the least that they are a) of this opinion/belief, and b) the lengths they went to to try and enforce their denial on others? -
Neven at 04:52 AM on 22 July 2012The Mid-Wales floods of June 2012: a taste of things to come?
I regard sea-level rise as a slower threat I wasn't referring to SLR, but to the storms that the Atlantic gives birth to. That's why I hide behind the Alps (not that it's working). -
Albatross at 04:45 AM on 22 July 2012Yes, Virginia, There is Sea Level Rise
Some "skeptics" posting here are focussing on very short periods again to try and obfuscate, whilst also not supporting their assertions with hard numbers or data. Church et al. (2008) demonstrate nicely how the long-term trend is not linear but accelerating. [Source]
It is this reality that some in Virginia wish to deny, and that is the subject of this post "Yes, Virginia, There is Sea Level Rise".
[Source]
It is this reality that some in Virginia wish to deny, and that is the subject of this post "Yes, Virginia, There is Sea Level Rise".
-
RonManley at 03:19 AM on 22 July 2012Yes, Virginia, There is Sea Level Rise
Dana1981 #7. To avoid confusion, I am not saying that sea levels are falling, it is clear that they are continuing to rise. What I am saying, and what the data quoted in my previous posts support, is that over a 20, 10 or 5 year period the rate of rise is lessening. -
dana1981 at 02:46 AM on 22 July 2012Yes, Virginia, There is Sea Level Rise
Ron @6 - my point is that "appears to be on a downward trend" is clearly not supported by the data. -
RonManley at 02:30 AM on 22 July 2012Yes, Virginia, There is Sea Level Rise
Rob Painting #2. Your graph actually suggests the rate has been more or less constant from 2001 to 2009 at about 1 mm/year. Since the era of satellite data the 5-year rate of rise peaked at 4.5 mm/year in May 2003. The current 5-year rate of rise up April 2012 is 2.3 mm/year. So, overall the rate of rise is falling. Dana #4. You suggested that changes in the 20-year rate of sea level rise were ‘short-term noise’ and then show a straight line fit. My point was the rate has fluctuated over periods of several decades and currently appears to be on a downward trend. I’m not sure showing the long-term trend is appropriate as the crux of this posting is to argue that the long-term trend is not a good indicator for the future. If a rise of 1 metre is to be attained by 2001 then the change in rate will be such that changes observed in the past pale into insignificance. -
dana1981 at 02:09 AM on 22 July 2012Vision Prize Results
As now noted at the end of the post, the 'no consensus' rebuttal has been updated to include the Vision Prize results. -
dana1981 at 01:34 AM on 22 July 2012Vision Prize Results
Bernard J @13 - to be fair, the Vision Prize isn't limited to climate scientists, but also includes individuals "with relevant scientific or technical credentials," for example. That's how I was able to participate, as an environmental scientist with a physics background. I suspect Watts might qualify with his meteorology background, though as I recall he doesn't have a degree in the subject? I also echo John Hartz @15 in that WUWT commenters are the radical fringe, not at all representative of the general public. -
Composer99 at 01:28 AM on 22 July 2012Yes, Virginia, There is Sea Level Rise
The best fit for the current trends in Greenland and Antarctica land ice (as per papers such as Velicogna 2009 which is linked to here) is an accelerating decline. If memory serves, the range of sea level rise considered most likely is between 0.75 and 1.9 metres by 2100, starting from the levels in 1990 (per Vermeer & Rahmstorf 2009). Even the 'best case' scenario is bad. -
dana1981 at 01:28 AM on 22 July 2012Yes, Virginia, There is Sea Level Rise
As Rob notes @2, an acceleration (which I would certainly not characterize as 'healthy' because of the unintended connotations of that word) is exactly what's going to happen. RonManley @1 - you are confusing short-term noise with long-term trend changes.
-
John Hartz at 01:26 AM on 22 July 2012Vision Prize Results
Bernard J: With all due respect, the "mob" posting on WUWT is an insignificant fraction of the human population. -
Bernard J. at 01:12 AM on 22 July 2012Madness over sea level rise in North Carolina
Tristan. What's even more sad is that this political interference in science will likely grow much worse, and for many years yet, before it improves. That should be just enough to permanently stuff things up. -
Steve Case at 00:02 AM on 22 July 2012Yes, Virginia, There is Sea Level Rise
#2 Rob Painting "Whether it will accelerate in the next few years remains to be seen" Yes, and in order to get to the prediction in the video, 6 Feet (1.8 meters) by 2100 it will have to average over 20 mm/yr for the next 88 years. That's well over six times the current rate. A very healthy acceleration will have to happen in order for that prediction to come true. -
Tristan at 23:46 PM on 21 July 2012Madness over sea level rise in North Carolina
Richard Pearson is the Noosa LNP member who proposed that anti-science motion Bernard linked to. He just commented over at JoNova's blog. Not that I recommend the link. The fact that he's even there is a sad indictment of where Australian politics is at the moment. -
shoyemore at 23:31 PM on 21 July 2012The Mid-Wales floods of June 2012: a taste of things to come?
JohnMashey The stream (called a "river" on the maps) heads off towards the Boyne (one of Ireland's major waterways, see Battle of same!), but on the way has flooded back gardens when it is in spate. The local plan is to cut out some meanders and deepen the bed so it continues unvexed to the Boyne. In fact, downstream folks have experienced far more bother than we have. Ok, an innocuous little example, but multiply it by what may be hundreds of cases of housing too close to floodplains or seashores, and tens of thousands across the world, and you have one way climate change will "come home" to people in short order. Incidentally, Matthew Kahn in Climatopolis argues that Governments should not intervene in cases like this and householders in floodplains, or near seashores, should be forced to accept their losses, or pay their own way. To be honest, I have not read the book, just heard the author on video, and I cannot find the link. http://climatopolis.com/?p=2 Kahn's argument is for a completely free-market approach to climate change. -
Rob Painting at 22:48 PM on 21 July 2012Yes, Virginia, There is Sea Level Rise
In the near-term, the concern over future sea level rise is based upon the 65-70 metres of global sea level locked up in the giant polar ice sheets - Greenland and Antarctica, not thermal expansion of the ocean. Greenland & Antarctica are contributing to sea level rise at an accelerating rate. These ice sheets have been essentially stable for the last 7-8000 years and only began to melt/disintegrate in the late 20th century. Global sea level rise in the 20th century was anomalous within the context of the last 7-8000 years.
Certainly there are other factors to consider in North Carolina - for one it is an area that was uplifted by the presence of the gigantic Laurentide ice sheet during the peak of the last ice age. The ice sheet is long gone, but the Earth is still responding to the change in loading - hence the subsidence going on along the North Carolina coast today.
The trends in the global sea level satellite data (the last two decades) are consistent with the ocean heat content data (cooling between around 2004-2008), which is itself consistent with the solar dimming trend in the Southern Hemisphere, and the cooling phase of the 11-year solar cycle.
The Earth has an energy imbalance, so it will continue to warm and sea level will continue to rise. Whether it will accelerate in the next few years remains to be seen, but unless reflective sulfate aerosols increase, it seems likely to.
These ice sheets have been essentially stable for the last 7-8000 years and only began to melt/disintegrate in the late 20th century. Global sea level rise in the 20th century was anomalous within the context of the last 7-8000 years.
Certainly there are other factors to consider in North Carolina - for one it is an area that was uplifted by the presence of the gigantic Laurentide ice sheet during the peak of the last ice age. The ice sheet is long gone, but the Earth is still responding to the change in loading - hence the subsidence going on along the North Carolina coast today.
The trends in the global sea level satellite data (the last two decades) are consistent with the ocean heat content data (cooling between around 2004-2008), which is itself consistent with the solar dimming trend in the Southern Hemisphere, and the cooling phase of the 11-year solar cycle.
The Earth has an energy imbalance, so it will continue to warm and sea level will continue to rise. Whether it will accelerate in the next few years remains to be seen, but unless reflective sulfate aerosols increase, it seems likely to.
-
RonManley at 20:43 PM on 21 July 2012Yes, Virginia, There is Sea Level Rise
From the clip it appears that the century rate of sea level rise on the Virginia coast has been around 200 mm (8”), the same as globally, but compounded by an equivalent amount of land settlement. The global 20-year rate of sea level rise was 1.8 m/year in 1892, fell to 0.0 in 1934, rose to 3.2 in 1963, fell to 1.0 in 1978, rose to 3.6 in 2005 and is currently 3.2 mm/year and falling. The change in rate of rise follows a similar pattern to the AMO but lags it by a decade or so. The data suggest that the change in the rate of sea level rise is +0.014 mm/year². If the decline in the rate of sea level rise following the 2005 peak is similar to that following previous peaks, and taking into account the accelerating rate of rise, then the rate of rise might continue to fall to around 2 or 2.5 mm/year. I realise that a lot of this discussion is about whether to extrapolate from past data or rely on the projections AOGCMs. Whilst the data do show an underlying acceleration in the rate of sea level rise it is less that the models project. -
Bernard J. at 18:18 PM on 21 July 2012Vision Prize Results
I've just done something that I have not done for a long time, and read the Wattsian comments on Dana's first link at #11. Big mistake. I despair for humanity, if that mob is representative of the lay community. What does it say about us, that educated and trained people understand the universe in one way, and so much of the laiety crowd in layers on top of each other at the opposite side? I sincerely hope that the Vision Prize organisers have the presence of mind to purge their surveys of the contamination introduced by Watts. -
JohnMashey at 17:45 PM on 21 July 2012The Mid-Wales floods of June 2012: a taste of things to come?
shoyemore: Hopefully, folks understand what happens downstream when you build stronger flood walls upstream. -
Bernard J. at 17:05 PM on 21 July 2012Vision Prize Results
Dana1981 at #11: Watts appears to be demonstrating a serious case of inability to understand context. The Vision Prize is clearly targetted at a particular (expert) grade of professionals trained in climate change science, and yet Watts takes umbrage at the fact that there is an assessment process to weed out non-qualified attempts to sign on.It will be interesting to see if they are biased or open and whether I get to join the “players”. I urge WUWT readers to sign up and report your acceptances or rejections below.
Why does he think that any joe from the streets should be allowed to contaminate the responses? The point is to garner an understanding of the opinions of the best-informed people in the world, and not from people who not only have no understanding, but who are actively motivated to oppose the directions and implications of reasoned understanding. As I noted in a post at Tamino's, to hold this perspective of what constitutes reasonable behaviour one would require a total absence of shame. -
KR at 08:50 AM on 21 July 2012The GLOBAL global warming signal
Kevin C - I would be curious as to behavior of the various techniques with hold-out checks: choose a sparse set of hold-out stations, run the spline/kridging/nearest neighbor with cutoff methods, and see just how close they come (and with what bias) to the hold-outs. How hard would that kind of analysis be? -
Lambda 3.0 at 06:58 AM on 21 July 2012Esper Millennial Cooling in Context
Esper ran both MXD as well as TRW on the samples (as well as early width and density). They show not late diversion problem (post 1960). However, in figure S6 in the supplementary information, there is a huge divergence from the beginning of the data until after 900AD. This divergence is not discussed in the paper, unless I missed something. What might this indicate? Another potential nit is from figure S10, where the correlation between the instrument record and the tree rings breaks down completely circa 1910 (looks like 1911 to me, but these are 15 year running averages). Volcanic eruptions from that time seem unremarkable (see here), though 1911 was noted for an extreme weather event in November in the US midwest (the great blue norther). Esper notes the breakdown, but does not attempt to explain it or indicate what it means to the reliability of the proxy record. Anybody know a enough about dendroclimatology or tree biology to shed some light here? (I was unable to find an SkS article dealing with the reliability of tree-ring proxy techniques, beyond the divergence problem. It is being attacked on the typical fake skeptic sites, so an article may have value.) -
Kevin C at 06:54 AM on 21 July 2012The GLOBAL global warming signal
OK, I've got Kriging working. It's not very much slower than splines. Interesting results: The Kriging results look very similar to nearest neighbour with a 1200km cutoff. I sort-of expected that from the theory, but the agreement is really quite good. Kriging gives global coverage, but as you move further away from the nearest observed cell, the weights for all the cells in the map approach equality - in other words, cells very far from any observation get set to the average of the observations, which is the same as leaving the cell unobserved. And it happens automatically. (Actually, this does depend on being able to solve the complete system of equations. BEST can't do this, because they are dealing with individual stations, not a coarse grid, so instead they impose a distance cutoff like GISTEMP in order to obtain a sparse matrix.) That also means that the GISTEMP 1200km kernel smoothing should give results fairly close to Kriging. Also, the divergence shown in Had4s in #9 before 1960 is an artifact of the spline extrapolation. The splines work well when coverage is good, but once you go back far enough to lose the Antarctic stations the spline method starts giving erratic. Unlike Kriging, the splines will generate more extreme values as the extrapolation distance increases. -
Alexandre at 06:42 AM on 21 July 2012Esper Millennial Cooling in Context
WheelsOC at 04:21 AM on 21 July, 2012 I understood it the same way as you did, like on Jim's inline response here: Relevant part below: They make nothing of that issue, barely even mentioning it in passing, and then never again. It's likely a fortuitous result, possibly related to use of density data and possibly not, but not one that is new--there have been numerous studies in which divergence at decadal scales was weak or absent.
Prev 1118 1119 1120 1121 1122 1123 1124 1125 1126 1127 1128 1129 1130 1131 1132 1133 Next


