


 Arguments


Recent Comments
Prev 1147 1148 1149 1150 1151 1152 1153 1154 1155 1156 1157 1158 1159 1160 1161 1162 Next
Comments 57701 to 57750:
-
DSL at 14:53 PM on 20 June 2012Glimmer of hope? A conservative tackles climate change.
Total agreement, TC. Having the same conversation on several threads around the nets. I'm probably considered "progressive" by people who feel the need to label me. Even so, when I read the Fumento piece, I felt some sort of weight lift from my shoulders. -
Tom Curtis at 14:16 PM on 20 June 2012Glimmer of hope? A conservative tackles climate change.
pa32r @25, I come from a very different political perspective to either you or Daniel. However, I absolutely agree that the key issue here is whether or not you are guided by the science or not. I would gladly accept a conservative response to climate change, so long as it was an effective response; and am very happy for conservatives such as you, Daniel, Barry Bickmore and Richard Alley to have a voice. -
Tom Curtis at 13:56 PM on 20 June 2012Simply Wrong: Jan-Erik Solheim on Hansen 1988
Bill, haven't you heard of a "Straw Nit" fallacy before ... -
Daniel Bailey at 13:46 PM on 20 June 2012Glimmer of hope? A conservative tackles climate change.
"Anyway, my point is that there are people of a conservative frame of mind who are not enemies of facts."
As a conservative American who contributes to this forum, I felt your comment resonated with me. I hold many of the "classical" conservative values you mention dear yet differ from those Republicans I get classified (by default) with for much the same reasons as you."One would think that the readership of SkS would regard that as a good thing."
I do. Keep posting. -
pa32r at 13:17 PM on 20 June 2012Glimmer of hope? A conservative tackles climate change.
It's interesting to read the comments. I've blogged myself that I'm philosophically very aligned with "small l libertarianism" but that philosophy must yield to the realities of the limits of a finite planet in terms of resource depletion and self-poisoning (of which climate change is one, but not the sole, example). I'm also conservative in a classical sense of conserving natural resources, financial wherewithal, personal responsibility, the rights enshrined in the Bill of Rights, etc. I've also blogged that I'm most embarrassed, when describing myself as conservative, to be associated with today's Republican party and the so-called conservative mouthpieces. I've got a post entitled "I used to be a Republican," which I did. Of course, I ended that post with "But don't mistake me for a Democrat." Therefore, I'm a bit taken aback by comments from such as ralbin who would, I believe, write such as me off when I contrarily think "my type" is, in a sense, key to our chances. Anyway, my point is that there are people of a conservative frame of mind who are not enemies of facts. One would think that the readership of SkS would regard that as a good thing. -
bill4344 at 12:37 PM on 20 June 2012Simply Wrong: Jan-Erik Solheim on Hansen 1988
It appears that rather than addressing the meat of the post, poodle is trying to pick nits, but his nits are made of straw.
I completely agree, but I'm afraid I will have to arrest you for Crimes Against Metaphor... ;-) -
Neven at 09:42 AM on 20 June 2012Arctic sea ice takes a first nosedive
Thanks for that link, Sphaerica. That's a better explanation than I could ever come up with. -
Neven at 09:38 AM on 20 June 2012Arctic sea ice takes a first nosedive
The T stands for Tief, I believe, which is German for Low. Looking at the SLP numbers also helps. Anything above 1013 millibar or hPa is high-pressure system, below is low-pressure. So when from one isobar (the white lines) to the other the pressure goes up (for instance from 1015 to 1020 to 1025, etc) there's a high-level pressure system there. I don't look at the letters and colours too much, mostly the numbers and the shape of the isobars (telling me the direction of the wind). Again, it's very crude, but it works reasonably well. Highs on the Canadian side of the Arctic, and lows on the Siberian side, also known as the Dipole Anomaly, make the Beaufort Gyre gyre, the Transpolar Drift Stream drift. The ensuing ice transport, combined with clear skies and eventually pulling in of warm Pacific waters through Bering Strait (as happened in 2007), makes for the fastest ice decrease in summer. -
Bob Lacatena at 09:33 AM on 20 June 2012Arctic sea ice takes a first nosedive
shoyemore, This explanation of how to read such maps is helpful (armed with T = low and H = high). -
Bob Lacatena at 09:29 AM on 20 June 2012Arctic sea ice takes a first nosedive
shoyemore, I don't speak German, but from this I would guess that T is for trog (low pressure) while H is for hoch or hochdruck (high pressure). GPDM is short for geopotential decameters, while bodendruck is "pressure". -
shoyemore at 08:05 AM on 20 June 2012Arctic sea ice takes a first nosedive
Neven, Thanks, can you explain those Wetterzentrale maps, please? What does T mean? I presume H is high pressure, and the colour is the pressure gradient. Not knowing German makes it difficult. I see Ireland has a massive gloomy spot over it. That figures - national team dumped unceremoniously out of the European Cup (soccer) with nul points. -
dana1981 at 06:40 AM on 20 June 2012Simply Wrong: Jan-Erik Solheim on Hansen 1988
poodle, the troposphere is the lowest layer of the atmosphere. KR - I believe poodle's point is that there exists a data set with a certain smoothing for which the data around 1998 is hotter than the subsequent data. However, that argument is a strawman, because nobody said anything to the contrary. The above post correctly noted that there is no data set for which 1998 is hotter than subsequent years when a 5-year running mean (which Solheim claimed to apply) is used, as you show in your link (also linked in the post). It appears that rather than addressing the meat of the post, poodle is trying to pick nits, but his nits are made of straw. -
vrooomie at 06:13 AM on 20 June 2012Arctic sea ice takes a first nosedive
CBD@4: I *especially* love your subtle use of humor, in your post, by using the future tense; "will be." "...insanity will be pretty much all that is left for 'skeptics' at that point." Ar ar....{;=P -
KR at 05:44 AM on 20 June 2012Simply Wrong: Jan-Erik Solheim on Hansen 1988
thepoodlebites - Looking, as you suggest, at the WoodForTrees data (with a 60 month running mean, as per the actual discussion here), not even the RSS data shows 1998 as the peak anomaly, let alone UAH. So no, 1998 is not the peak year in either surface or lower tropospheric temperature data 5-year averages. Clearly, Solheim was not using a 5-year uniform mean filter; perhaps a Loess smooth, a tapered mean, or a shorter period? My best reconstruction of his graph is actually with an approximately 13-month running mean. At the very least he has poorly labeled/explained his data. Now - What point were you trying to make? -
Neven at 05:43 AM on 20 June 2012Arctic sea ice takes a first nosedive
The NSIDC has an extra June update explaining the recent nosedive. -
Neven at 05:01 AM on 20 June 2012Arctic sea ice takes a first nosedive
@ shoyemore I notice that JAXA seems to have revised downwards the big breaks they were posting for the past few days, and the Arctic Oscillation has turned positive. You can disregard that latest data point that JAXA reports. It's very low every day, and then gets revised significantly the next day. I don't use it for the ASI updates. Here's another tip with regards to that last bit about weather patterns: If you go to the ECMWF weather forecast on Wetterzentrale you can click on N-Hem. and then the daily forecasts (24h, 48h, 72h, etc) at 500 hPa. This allows you to see a couple of days in advance where the highs and lows are going to be. In 5 to 6 days that low that is dominating right now, is forecast to get pushed back again, with highs taking over the Canadian Archipelago and part of the Beaufort Sea. I'd like to be cautious, but if this comes about, there could be some more big drops keeping 2012 in the driver's seat. We'll see. A 6 day forecast can change from day to day. -
thepoodlebites at 04:52 AM on 20 June 2012Simply Wrong: Jan-Erik Solheim on Hansen 1988
10 dana1981 What's the difference between a lower troposphere temperature data set and a lower atmosphere data set? Why not say "which is not true of any surface temperature data set" and leave "or lower atmosphere data set" out of the sentence. What do you mean by "lower atmosphere data set"? -
CBDunkerson at 04:09 AM on 20 June 2012Arctic sea ice takes a first nosedive
Bernard, actually when the ice disappears I'm quite confident that the skeptic response will be, 'So what? Everyone knew that was going to happen. It is perfectly normal. Happened back in the 1930s too. Natural cycle. Look, e-mails!' All of which is, of course, completely insane... but insanity will be pretty much all that is left for 'skeptics' at that point. BTW, the first 'SEARCH' ice extent predictions for the year have been released. These were submitted prior to the recent rapid decline, but all predictions (even Watts) are for far below normal September extent. PIOMAS is also showing the same sharp drop in volume anomaly (i.e. the volume decline is much greater than average) starting in May which has characterized the past few years. What we've been seeing with extent and area in June suggests that this volume trend is continuing. -
dana1981 at 03:58 AM on 20 June 2012Simply Wrong: Jan-Erik Solheim on Hansen 1988
poodle - first of all, 13 months is not 5 years. Secondly, UAH is a lower troposphere temperature data set, not a surface temperature data set, and the Hansen 1988 projections were of surface temps. Third, 1998 is only hotter in UAH because El Nino is amplified more in atmosphere than surface temps (hence you shouldn't be comparing the two). -
MP3CE at 03:57 AM on 20 June 2012Arctic sea ice takes a first nosedive
Worth to mention here, but Tamino has also posted on his blog about Arctic Sea Ice: http://tamino.wordpress.com/2012/06/17/sea-ice-update/Moderator Response: [Sph] Hot linked. -
L. Hamilton at 03:54 AM on 20 June 2012Scientific literacy and polarization on climate change
That's a well-known pitfall for survey research, called "response set bias." It's something to always keep in mind when designing a survey, or when looking at data from a survey designed by others. My "just right" example above, for instance, has been carried on two different surveys, neither of which said another word about ice or polar regions. Despite different samples (one statewide and one national) and otherwise mostly different questions on each survey, they produced similar results. These conclusions I'm talking about are pretty robust. -
Eric (skeptic) at 03:40 AM on 20 June 2012Scientific literacy and polarization on climate change
L. Hamilton, thanks for the details. I agree the second question is just right and a "no brainer". My only quibble with the observation in your last sentence is that those similar correlations may come from the respondent's view of the questions as a whole. Will the respondent answer in "contrarian" ways because some questions (not your latest example but the prior one) appear oversimplified? If that is the case then the correlation is not from respondent qualities to each question but from respondent qualities to the whole set of questions. -
adamski5807 at 03:25 AM on 20 June 20122012 SkS Weekly Digest #24
Feeling so helpless and useless at the moment. Quite depressing. Did you guys read this?? Game Over For The Climate? 'Whatever happened to the green movement? It’s been 50 years since the publication of Rachel Carson’s classic Silent Spring, a powerful book about the environmental devastation wreaked by chemical pesticides. Since then we’ve had the rise and fall - or at least the compromised assimilation - of green groups such as Friends of the Earth, Greenpeace and Forum For the Future. Last week, the Independent marked the half-century with a well-meaning but frankly insipid ‘landmark series’ titled ‘The Green Movement at 50’. But there’s a glaring hole in such coverage; and, indeed, in the ‘green movement’ itself: the insidious role of the corporate media, a key component of corporate globalisation, in driving humanity and ecosystems towards the brink of destruction" http://www.medialens.org/index.php?option=com_content&view=section&layout=blog&id=1&Itemid=50 -
Bernard J. at 02:19 AM on 20 June 2012Arctic sea ice takes a first nosedive
Back in the day when frosts were common here*, I used to watch the frozen puddles go from being almost completely sheeted in ice to clear water in just a matter of minutes, once the mornings had warmed sufficiently. So it will be, I predict, that Arctic summer sea ice extent will appear to be still 'relatively' high for some small number of years into the future, but following a few warm summers that summer sea ice will spectacularly disappear - like the thinning ice used to do on the puddles on the west side of my house. Of course, anyone who follows Arctic sea ice volume (or thickness) rather than area/extent will not be caught off-guard, but I am sure that come the time there will be loud brays of faux surprise from those who currently claim that there's nothing more happening than a breezy shifting of a few burgs. [*Prior to the last decade it was usual in my area to have had by this time of year, as the austral winter approaches, about a dozen or so of of those teeth-setting crunchy frosts. So far this year we've had nothing even remotely resembling ice. There have been other changes too - to avoid going off-topic, I'll just note that I commented about them on Deltoid's June Open Thread, at tmie-stamp June 15, 12:57 pm.] -
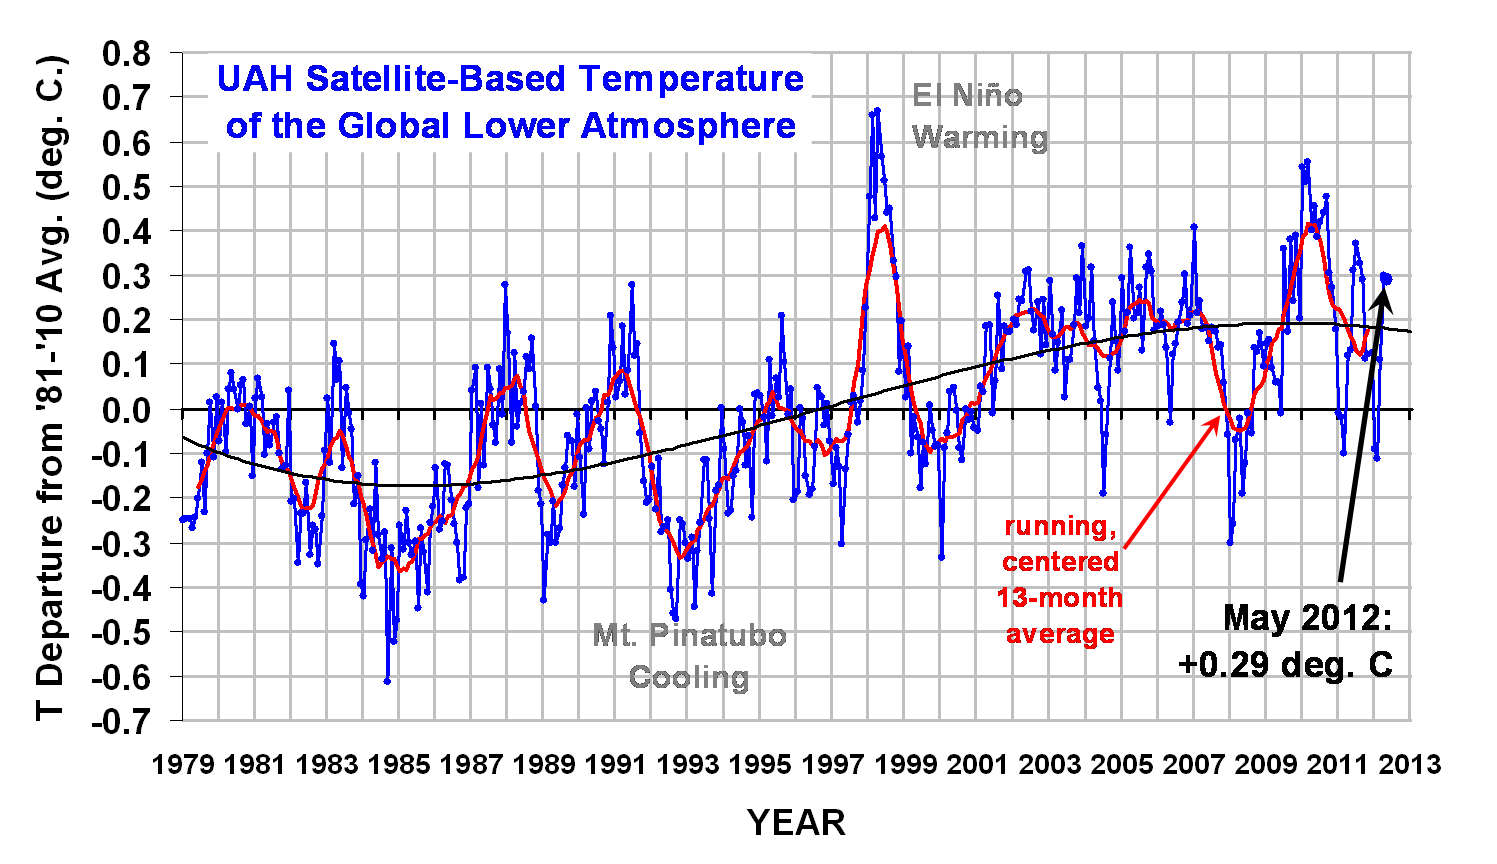
thepoodlebites at 02:02 AM on 20 June 2012Simply Wrong: Jan-Erik Solheim on Hansen 1988
For Figure 2, the above statement "His plot shows the purported 5-year running average temperature around 1998 as hotter than at any later date to present, which is not true of any surface or lower atmosphere temperature data set" contains a link to a "woodfortrees.org" plot. But if you use Roy Spencer's website, the 13-month running mean clearly shows that 1998 and 2010 are tied (+0.4)C. So the assertion that 1998 was not hotter than at any later date is a bit misleading. Both 1998 and 2010 were peaks in global averaged temperatures in response to El Nino events. -
vrooomie at 01:42 AM on 20 June 2012Glimmer of hope? A conservative tackles climate change.
Lloyd@17, truer words I have not seen written here. I am usually fairly centrist, with a left-leaning tendency on social issues. The "right" has taken upon itself as a Crusade, to be against *anything* the "left" are for, irrespective of its basis in fact. As an earth scientist (geologist) with a strong interest in climate change, I find it increasingly and frustratingly difficult to use reason and logic with any denier. "I think conservatism [in the USA] has become obsessed with attacking the left and will attack most things that the left supports just because the left supports them. Libertarianism is threatened by the market not having an answer to AGW and hence is looking for reasons to believe it does not exist. Denialism is a club created by libertarians that has been enthusiastically adopted by many conservatives as something to beat the left with. With the libertarians the matter is what they are protecting. With conservatives it is part of the general attack on the left." -
Adam C at 01:40 AM on 20 June 2012Simply Wrong: Jan-Erik Solheim on Hansen 1988
He lost me at "150% wrong". There's no evidence of scientific literacy there at all. -
shoyemore at 01:25 AM on 20 June 2012Arctic sea ice takes a first nosedive
Neven, Great post & blog. I notice that JAXA seems to have revised downwards the big breaks they were posting for the past few days, and the Arctic Oscillation has turned positive. You have provided an excellent answer to the question I was going to ask! -
John Hartz at 01:20 AM on 20 June 20122012 SkS Weekly Digest #24
Note: This thread is now open to a discussion of the ongoing Rio+20 Conference . -
dana1981 at 01:09 AM on 20 June 2012Hansen 1988 Update - Which Scenario is Closest to Reality?
poodle - forcings are independent of climate sensitivity. The actual forcings are based on GHG concentration observations, linked in the Figure 3 caption. I suggest you read the Solheim post because the concepts you are confused about are explained more there, particularly in the last section. -
L. Hamilton at 23:35 PM on 19 June 2012Scientific literacy and polarization on climate change
"But to my eye the presence of a number of simplifications implies the possibility of oversimplification." Eric, survey questions have to be simplified, though it's a matter of degree. To my ear this question is too simple: 'Would you say the polar ice caps have gotten larger or smaller over the last 25 years?' whereas this one is just right: 'Which of the following three statements do you think is more accurate? Over the past few years, the ice on the Arctic Ocean in late summer ... Covers less area than it did 30 years ago. Declined but then recovered to about the same area it had 30 years ago. Covers more area than it did 30 years ago.' But either one correlates with respondent knowledge, politics and background characteristics in very similar ways. -
L. Hamilton at 23:23 PM on 19 June 2012Scientific literacy and polarization on climate change
"What would be really interesting would've been to divvy the group up into quartiles for example, to see if scientific literacy correlated differently with the understanding in "the middle" of the political spectrum...In fact I'm sure they could've done that though I dont' see it on glancing through the paper." I just noticed the lead-off question by Utahn; it seems worth mentioning that's exactly what Figure 1 in our paper does. -
thepoodlebites at 22:49 PM on 19 June 2012Hansen 1988 Update - Which Scenario is Closest to Reality?
What exactly are the "Actual" forcings based on in Figure 3? What climate sensitivity to CO2 doubling are you using, 3C? My point is that the satellite-based observations are clearly not following Hansen's Scenario A or B, even falling below Scenario C through May 2012. The empirical evidence suggests that model-predicted forcings are too high. (-snip-).Moderator Response: [DB] Moderation complaints snipped. -
curiousd at 21:50 PM on 19 June 2012Lessons from Past Predictions: Hansen 1981
Hello All, Thanks for all the help, everyone! I now have a glimmer of understanding. The idea of a "transient response" due to the ocean to even an apparently short term feedback (such as keeping the relative humidity constant) is crucial. And then on top of that you also have long term effects such as the ice albedo thing which will take much longer. I will next focus more on understanding the recent work where Hansen - I guess - takes the ancient record and obtains the climate sensitivity by fitting the old data. It is now conceivable to me that the fact that they got basically the same sensitivity with the 1981 model was slightly fortuitous, but probably only slightly. -
Bernard J. at 20:35 PM on 19 June 20122012 SkS Weekly Digest #24
The thing with "sustainable development" in natural systems, especially if they're living systems, is that at some point the "development" involves a greater or lesser degree of senescence. At the system level, development (which is analogous to complexity) is asymptotically constrained by energetic input into the system. -
Eric (skeptic) at 19:15 PM on 19 June 2012New Research Lowers Past Estimates of Sea-Level Rise
scaddenp, technological progress is always speculative but it is always inevitable. I'm not sure how you can make a thermodynamic argument because as you know, it is chaotic system control problem. The "stability" of the circumpolar circulation is more of a persistence than a stability. The presence of these lows: http://ams.confex.com/ams/pdfpapers/20231.pdf means that natural changes and/or GHG responses are starting to affect the weather and weather control can help that along. As this paper shows http://soap.siteturbine.com/faculty/faculty_files/publications/1082/Kreutz_JGR_2000.pdf the Amundsen Sea low is currently the dominant feature for much Antarctic weather and moisture flux (as opposed to the Antarctic high). The rest of Antarctica will require transitory lows to penetrate the otherwise persistent (not stable) circumpolar flow.Moderator Response: [DB] This line of discussion has digressed and is OT for this thread. Please find one of the solution threads if you wish to continue this. Thanks! -
scaddenp at 12:03 PM on 19 June 2012New Research Lowers Past Estimates of Sea-Level Rise
Just for further clarity - my understanding of the speculative bit was that some large-scale processes (eg hurricane formation, monsoon path, maybe even ENSO timing) ultimately stem from small bification in chaotic system. However, much of climate is large-scale stable phenomena, bound by thermodynamic constraints. Eg changing timing of an ENSO event might be possible but not holding one back. The circumpolar system would another major stable system. The high pressure systems sitting on the poles are there because its cold, just as low pressure system dominate the tropics. No interference with dynamical systems can change this. -
scaddenp at 11:54 AM on 19 June 2012New Research Lowers Past Estimates of Sea-Level Rise
Wild speculation about what might be possible in the future without a single line on the thermodynamics does not translate into "a reason not to worry about sealevel". You assumed "control" of micro processes would allow you violate that thermodynamics boundary conditions which I dont think the author implies at all. Inferring from that discussion that it was "inevitable" to gain weather control, is frankly amazing. The science paper discusses that increasing precipitation (from warming) was increasing snow cover, but as it turned out from the GRACE measurements, the paper was also wrong. There is already increased ice loss from edges, so you have net ice loss. If you want increased precipitation, then you have to move more warm moist air onto Antarctica from surrounding ocean. Where is most of that going to precipitate? Gains would be a passing phenomena only, especially if that precipitation starts falling as rain (making it a effective heat transfer mechanism) eg reported here. I didnt ask my usual question, as it is clear that a heatpump of the magnitude required (the only solution that make thermodynamic sense) would be fundable by the only by those responsible for the emissions. -
Bob Loblaw at 11:48 AM on 19 June 2012Lessons from Past Predictions: Hansen 1981
curiousd: First, I'd like to say that your process of asking questions and trying to sort out answers is highly encouraging, and I wish more people that come here to ask questions did it in this manner. The help that you are receiving is an example of the kinder, gentler reaction that people get from the regulars here when they are really interested in learning. ...but to get back to Hansen 1981... I think there is a bit of confusion when Hansen et al talk about different models. In essence, they are really just using one model, but they are making different assumptions in doing simulations with the model, which lead to (slightly) different results. The model that they use is a one-dimensional radiative-convective model, and it might help to read the early descriptions of such models, examples of which are in these papers: Manabe and Strickler, 1964. Manabe and Wetherald, 1967. These papers give a much more detailed description of what is in such a model, including examining many of the assumptions that Hansen et al make in looking at model sensitivity. To try to explain a bit more, with regard to the points you make in #40: a) the main purpose is to examine the effect of changing C02, and it is possible in a model to alter CO2 and prevent the model from changing anything else that would classify as a "feedback", so that is how the CO2-only sensitivity is determined. b) a radiative-convective model does not contain a water cycle, so it cannot dynamically determine an appropriate atmospheric water vapour content independently. Consequently, an assumption is required. One assumption would be to hold water vapour constant (i.e., no feedback). Manabe and Strickler covers this. Manabe and Wetherald extended this work to cover the case of keeping relative humidity constant, which leads to increasing absolute atmospheric humidity as the temperature rises (i.e., feedback is present). The assumption of constant relative humidity is reasonable, and many more sophisticated models and subsequent measurements in the past 30 years support this as a good approximation. c) the moist adiabatic lapse rate relates to the rate at which temperature decreases as altitude increases in the troposphere. A radiative-convective model does not include directly-calculated atmospheric motion (it's only one-dimensional!). The models details are in the radiative transfer calculations, but if that was the only thing done, then the model would have an extremely high temperature gradient in the lower atmosphere - unrealistic. Look at Manabe and Strickler's figure 1. A radiative-convective model compensates for this by doing a "convective adjustment" to reduce the gradient to something close to real observations, assuming that convection (vertical mixing) will be doing the required energy transfer to overcome the extreme radiation-drive gradient. Hansen et al's "model" 1 and 2) used the normal observed atmopsheric lapse rate of 6.5 C/km (i.e they force the model to match this), while simulations with the "moist adiabatic lapse rate" (MALR) let the model's lapse rate vary a bit. The MALR is the rate at which rising air cools when condensation is occurring (which releases energy and slows the cooling), and it varies slightly with temperature (feedback!). You can read more about lapse rates here: Lapse Rates Manabe and Strickler, and Manabe and Wetherald give more discussion of this, too. d) [although you didn't call it d)] Cloud heights. Again, a radiative-convective model does not include dynamics that will allow it to calculate clouds independently. Clouds are there as objects with optical properties, and specified altitudes. Under a changing climate simulation, you can leave them as-is (no feedback, Hansen's models 1 and 2), or you can make assumption about how they will move or change - e.g., assume they'll form at a new altitude with the same temperature as before (generally higher) (Hansen's model 4), etc. All these assumptions will lead to the model(s) having different sensitivities. Hansen did include albedo changes in models 5 (snow/ice) and 6 (vegetation). -
Eric (skeptic) at 11:34 AM on 19 June 2012New Research Lowers Past Estimates of Sea-Level Rise
scaddenp, your definition of catastrophic SLR seems reasonable. This idea is not a reason to "do nothing" but one reason among others not to worry about sea level. The paper shows positive ice mass without any intervention, not what you describe. I don't describe this as hope but the inevitable complete control of nature from macro to micro. The question you would normally ask me is who pays for these measures. Part of my answer is here but admittedly will work better for CCS than weather control. -
scaddenp at 10:38 AM on 19 June 2012New Research Lowers Past Estimates of Sea-Level Rise
Eric, this would have to be the most extraordinary display of hope that I have every seen. None of the required technologies are even on the horizon so why do you believe that could happen before "catastrophic sea level" rise. (I'd define sealevel rise of 10mm/yr as catastrophic - what is your definition?). Furthermore, the idea that moving precipitation to Antarctica also means that you are moving heat to Antarctica as well. The isolation of Antarctica by circumpolar ocean and atmospheric currents is what is keeping it cold. You could get short term growth in central regions and even faster loss on the margins. The smart strategy is hope something good helps but act on the basis of what is likely. You cant be seriously proposing this as a reason for doing nothing? -
Eric (skeptic) at 09:45 AM on 19 June 2012New Research Lowers Past Estimates of Sea-Level Rise
To mitigate sea level rise (possibly completely) we just need to control the weather to dump moisture on the Antarctic ice sheets like nature does http://www.sciencemag.org/content/308/5730/1898.short. Control of weather, e.g. 5G_2002_Weather_Hoffman_February_2002 will happen well before catastrophic sea level rise takes place. This would not mitigate more acidic oceans, etc. -
Eric (skeptic) at 09:01 AM on 19 June 2012Scientific literacy and polarization on climate change
L. Hamilton, thanks for the explanation. I guess the fact that it is just wording in a survey means the questions can be simplified. But to my eye the presence of a number of simplifications implies the possibility of oversimplification. -
Bob Lacatena at 08:33 AM on 19 June 2012Temp record is unreliable
ciriousd, The difficulty is that it is no easier to measure the total radiation differential (energy in, energy leaving, over the entire surface of the earth) than it is to directly measure a "global mean temperature." Beyond this, on any one day the imbalance may be in one direction, then another. In particular, counter-intuitively, while a La Niña appears to cool the planet (global temperatures drop) it is in fact warming the planet (because the total energy level of the system has not actually changed, but the atmosphere is radiating less to space, and therefore warming more quickly). Things are further complicated by the need to translate the energy imbalance (measured in W/m2) to some sort of rate of temperature increase. That's pretty much impossible, because how the energy sorts through the system (air, ocean, ice) is just too complicated. So, I'm afraid your simple 3 step approach does no better than simply proving that the earth is warming. It still comes down to a complex interpretation of complex observations of values that vary wildly over both time and three-dimensional space, and yet must be averaged together to get a coherent set of numbers (and trend). -
Bob Lacatena at 08:28 AM on 19 June 2012Lessons from Past Predictions: Hansen 1981
curiousd, Look at it this way. The direct response of temperature change to a doubling of CO2 is a log function. For every doubling of CO2, you increase the temperature (directly, by CO2 alone) by 1 degree C. This is based on the physics, I believe, but I can't find a straightforward explanation for why. Climate sensitivity has to do with how much extra warming you get per degree of warming from a forcing (in our case, doubling CO2, but you could also get it from the equivalent change in solar output or other factors). That is a linear multiplier. When you talk about climate sensitivity, you are talking about specifically that linear multiplier. Double CO2 --> 1˚C increase direct --> times 3˚C climate sensitivity --> total temperature increase. The two are separate. Doubling CO2 (or increasing solar insolation, or whatever) is a "forcing." This forcing is multiple by feedbacks. How much it is multiplied is known as "climate sensitivity," and while it is useful to put a linear scalar factor on that, the reality is that doing so is a useful simplification of a complex system. -
dana1981 at 07:09 AM on 19 June 2012Simply Wrong: Jan-Erik Solheim on Hansen 1988
MA @6 - I did use the F&R trend of 0.17°C per decade in comparing to the Hansen model-projected warming. Bear in mind this is a very rough climate sensitivity estimate, since we're looking at transient temperature changes right now, but talking about equilibrium model sensitivities. -
curiousd at 05:26 AM on 19 June 2012Temp record is unreliable
Hi, I can think of another approach (possibly) to combating the folks claiming its not getting hotter here on the earth, and to do this for an audience. Has the advantage that you don't have to mess with a bunch of different graphs, contrasting Artic to Antarctic, etc. 1. Actually demo the water going into a funnel with a hole and coming out a stopcock which can be closed slightly (analogous to more CO2). As Hanson point out, and is evident from Toricelli's theorem, the water will slowly rise to a new level until the input flow equals the output flow.I am about to make one of these things. 2. Then I say " Maybe thousands of smart people all over the globe are measuring the energy input coming into the earth ,and also the energy leaving. And guess what? The power coming in exceeds the power going out. Its like the funnel with a larger rate of flow coming in than is going out the hole" 3. Therefore, the temperature of the earth is rising. Q.E.D. Whaddya think? -
KR at 05:14 AM on 19 June 2012Hansen 1988 Update - Which Scenario is Closest to Reality?
thepoodlebites - The discussion here is regarding the Hansen 1988 scenarios, A, B, and C, not the more recent IPCC scenarios. Aside from that, I cannot make out what your objection is. -
MA Rodger at 05:02 AM on 19 June 2012Simply Wrong: Jan-Erik Solheim on Hansen 1988
Should we not be factoring in the ENSO, insulation & volcanic effects (as per Foster and Rahmstorf 2011)? Jan-Erik Solheim's "whopping 150% wrong" pronoucement, show here to be actually "about 40%," would thus shrink further still to something like 20% and also suggesting climate sensitivity is (worryingly) somewhat higher than ~3.0°C. -
dana1981 at 04:55 AM on 19 June 2012Hansen 1988 Update - Which Scenario is Closest to Reality?
thepoodlebites @7 - I don't follow what you're trying to say. There is no Scenario C in the IPCC SRES, and we're talking about Hansen's emissions scenarios here anyway.
Prev 1147 1148 1149 1150 1151 1152 1153 1154 1155 1156 1157 1158 1159 1160 1161 1162 Next


