


 Arguments


Recent Comments
Prev 1243 1244 1245 1246 1247 1248 1249 1250 1251 1252 1253 1254 1255 1256 1257 1258 Next
Comments 62501 to 62550:
-
Chris G at 02:30 AM on 2 March 2012The Certainty Monster vs. The Uncertainty Ewok
Curry's III seemed to me to be an obfuscated way of saying that we don't know anything, or, we don't know enough to make any predictions. We don't have any way of knowing if a coin will come up heads or tails, but we do have considerable knowledge of thermodynamics. If we drill a hole (remove some weight) on the '6' side of a die, we may not be able to predict every roll, but we can predict with confidence that '6' will come up more than it did before. Mike #5, I've had the same thought about time frames for temperatures rather that temperatures within a time frame. Though, I can not argue with the counters that Tom and chriskoz made. My own motivation was driven by my perception that a lot of people seem to think that warming will end at some point, even if BAU continues, and I want a way to make it clear there is no upper limit. At least there isn't one that we care about, because we will pass the point where we can sustain much, if any, population prior to running out of fossil fuels. It is just a matter of when, rather than if, that will happen, if BAU continues. I do have a quibble with the amount of skew in Chris' distribution. It makes sense if the actual warming were only big-O(ln(CO2)), but the feedbacks may make it more linear, at least over the range we care about. Thinking back on Hansen's observation of the increasing coverage of 3-sigma conditions, and looking at the poor harvests that occurred when and where they did, I'm wondering if we can predict a time window when an event like the Russian wheat harvest of 2010 hits a typical agricultural area 1 year in 10 (present day?), 1 year in 5, and so on. -
Tom Curtis at 02:14 AM on 2 March 2012Greenhouse Effect Basics: Warm Earth, Cold Atmosphere
To correct a slight error in my preceding post, the comparison was between two models, not three. -
KR at 02:11 AM on 2 March 2012Radiative Balance, Feedback, and Runaway Warming
My apologies, my previous comment should have been redirected to the Scafetta Widget thread to stay on topic. Please respond re: Scafetta there. -
Tom Curtis at 02:10 AM on 2 March 2012Greenhouse Effect Basics: Warm Earth, Cold Atmosphere
dunc461 @41: 1) The observations where made at 17:34 GMT (ie, 11:34 AM in Texas), on Central Time Zone April 22nd, 1969. The surface temperature was 298 K, as measured by a Nomad buoy. The reason for the slight difference between measured and brightness temperatures is that the emissivity of sea water is not exactly 1. The radiosonde data used to set up the model was recorded 100 km from the satellited observation site, and 26 minutes later. 2) As you are obviously very keen on checking the empirical validation of models, you may be interested in this data from Dessler et al, 2008, which compared Outgoing Longwave Radiation observation by the Ceres satellite with three models. The first graph shows the scatter plot of model predictions against observations for the best performed of the three models. Any point falling on the black line shows a perfect match between model and observation. Across the 134,862 observations, the match between model prediction and satellite observation is remarkable. I really wanted to include this plot with the original article as it is far more telling than evidence than the Conrath observation that I did include. In the end, the ease of comparison between the Modtran output, the validation of the wavelength by wavelength comparison, and the need to keep the post reasonably brief mitigated against it. Never-the-less the knowledge of just one paper making comparisons of over 134 thousand observations, each proving the existence of the greenhouse effect really makes me chuckle whenever I see yet another internet blogger masquerading as a skeptic and saying that nobody has ever observed the greenhouse effect. Caption: Figure 1. Scatterplot of 134,862 measured values of OLR against OLR calculated by the Fu-Liou model, both in units of W/m2. The solid line is the one-to-one line.
And just for good measure, here is figure 2 from the same paper, comparing accuracy of two of the models over a range of latitudes and surface temperatures. It is not just coincidence of circumstance which allows such stunning predictive accuracy.
Caption: Figure 1. Scatterplot of 134,862 measured values of OLR against OLR calculated by the Fu-Liou model, both in units of W/m2. The solid line is the one-to-one line.
And just for good measure, here is figure 2 from the same paper, comparing accuracy of two of the models over a range of latitudes and surface temperatures. It is not just coincidence of circumstance which allows such stunning predictive accuracy.
 Need I say it? Radiative transfer physics is settled science!
3) I cannot provide any experimental data showing that "... all energy absorbed is emitted at the same wave number", because the assumption is false everywhere except in lasers. More importantly, it is irrelevant because no such assumption is made either in models of radiative transfer, nor in my article.
Need I say it? Radiative transfer physics is settled science!
3) I cannot provide any experimental data showing that "... all energy absorbed is emitted at the same wave number", because the assumption is false everywhere except in lasers. More importantly, it is irrelevant because no such assumption is made either in models of radiative transfer, nor in my article.
-
KR at 02:07 AM on 2 March 2012Radiative Balance, Feedback, and Runaway Warming
Jose_X - "The main failure has to do with no reasonable guesstimate for a trend curve going far back. This failure is independent of frequency analysis." I would greatly disagree. There are now about a dozen decent proxy reconstructions of temperature for the last thousand years or so - with no major disagreements. As shown in the comparison here, Scafetta's cycles diverge drastically outside their training interval. They fail in hindcasting, which provides zero evidence that they will succeed in forecasting. Frequency analysis can be helpful in attribution and identification of causal relationships - but it cannot stand alone. You need to follow up by examining the physics. Scafetta performed a very basic frequency analysis on a certain period of one temperature record (not crosschecking against more than one temperature record, incidentally), made some very odd data processing choices (there's a frequency peak at ~4 years, which he does not discuss - but he runs the temperature data through a 4-year smoothing, which eliminates it!), and then fits those frequencies to various astronomic periods without a causal link. That's about as straightforward a case of Correlation without Causation as it gets. Going on the physics, on the other hand (as in Lean and Rind 2008, and in Foster and Rahmstorf 2011), including radiative physics: start with a causal link, examine the time evolution of the forcings for attribution, and from that determine the influence and weighting of various inputs - that has both hindcast and forecast capabilities. And, given that said attributions do account for the evolution of the temperature record given our knowledge of the forcings (within quite small variations), Occam's Razor indicates that invoking mysterious cyclic influences via unsupported linkages is both unnecessary and foolish. -
Bob Lacatena at 02:05 AM on 2 March 2012Greenhouse Effect Basics: Warm Earth, Cold Atmosphere
41, dunc461,...all energy absorbed is emitted at the same wave number...
What do you mean by this? -
Dikran Marsupial at 02:01 AM on 2 March 2012Scafetta's Widget Problems
gallopingcamel You are right to say that for Scafetta to gain any traction he will need to develop a plausible mechanism that can explain not only the correlation, but also the strength of the effect. As it happens, I suspect the correlation is not actually all that good, given the number of unconstrained variables he has to play with. All I can say is "good luck with that!" ;o) However, you statement that the IPCC models are examples of curve fitting is simply wrong. GCMs are physical models, not statistical models. They do have some capacity to be tuned, but they are very constrained in this by having to obey the laws of physics programmed into them. Ever wonder why skeptics haven't made a GCM that can explain the observed climate change without CO2? -
Mighty Drunken at 01:53 AM on 2 March 2012The Certainty Monster vs. The Uncertainty Ewok
CBDunkerson in post #8 said what exactly what I was going to say. I can't resist pointing it out again though... I find Curry has a certain way with words which manages to take simple concepts and shroud them in convoluted wording which makes you wonder what Curry is really trying to say. Is her convoluted writing related to her (convoluted) thought processes as she tries to please the "skeptics" while not throwing away her scientific credibility? She wrote, "Is it “cherry picking” to start a trend analysis at 1998? No, not if you are looking for a long period of time where there is little or no warming, in efforts to refute Hypothesis I." To reword what I think she is saying, "Is it “cherry picking” to start a trend analysis at 1998? No, not if you are trying to cherry pick a period with little warming." You can't scour the data to look for departures from the hypothesis without taking into account all the other data you just overlooked. -
gallopingcamel at 01:53 AM on 2 March 2012Scafetta's Widget Problems
Scafetta has found a strong correlation between planetary motions and short term climate changes. He is all too well aware that he now faces a much harder task. For his theory to gain traction he must develop a plausible mechanism to support his theory. Will he succeed? I for one wish him well as this task may take many years. The IPCC's models are also examples of curve fitting and their predictions will diverge from observations as time rolls by. You complain when Scafetta refines his models yet have nothing to say about the continuing tweaks to the IPCC's models. Here is specific information obtained by comparing leaked AR5 WG1 drafts with AR4. The writer is Alec Rawls in a debate with William (Stoat) Connolley: "I agreed not to quote the AR5 draft, but I did provide a link to the equally ludicrous ratio of 14 to 1 used in AR4. (The exact number is 13.833.) Does Connolley want to call that a lie too? The raw evidence (solar climate correlations vs. CO2 climate correlations) says that the sun is the much stronger driver, yet the IPCC assumes that CO2 has many times the warming effect of solar variation. In for a penny in for a pound apparently. The exact AR5 FOD ratio is 39.857." All of you can check the 13.833 yourselves; it is in the AR4 documents. If you want to confirm the 39.857 number contact me: http://www.gallopingcamel.info/IPCC.htm -
Bob Lacatena at 01:48 AM on 2 March 2012The Certainty Monster vs. The Uncertainty Ewok
SRJ, That's an excellent graphic. Looking at it that way sort of puts an exclamation point on the whole "it's stopped warming" meme, simply by demonstrating how noisy, and yet patterned over the recent long term, the climate has been. -
SRJ at 01:24 AM on 2 March 2012The Certainty Monster vs. The Uncertainty Ewok
# 8 To avoid discussions of cherrypicking, I think a good approach is to fit a local model to the entire time series. That model can then be used to evaluate over which periods the time series show significant changes. And no need to discuss when to start the analysis since all data is used from the time series discussed. Gavin Simpson gives a good introduction to this approach at his blog. The following plot for HadCrut shows in blue which periods had a significant increase: I hope this is not too far off topic.
-
Riccardo at 01:17 AM on 2 March 2012Scafetta's Widget Problems
Volker Doormann inflammatory or insulting personal notes are surely not welcome, please refrain. Actually I didn't exopose any theory neither have you. You have a hypotheses which you failed to support in any scientific sense. But my point, maybe badly expressed in the last paragraph of my previous comment, is that beig the data detrended they could at best account for part of the variability and that I was and still am waiting for proper statistical analisys. Belive it or not, here we tend to talk about science, I mean, the real one. -
Jose_X at 01:08 AM on 2 March 2012Radiative Balance, Feedback, and Runaway Warming
>> For understanding the Venus data and to challenge GHE, I chose to limit to CO2 and generally be on the conservative side. Scrap! I through I had this right. No, actually the "conservative" 1 K step I used makes it easier (not harder) to find agreement with GHE. If I really wanted to test GHE, I would have gone with a larger number. Anyway, the concept was demonstrated: that doubling a trace ghg gives a high bang for buck in terms of warming, while doubling an abundant ghg doesn't do so much extra vs doubling an abundant non-ghg. -
Jose_X at 00:59 AM on 2 March 2012Radiative Balance, Feedback, and Runaway Warming
I didn't expect to have 2 people look up Huffman. Were he the true Mickey Mouse, I'd still want an answer to the pattern. I did think the Venus/Earth pressure-temp example was most likely not new (although maybe it was based on very new astronomical data). KR #75 #76 >> Since CO2 forcings are constantly changing, ENSO, solar, and volcanic forcings are not correlated, Scafetta's work is simply bad statistics. From the limited amount I read and keeping in mind I don't know the state of climate science, I think I came across one positive point but maybe more. The analysis may have identified or refined the understanding of known global cycles. Recognized local cycles (PDO, etc) along with anything else can lead to global cycles not yet studied (for example, identifying resonant planetary frequencies). As evidence that the analysis might be statistically significant, the paper split the 1850-2000 time period into 2 pieces and then showed that tuning to either piece did a reasonable job "predicting" the other. This suggests that over a period of 50-100 years, incorporating cycles tuned from past data may improve the accuracy of one or more existing climate models. [I'd be curious to know how sensitive were the results to the split point date.] The CO2 trends are effectively a conditional prediction (along the lines of IPCC scenarios) that form a necessary part of the procedure. I agree with your comments on the paper otherwise: on the value of physics, on the unsupported conclusions/projections, and on the probable lack of significance of the astrological cycles (although I agree with gallopingcamel that further physics-based analysis might yield fruits). >> When taken outside the 'training period' for his cyclic+quadratic fit, it fails horribly To be fair, models come with limits by definition (although it might be a useless model for making predictions). The main failure has to do with no reasonable guesstimate for a trend curve going far back. This failure is independent of frequency analysis. To illustrate this point of model limits, if we halve CO2 levels in Earth atmosphere just 30 times, the logarithmic predictions used by at least some useful climate models will be wrong since this would result in a temperature noticeably below the simple S-B result for Earth+atmosphere (also calculating some extra loss of temp from H2O vapor reduction and even considering aerosols), incorrectly implying the GHE of remaining amounts of ghg is negative. gallopingcamel #77 Yes, the Earth case would be worse because of H2O and maybe a significant amount of methane and/or something else. For understanding the Venus data and to challenge GHE, I chose to limit to CO2 and generally be on the conservative side. -
dunc461 at 00:33 AM on 2 March 2012Greenhouse Effect Basics: Warm Earth, Cold Atmosphere
Tom Curtis @26 Thank you for your information. I agree that a surface temperature of 23 Degrees C is hardly surprising. But http://www.nodc.noaa.gov/dsdt/cwtg/wgof.html shows water temperatures below 21.6 Degrees for 6 months out of the year. Do you happen to know when the observation was made? Or can you provide an open source of experimental data where the assumption, that all energy absorbed is emitted at the same wave number, is verified? Thanks. -
chris at 00:18 AM on 2 March 2012The Certainty Monster vs. The Uncertainty Ewok
Yes Curry rather misrepresents the work of Swanson and Tsonis by cherry-picking their broad hypothesis about climate shifts without actually considering what Swanson and Tsonis determine via quantitative analysis of temperature series. For example in their 2009 paper on the attribution of 20th century temperature variation Swanson and Tsonis state:"Removal of that hidden variability from the actual observed global mean surface temperature record delineates the externally forced climate signal, which is monotonic, accelerating warming during the 20th century."
and determine that internal variability (their shifting of climate regimes) has made essentially zero contribution to 20th century warming. I don't have a problem with Swanson and Tsonis' hypothesis about climate shifts, and it seems entirely reasonable that changes in ocean current behaviour (as measured for example by changes in the NAO index), might give rise to small effects on surface temperatures variability on decadal time scales. But you can't hijack Tsonis' and Swanson's hypothesis without also making clear Swanson and Tsonis' own conclusions that the effects average out to around zero on multi-decadal timescales and anyway have contributions to surface temperature variability of only around 0.1 oC above and below the mean temperature (see Fig 2 of paper linked to just above). -
CBDunkerson at 23:56 PM on 1 March 2012The Certainty Monster vs. The Uncertainty Ewok
Curry: "Is it “cherry picking” to start a trend analysis at 1998? No, not if you are looking for a long period of time where there is little or no warming, in efforts to refute Hypothesis I." It isn't cherry picking if you select a time period specifically to fit a preconceived notion? Ummmm... what!?! That's the bloody definition of cherry picking. -
CBDunkerson at 23:42 PM on 1 March 2012Greenhouse Effect Basics: Warm Earth, Cold Atmosphere
I've used a more detailed version of the 'pool balls analogy' for global warming previously. Specifically; Imagine balls (photons) moving in a completely frictionless environment on a pool table (the Earth's atmosphere). Since there is no friction they will continue bouncing around until they hit one of the pockets (escape to space). Now assume that additional pool balls (incoming photons from sunlight) are rolled onto the table at a fixed rate. Let's also say that the size of the table and the momentum of the pool balls is such that on average balls leave the table at the same rate that they enter it. Now, if we block off one of the pockets (increase greenhouse gas levels) the balls will initially not be able to escape at the same rate and thus the incoming balls will result in an increasing number of balls on the table (more energy in the atmosphere) which results in more collisions and greater total momentum until eventually the rate of balls exiting the table again equals the rate at which they are entering... just with more balls on the table (higher atmospheric temperatures) at any given time. Thus, no it isn't really the ricochets per se... in this simplified example warming is caused by a change in the rate at which energy escapes the system. That does result in more ricochets, but it is the temporary imbalance between incoming and outgoing rate which is the real issue. -
Tom Curtis at 23:27 PM on 1 March 2012The Certainty Monster vs. The Uncertainty Ewok
Mike @5, because we can predict climate to some extent, but not weather, predictions for temperatures at the end of this century are couched as predictions for mean global temperatures in a given one or two decade period. To then further express uncertainty in temporal terms on top of that would create confusion. -
Tom Curtis at 23:22 PM on 1 March 2012Greenhouse Effect Basics: Warm Earth, Cold Atmosphere
skept.fr @38, within the troposphere, and to a first approximation, and ignoring feedbacks, all altitudes will heat equally. Of course, with that many qualifications the answer is probably not very satisfying. The two most important of the caveats are the spatial (within the troposphere) and the feedbacks. The consequence of increased greenhouse gases at the boundary of the troposphere (the tropopause) will be to warm the lower reaches, thereby lifting that boundary. Above that, in the stratosphere it definitely cools but the reason for the cooling is not certain, and extensively discussed elsewhere on SkS. (Hint: of topic for this thread, but you are welcome to follow the link read the comments and wade in.) Feedback wise, the most important feature is the Lapse Rate Feedback. In the lapse rate feedback, the Lapse rate becomes smaller (smaller decrease in temperature with altitude) due to increased water vapour in the atmosphere, resulting in a warmer upper troposphere relative to the lower troposphere in areas of high humidity, ie, the tropics. Again, extensively discussed elsewhere. All this is arm waving, so it would be better to look at the model predictions: This however also takes us of topic. I would appreciate it if we restrict discussion of the enhanced greenhouse effect, ie, how the greenhouse effect changes with increased GHG to some other thread, or wait till I actually discuss it later in this series.
-
chriskoz at 23:11 PM on 1 March 2012German translation of The Debunking Handbook
Indeed, my guess that "a press attention in Germany triggered that translation" was a silly one. Thanks for your hard work of letting German speaking people know this useful work. -
chriskoz at 22:57 PM on 1 March 2012The Certainty Monster vs. The Uncertainty Ewok
Mike @5, Given the range of uncertainty (predicted dT 2-6K) and the fact that dT is proportional to ln(dCO2), if you want to express your uncertainty as a around a=2100, with dT=4, then you would end up with Piosson distribution. Therefore, the confidence interval would be from say 2060 to 2260 (only roughly, I'm too lazy to calculate it for you), so not a symetric normal distribution as you would think (with your guess of sigma-a of 20). Is there a point in framing temp predictions that way? I don't think so. It can only fuel "skeptic" (==ignorant) thoughts, that "it's not that bad, because it may not happen until 2260 so we have more time". What matters, is how much warming we are commiting to the pipeline (not just immediate but equilibrium warming) and thats dT. It does not matter if a given dT happens in a=2100 or 2260, it's irrellevant (just instant) on the geological timescale. A question of dT itself is far more important, and scientists correctly present AGW problem from that perspective. -
skept.fr at 22:53 PM on 1 March 2012Greenhouse Effect Basics: Warm Earth, Cold Atmosphere
#33 Chris : "However, changes have been in the vertical distribution of how that energy escapes. Specifically, the height of the so-called TAU=1 (an optical depth coordinate) level increases, such that the "mean" level of emission to space decreases in pressure (or increases in height)." #36 Tom : "The most fundamental fact about the greenhouse effect is that if the energy escaping to space exceeds the energy entering the system, then the temperature will rise until they balance again." These two comments bring me to ask a question: the system will warm, but where should it warm? By where I mean at which height? The same point than #19 Bart. It has been answered to Bart that the higher layers of atmosphere will cool rather than warm because of IR trapping near surface (so these higher layers would emit less at T^4 toward outer space). But that is unclear for me, because if we speak of a thermodynamical equilibrium, there are also non-radiative mechanisms on Earth, precisely between surface and troposphere (for example latent heat and wet convection if there is a water vapour feedback). -
Volker Doormann at 22:46 PM on 1 March 2012Scafetta's Widget Problems
Riccardo at 07:13 AM on 1 March, 2012 says: “The sea level data are detrended and retain the seasonal cycle which is what the solar tide function apparently matches. “ Let’s check your theory. There is a science of algebra. From this we can count the number of sea level oscillations in 3 calendar years { http://www.volker-doormann.org/images/sealevel_vs_xyzo.gif } as 19. From astronomy books we can take the frequency of Mercury with 4.15207 [y-1] and the frequency of Earth with 0.9998 [y-1]. The synodic frequency of this couple is f_syn [y-1] = 4.15207 -0.99998 = 3.15209 [y-1]. And because a (solar) tide function is twice the synodic function, because springtides occur as well on conjunctions and also on oppositions, the solar tide frequency of Mercury/Earth is f_sol_tid = 2 x 3.15209 = 6.30418 [y-1]. This means from the logic of algebra that the number of solar springtides from this couple in 3 years counts 3 x 6.30418 = 18.9125 oscillations, mostly equal to the number of terrestrial sea level oscillations in 3 calendar years. In contrast to the (terrestrial) seasonal cycle, which is locked to the frequency of the Earth (http://sealevel.colorado.edu/content/2012rel1-global-mean-sea-level-time-series-seasonal-signals-retained ) , there are only 3 oscillations in 3 calendar years. Conclusion: Your theory is wrong. Personal remark: I read that on this blog science from peer reviewed work is standard. But it seems to me that lacks in simple algebra do not match with that claim. V. -
DrTsk at 22:39 PM on 1 March 2012The Independence of Global Warming on Residence Time of CO2
Also, mass transfer of CO2 to minerals (geologic time), oceans, and biosphere, is first order in CO2 concentration. Therefore, a spike of CO2 will be an exponential decay, a long as the mass transfer coefficient does not change. The adjustment time is the half-life of CO2 in the atmosphere after a spike. The important half-life is the one relating to the ocean sequestration until saturation which is in the order of hundreds of years, assuming emissions of CO2 ended today. -
DrTsk at 22:28 PM on 1 March 2012The Independence of Global Warming on Residence Time of CO2
Why are we keep talking about residence time???? Residence time, only matters when a chemical reaction that changes the identity of a molecule happens. CO2 remains CO2, so residence time has no meaning at all . It does for CH4 since it oxidizes to CO2. Please ignore whoever argues about the importance of residence time and CO2. Dikran, good work!!! It is however, akin showing that the earth is spherical to flat-earthers.... -
Glenn Tamblyn at 22:00 PM on 1 March 2012Greenhouse Effect Basics: Warm Earth, Cold Atmosphere
owl905 The ricochet is a characteristic of the GH Effect But it isn't what defines the GH Effect. If the ricochet is what defines how long it takes a pool ball to leave the table, what is far more important is how many balls are on the table because of that. If one pool ball ricochet's off per second, so what. How many balls does it need on the table to generate that one ricochet per second. -
Dikran Marsupial at 21:06 PM on 1 March 2012The Independence of Global Warming on Residence Time of CO2
owl905 Yes, the C14 issue is quite subtle. The residence time is the average amount of time a molecule of CO2 stays in the atmosphere, and is about 4-16 years regardless of which isotope you look at. However the reason that the residence time is short is because about 20% of the CO2 in the atmosphere is exchanged with CO2 from the oceans and terrestrial biosphere each year. However this is just an exchange of carbon and doesn't change atmospheric CO2 levels at all. The rate at which CO2 levels rise and fall, known as the adjustment time, depends on the difference between natural uptake and natural emissions. This is small compared to the magnitude of the exchange fluxes, which is why the adjustment time is much longer than the residence time, and it is the adjustment time that matters, not the residence time (hence the title of the post). The C14 in the atmosphere is created in the upper atmosphere by the action of cosmic rays on nitrogen. This means that the exchange fluxes replace C14 in the atmosphere with lighter isotopes of carbon, rather than with more C14. This means that C14 analysis only tells you about the residence time, but not the adjustment time. I think that the confusion arises from not appreciating the difference between residence time and adjustment time, and the effects of the vast exchange of carbon between the atmosphere and oceans/terrestrial biosphere. It took me some time to fully appreciate when I first came across this argument. -
Dikran Marsupial at 20:54 PM on 1 March 2012The Independence of Global Warming on Residence Time of CO2
Michael Hauber In the scenario you suggest, where the hypothetical sink were controlling atmospheric CO2 levels, the level would remain near the equilibrium level, rather than rising rather rapidly. However, the main point is that the natural environment is known with high certainty to be a net carbon sink, and hence is opposing, rather than causing, the observed post-industrial increases. Anthropogenic CO2 levels are currently controlled by anthropogenic emissions, the net environmental sink is demonstrably unable to cope with our current level of emissions, so if we carry on at the current rate or higher, atmospheric CO2 levels will continue to rise. If we cut emissions sharply enough that the net environmental sink outstrips anthropogenic emissions, then atmospheric levels will fall. The choice is in our hands. The equilibrium concentration of the ocean is also determined by the difference in partial pressure between the surface waters and the atmosphere, not just temperature. Our emissions have increased the CO2 content of the atmosphere and that has changed the fluxes into and out of the oceans so that the ocean is now a net carbon sink. If someone wants to argue that the rise in temperature is causing the rise in CO2 (e.g. due to ocean degassing) they need to be able to explain why the oceans are so much more temperature sensitive now than they were at the end of the last major glaciation. At that time there was a similar rise in CO2 levels (although much slower) but the change in temperature was about ten times that we have observed since the end of the industrial revolution. "Some more understanding of what Co2 is doing in the ocean is required to rule out natural sources of the Co2 increase." While more understanding is always a good thing, this statement is simply false. If the observed rise were due to natural sources, the annual rise would be greater than anthropogenic emissions, instead of less. This is a simple matter of accounting, and is valid assuming conservation of mass, which seems a pretty reasonable assumption. -
Tom Curtis at 20:21 PM on 1 March 2012Greenhouse Effect Basics: Warm Earth, Cold Atmosphere
owl905 @34, I'm sorry, but you have been had. The "ricochet on the pool table" is irrelevant to the greenhouse effect. The most fundamental fact about the greenhouse effect is that if the energy escaping to spaceexceedsis less than the energy entering the system, then the temperature will rise until they balance again. If the energy escapingis less thanexceeds the energy entering system, temperatures will fall until they balance again. Now, if you imagine a series of pipes, with a tap which will be used to force water flowing through the pipe to take a longer or a shorter route. If you switch from the shorter to the longer route, but maintain a constant flow, there will be no build up of pressure, and the reservoir you are draining will not drain any slower. Analogously, if you introduced GHG to the atmosphere so that energy took longer to reach space, but maintained the same temperature at all altitudes so that the amount of energy being emitted to space was not reduce, you would not warm the surface of the planet. Note: Edited to correct an error pointed out by ribwoods @ 6:50 am of March 3rd below. My thanks to him for picking up on my mistype, and my apology for any confusion caused by it. -
Mike3267 at 20:17 PM on 1 March 2012The Certainty Monster vs. The Uncertainty Ewok
I've always disagreed with the way uncertainty of future temps is framed. Instead of staying if current emission trends continue "there is a 95% chance we will between 2-6 C of warming by 2100" we should say "there is a 95% change we will have 4C of warming sometime between 2080 and 2120" (or whatever the correct time span should be). And I'd guess there is a 95% of 6C between 2120 and 2160. -
Tom Curtis at 20:08 PM on 1 March 2012Greenhouse Effect Basics: Warm Earth, Cold Atmosphere
Coal Geologist @32 and Chris Colose @32, I apologize for my lack of clarity. The full quote in context (which Coal Geologist truncated) is:"That means that the red area itself, which is the upwards radiation from the surface minus the upward radiation to space, is the reduction in energy radiated to space because of the presence of Infra-Red absorbing molecules in the atmosphere. That is, it is the greenhouse effect."
As is evident from the initial part of the first sentence, if discusses modtran diagram above, and refers to the difference between the Infrared radiation from the surface, and the Infrared radiation to space. On Trenberth's diagram, it is the difference between the Surface Radiation (396 W/m^2) and the Outgoing Longwave Radiation (239 W/m^2). Without that difference, there would be a approximately 150 W/m^2 energy imbalance between incoming and outgoing energy which would very rapidly cool the surface to about 255 degrees K (-18 degrees C). Except for the interpretation of what I said, there is little to disagree with in Coal Geologists explanation, and nothing in Chris Colose's. The little I disagree with is saying "...that the greenhouse effect was due to a slowing of the escape of outgoing heat by its absorption and re-emission (so-called radiative heat transfer) by GHGs." Although green house gases do increase the time it takes for energy to go from the surface to space, on average, that of itself will not cause a greenhouse effect. -
owl905 at 20:06 PM on 1 March 2012Greenhouse Effect Basics: Warm Earth, Cold Atmosphere
Coal Geologist 32 - Great post. Whenever I 'get it', the very next article challenges me in a way the could turn 'gets it' into 'been had'. The balance is absolutely right. The missing explanation is the time that 238.5 W/m2 takes before it escapes. Think ricochet on a pool table. That ricochet time defines the Greenhouse Effect. -
skept.fr at 19:17 PM on 1 March 2012The Certainty Monster vs. The Uncertainty Ewok
I think the interesting point is the status of internal climate variability (which is called in the literature "intrinsic", "chaotic" or "unforced" variability) and what it means for surface temperature in transient sensitivity (but not the heat content of the whole Earth system and not for equilibrium sensitivity after a more or less long relaxation time). If we look at a precise prediction, like the regional and global surface temperature in 2100, it is important to cope correctly with such variability. The main point for human affairs seems to be the ocean-ocean and ocean-atmosphere heat transfers, because only oceans can slow or accelerate the surface signal on decadal-to-century scale. -
Riccardo at 18:29 PM on 1 March 2012Radiative Balance, Feedback, and Runaway Warming
galopingcamel "they assume that CO2 is responsible for most of the recent warming" I'm sure you know this isn't true. -
Bernard J. at 18:26 PM on 1 March 2012The Certainty Monster vs. The Uncertainty Ewok
I could imagine Curry's entry into my discipline - biology. Given her current form in climatology, she'd come in with three hypotheses for human reproduction:I. Sexual reproduction hypothesis: Humans have two sexes, each of which produce a specific type of gamete, which come together in the female reproductive tract after intercourse, and which then fuse and go on to develop into a new individual. II. Spontaneous generation hypothesis: offspring develop at random, and with no external influence, within a female's uterus. III: Stork hypothesis: as is widely known by sceptical old wives, biologists are all alarmist about having a bit of fun - babies are brought, bundled in bunny rugs, to fortunate parents via the agency of avian couriers belonging to the family Ciconiidæ.
Each of these three hypotheses provides a different interpretation of the natality attribution and has different implications for 21st century contraception and population management...Response:[dana1981] 'Stork hypothesis' literally made me LOL!
-
owl905 at 18:26 PM on 1 March 2012The Certainty Monster vs. The Uncertainty Ewok
Curry's too busy preaching what sells to study the truth. The ugly factor missed in these analyses is the run-down of the latent cold storage in the system. The Greenland ice sheet has shown huge losses; 95% of the globe's glaciers are in retreat; and PIG in the Antarctic has passed the tipping point. Ask Curry to factor the ice-block melt into her pablum presentations. PIG Adds a New Wrinkle "expected to create an iceberg of about 900 square kilometres." -
Chris Colose at 18:21 PM on 1 March 2012Greenhouse Effect Basics: Warm Earth, Cold Atmosphere
CoalGeologist- Your understanding is quite good. The statement you quote above is not wrong either, though it could be modified to be made more clear that it refers to the instantaneous effect of adding GHG's and not the final effect. The apparent contradiction can be resolved if you interrogate more closely the steps going from perturbation to equilibrium: 1) Suppose first we introduce some extra CO2 into the atmosphere while holding temperature fixed. This is the step where the outgoing radiation to space is reduced. The consequence of this is that if we leave the incoming solar radiation unchanged, more energy is coming into the planet than is exiting. This is the "slowing of outgoing heat by its absorption and re-emission" that you referred to. 2) Because of this the planet warms, and the emission increases to space in order to let that imbalance decay to zero. This is the step that you are talking about. 3) When measured from space, the net result is actually that the outgoing radiation has not changed at all from the initial value once you go back to equilibrium, since it must match the unchanged solar radiation. However, changes have been in the vertical distribution of how that energy escapes. Specifically, the height of the so-called TAU=1 (an optical depth coordinate) level increases, such that the "mean" level of emission to space decreases in pressure (or increases in height). Of course, the height of this surface is really a strong function of wavelength. Note that in my plots in the feedbacks and runaway post, I plotted OLR as a function of temperature. Thus, if you pick any specific temperature (say, 300 K) the OLR is reduced by adding CO2. Look at figure 2 for example in that post. That will always be true because of the absorption by the excess CO2. However, for thermodynamic reasons, this disequilibrium cannot be maintained forever, since it must be accompanied by an increase in temperature. So instead of thinking about the instantaneous effect of adding CO2 as decreasing the OLR for fixed T, you can think of it as increasing the temperature for a fixed equilibrium point (i.e., where the OLR intersects the incoming solar curve). -
gallopingcamel at 17:54 PM on 1 March 2012Radiative Balance, Feedback, and Runaway Warming
KR @74, 75 & 76, As acknowledged in my #68, Scafetta's model is open to the charge of curve fitting as are all the IPCC models. Scafetta understands that the "hard part" is to develop a theory to explain why his model is more than just curve fitting. See my #73. The IPCC models suffer from confirmation bias because they assume that CO2 is responsible for most of the recent warming while ignoring the evidence that 50-80% is attributable to natural causes.Response:[DB] "The IPCC models suffer from confirmation bias because they assume that CO2 is responsible for most of the recent warming while ignoring the evidence that 50-80% is attributable to natural causes."
Unsupported assertion. It is incumbent upon you to now provide links to peer-reviewed articles published in reputable journals that document that the evidence you mentions both exists and that the IPCC has ignored it.
You will be held accountable for the above statement.
-
Sceptical Wombat at 17:50 PM on 1 March 2012The Certainty Monster vs. The Uncertainty Ewok
The thing that really convinces me about the last 15 years is Foster & Rahmstorf's work. By doing a fairly straight forward multivariate regression and removing the effects of solar variation, El Nino and areosols they get a pretty steadily increasing trend for each of the major temperature data sets though there is still some residual noise. Even the noise is surprisingly consistent across the data sets -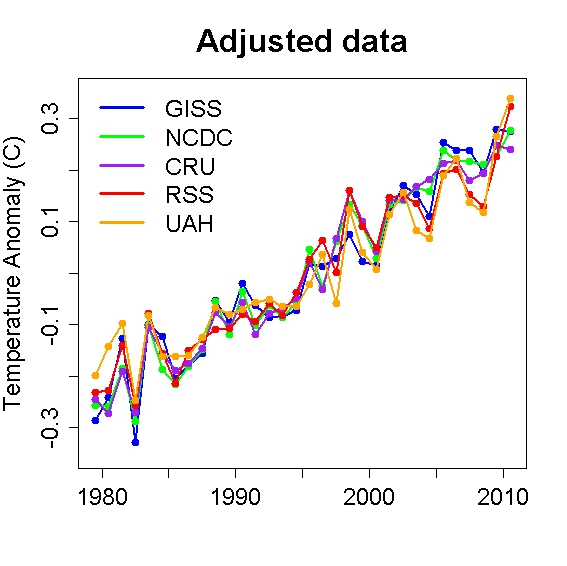
-
gallopingcamel at 17:38 PM on 1 March 2012Radiative Balance, Feedback, and Runaway Warming
Jose_X @70, Your calculation based on CO2 doublings greatly underestimates the effect of multiplying Earth's ~400 ppm of CO2 by a factor of one million. Adding that much mass to our atmosphere would raise the surface temperature to at least 900 Kelvin. Once the surface temperature gets high enough the oceans would vaporize causing an additional 300 bars of surface pressure and a further increase in temperature. Venus with its 90 bar atmosphere would look chilly by comparison. Chris Colose would (posthumously) call this a "Runaway" greenhouse effect. You can find an excellent discussion of this here with plenty of side references that are worth reading: http://scienceofdoom.com/2010/06/12/venusian-mysteries/ -
owl905 at 17:37 PM on 1 March 2012The Independence of Global Warming on Residence Time of CO2
From here it's a mixture of sympathy and pity for Essenhigh's paper. It's understandable why he wouldn't budge from his position - his framework is false. His claim that CO2 levels spiked 1000% and declined in 16 years only measured the rare C14 values, not the CO2 well-mixed global levels. Those levels showed no spike at all to nuclear testing. He connects CO2 levels as a consequence of warming while skipping two basic tests. First, there's no record of a similar CO2 rise of 25%/century anywhere in the geological or historical record. Second, if .7dC warming can push CO2 levels up 40% (his claim), there would be a GHG record that looked like a seismograph output showing extremely unstable values for atmospheric CO2. Basically, he's failed to review the data, and he's missed the cacophony claiming CO2 is rising WITHOUT temperature rising. Then he constructs a one-way model that has no relevance to the carbon cycle - he missed the basic difference between residence time in one regime (atmosphere, land, ocean) that averages about 8 years; and the residence time of the system load in the biosphere as a unit - which is in the 50 to 200 year range the IPCC outlines. Feel sorry for a man when the need to invent a paradigm, that embarrasses academic degrees and a professional status, that fails to listen and learn before it talks and teaches. The '1000%' spike source -
CoalGeologist at 17:31 PM on 1 March 2012Greenhouse Effect Basics: Warm Earth, Cold Atmosphere
OK... I can no longer restrain my reluctance to bare my ignorance in public. I just don't 'get it' that:"the reduction in energy radiated to space because of the presence of Infra-Red absorbing molecules in the atmosphere. That is, it is the greenhouse effect.
What reduction of energy radiated to space? I also didn't 'get' the same thing in another recent discussion on SkS about "Radiative Balance, Feedback, and Runaway Warming" According to diagrams such as this one from Kiehl & Trenberth (1997): incoming solar radiation is ~341.3 W/m2, of which ~101.9 is immediately reflected back out into space. 0.9 W/m2 is estimated to be absorbed by the oceans. The outgoing LWR is 238.5 W/m2.
I'm not too good at math, but 238.5 + 101.9 + 0.9 = 341.3, which basically tells me that, at least to the first decimal place, the energy balances... which is pretty much what I expected, based upon certain principles of thermodynamics.
It was my impression that the greenhouse effect was due to a slowing of the escape of outgoing heat by its absorption and re-emission (so-called radiative heat transfer) by GHGs. The increased heat is manifested as a higher temperature, owing to a certain other principle of thermodynamics. It has been my understanding that the outgoing long-wave radiation is suppressed in the absorption bands for GHGs--a telltale sign that GHG warming is occurring--but that owing to the increase in temperature (due to greenhouse warming), the emission in the parts of the spectrum transparent to outgoing longwave radiation is increased.
Either my understanding is wrong, or the excerpted statement is wrong. Someone please correct me. (I can take it.)
incoming solar radiation is ~341.3 W/m2, of which ~101.9 is immediately reflected back out into space. 0.9 W/m2 is estimated to be absorbed by the oceans. The outgoing LWR is 238.5 W/m2.
I'm not too good at math, but 238.5 + 101.9 + 0.9 = 341.3, which basically tells me that, at least to the first decimal place, the energy balances... which is pretty much what I expected, based upon certain principles of thermodynamics.
It was my impression that the greenhouse effect was due to a slowing of the escape of outgoing heat by its absorption and re-emission (so-called radiative heat transfer) by GHGs. The increased heat is manifested as a higher temperature, owing to a certain other principle of thermodynamics. It has been my understanding that the outgoing long-wave radiation is suppressed in the absorption bands for GHGs--a telltale sign that GHG warming is occurring--but that owing to the increase in temperature (due to greenhouse warming), the emission in the parts of the spectrum transparent to outgoing longwave radiation is increased.
Either my understanding is wrong, or the excerpted statement is wrong. Someone please correct me. (I can take it.)
-
KR at 17:27 PM on 1 March 2012Radiative Balance, Feedback, and Runaway Warming
My apologies, the Loehle/Scafetta reconstruction in the illustration has a cyclic+linear component. The most recent Scafetta paper, on the other hand, has a cyclic+quadratic basis up until ~2000, when (for reasons not clearly justified, or understood here, as it leads to a worse fit) he changes to cyclic+linear again. Either way, his model fails in backprojection, includes no physics, but is simply correlation without causation, and hence has no predictive power. Physics: Good predictions Good stats: Reasonable predictions if nothing changes Bad stats: Better off repeatedly flipping a coin Since CO2 forcings are constantly changing, ENSO, solar, and volcanic forcings are not correlated, Scafetta's work is simply bad statistics. -
KR at 17:19 PM on 1 March 2012Radiative Balance, Feedback, and Runaway Warming
gallopingcamel - Scafetta's work is simply curve-fitting to a limited period. When taken outside the 'training period' for his cyclic+quadratic fit, it fails horribly: This is simply a rather limited Fourier decomposition (over-attributed to larger frequencies within the timeframe that happen to somewhat match selected astronomical periods) of the period under analysis, with no predictive power whatsoever - correlation without causation, unable to make any predictions as it is not based upon any physics related to the system. That's fine as long as the inputs/forcings do not change, but cannot predict future (or past, as shown above) behavior if they do, for example as CO2 levels change.
I'll note that the quadratic term in Scafetta's most recent work (oddly without emphasis in his papers) does roughly correspond to CO2 forcing. With no conclusions drawn, or analysis applied...
Where is your skepticism?
This is simply a rather limited Fourier decomposition (over-attributed to larger frequencies within the timeframe that happen to somewhat match selected astronomical periods) of the period under analysis, with no predictive power whatsoever - correlation without causation, unable to make any predictions as it is not based upon any physics related to the system. That's fine as long as the inputs/forcings do not change, but cannot predict future (or past, as shown above) behavior if they do, for example as CO2 levels change.
I'll note that the quadratic term in Scafetta's most recent work (oddly without emphasis in his papers) does roughly correspond to CO2 forcing. With no conclusions drawn, or analysis applied...
Where is your skepticism?
-
KR at 17:07 PM on 1 March 2012Radiative Balance, Feedback, and Runaway Warming
Jose_X - I will (putting my 2 cents in, if that) note that it is a bit difficult to follow a stream of consciousness post. It would be easier to follow if you were to note your assertion(s), followed by the backing. Otherwise it's a bit difficult to identify any issues you might raise. That said - Huffman appears to think that plate tectonics is nonsense (not the best recommendation), N&Z have apparently used basic curve fitting to re-derive the S-B relationship without acknowledging it, PV=nRT requires a separate temperature driven by convection and radiative physics to set the pressures, etc. Even WUWT has pointed out N&Z issues with significant justification. Which aspect(s) of those postings do you consider significant issues with basic radiative physics? -
gallopingcamel at 17:03 PM on 1 March 2012Radiative Balance, Feedback, and Runaway Warming
scaddenp @71, Scafetta has shown that planetary motions correlate with global temperature. At first blush this sounds like astrology rather than science. You should be skeptical as I am but maybe we should suspend judgment. Suppose that the gyrations of the major planets somehow modulate the reactions taking place in the sun's core. If this was happening, how long would it take for the effects to reach the sun's radiating surface? If you rely on Radiative Transfer the answer is tens of thousands of years. So is there any process that could explain the very short time constant that matches observations? If such a mechanism exists it may take decades to understand it just as in Wegener's case. -
Composer99 at 15:58 PM on 1 March 2012DenialGate - Highlighting Bob Carter's Selective Science
The CASS-CFI report I linked to indicates Patterson was for some time the teacher of the course; the year they audited the course's videos it was taught by a Tom Harris. -
Bob Loblaw at 13:54 PM on 1 March 2012DenialGate - Highlighting Bob Carter's Selective Science
Carleton University is the home of Tim Patterson - a well-known climate change denier. That's probably where the guest lecture was done. The geography department used to have people who actually knew about climatology, but I'm not sure who they have there now. Tim Patterson is in geology, and would probably consider Tim Ball to be a peer (which is not a strong recommendation). -
KR at 13:45 PM on 1 March 2012The Independence of Global Warming on Residence Time of CO2
Michael Hauber - Your post is contradictory, I would assume not intentionally. Your hypothetic source/sink will emit/absorb CO2 above a specific level? This is not comprehensible. The oceans have (as per the ice core record) absorbed or release ~90ppm of CO2 over a 5-6C temperature swing, with a time delay of 500-800 years. Not due to atmospheric CO2 concentration changes, mind you, but due to solubility changes with temperature. The oceans therefore do not fit your hypothetical, as atmospheric concentrations have changed in sync with our emissions for the last 150 years or so, with natural sinks (primarily the oceans) absorbing only half of our emissions. In regards to the oceans, I would suggest reading the OA Is Not OK series, Why ocean heat can’t drive climate change, and What is causing the increase in atmospheric CO2 to review the mass balance issues. We certainly understand enough of what CO2 is doing in the oceans to determine that the oceans are not the source of CO2 increases over the last 150 years.
Prev 1243 1244 1245 1246 1247 1248 1249 1250 1251 1252 1253 1254 1255 1256 1257 1258 Next


