


 Arguments


Recent Comments
Prev 1311 1312 1313 1314 1315 1316 1317 1318 1319 1320 1321 1322 1323 1324 1325 1326 Next
Comments 65901 to 65950:
-
Tom Curtis at 13:58 PM on 22 January 2012A Comprehensive Review of the Causes of Global Warming
patonomics @29, it may be a "34% error bound", but it is an accuracy of approximately 99% (3 degree K temperature range at approximately 290 degree K). Whether that is accurate enough depends critically on the reason the temperature is being modeled. -
Tom Curtis at 13:39 PM on 22 January 20122011 Hottest La Niña Year on Record, 11th-Hottest Overall
jyh @20, Foster and Rahmstorf have already used the Southern Oscillation Index instead of the Multi-variate ENSO Index to test the robustness of their analysis, so that aspect should be no problem. Given the removal of exogenous factors, the result should be not a linear trend over the entire century, but a variable curve approximately matching anthropogenic forcings, ie, the green curve in this figure from Lean and Rind (2008): Based on the empirical model produced by Lean and Rind (below), we would expect large excursions from the "anthropogenic" signal in the periods 1910-1915, and 1940-1945, and a smaller excursion in the period 1960-1964. On top of that we would expect small, fluctuations about the anthropogenic signal.
 I put "anthropogenic" in "shudder quotes" above because Lean and Rind do not model all anthropogenic factors. In particular they do not model Black Carbon, which I suspect was a major influence in the high temperatures during WW2. It should be noted that in the period 1880 to 1940, BC and sulfates found in Greenland ice cores rise to a peak around 1910, before gradually tailing of. The reduction after 1910 would be because of the transition from coal to oil as a major fuel. Because the sulfates and BC are significantly correlated, they would have to a significant extent counteracted each others effects. In contrast, BC from WW2 would come from the burning of cities, and would not have significant associated sulfate emissions. Because of the direction of the prevailing winds, cities burning in Europe would also not have left a significant record in Greenland.
-
patonomics at 13:22 PM on 22 January 2012A Comprehensive Review of the Causes of Global Warming
We learn the following about Science " Theories are more certain than hypotheses, but less certain than laws." I happen to be involved in 3D heat generating equation calculation and validation in a closed miniature atmospheric calculation in 1990 & 1991 for grain silos. I am amazed by a even 2011 publication which claims only over 34% error bound [(3.1-2.3)*100/2.3] and still claim "model is considered sufficiently accurate and reliable". Then what to expect from real earth atmosphere predictions, where closed system experimentation and observation is not feasible. There gain silo case is as follows
The standard error of predicted versus observed headspace air and wall temperatures was in the range of 2.3°C to 5.3°C and 3.1°C to 5.5°C, respectively. The standard error of predicted versus observed headspace humidities was around 7%. The developed model is considered sufficiently accurate and reliable to predict air temperature and relative humidity at multiple locations in the headspace of a grain storage silo. What to expect when one claims to see what the scientific literature and data have to say about exactly what is causing global warming I will highly appreciate if anyone refer me to "Climate Science Laws", if there are any, for my assimilation of knowledge as I am getting hunted by close friends who claim there are ready prove & certainty about AGW but could not substantiated by any validated document so far. - If there is none, I do not want any initiative to throw any unsubstantiated articles as references (about certainty) is this regard.Moderator Response:Grain silos are not good models of the Earth's climate system. For actual results of climate models compared to observations, see the Skeptical Science argument "Models are Unreliable." (Type that into the Search box at the top left of this page.)
-
barry1487 at 13:08 PM on 22 January 2012How do Climate Models Work?
funglestrumpet@38, what you say is exactly what I imagine is happening. We have for years tried to unlace politics and ideology from the discussion of the science, demanded of ourselves that we maintain a purely scientific argument, and pointed out to the contrarians where they err in this respect. Their perversion of reason is the most frustrating aspect of the general debate, I reckon, and I think the reason-based community has become weary of being primly objective with little apparent effect. At its heart, the debate over climate science is an activist pursuit. It may be we've become tired of covering it with a mask of neutrality, and that it's not enough to "carry on as we are." Tom Curtis@17, agree with all of that. However, the posts you cite are not representative of occasional forays at SkS into areas that are not purely scientific. These are all recent. I believe this is a trend, and the extra latitude in the articles here lately has resulted in some disconnects with the mission statement, which is explicit about devotion to pure science. http://www.skepticalscience.com/about.shtml Technically, the mission statement might be amended. But I just wanted to bring this adjustment in priorities (if such is occurring) to light so that we're aware of it and more effective for being so.Moderator Response: [muoncounter] Please take continued discussion of what you perceive to be some sort of 'sea change' at SkS to The Big Picture. You will note that particular thread, originally written in 2010, has a section on advocacy and policy. -
climateadj at 13:07 PM on 22 January 2012How do Climate Models Work?
Tom... how astute of you! I simply (mis)described climatoloy for annual variability. My experience is that one can run any 12mth perod thru my program and end up with the same result. Then again, I'd like to see a professional examination of this subject. -
jyyh at 12:40 PM on 22 January 20122011 Hottest La Niña Year on Record, 11th-Hottest Overall
"periods of 1880-1940, 1910 to 1940" I think MEI isn't calculated that far in history, as it takes note of many atmospheric variables not commonly and widely measured before war. But, there's SOI, and as he says it's robust then it seems there should be no reason why this couldn't be done. Aerosol loading may have changed for alterations in ff use, though, i'd imagine -
Tom Curtis at 12:01 PM on 22 January 2012A detailed look at climate sensitivity
Eric (skeptic) @75, using your numbering: 1) On the Serial Deleter thread, I gave two criteria under which SkS practice should be considered sub-par: a) That "...not including figure 3b of Knutti and Hegerl has resulted, or facilitated, in misrepresentation of some part of Knutti and Hegerl by SkS"; or b) That "...not including figure 3b of Knutti and Hegerl has resulted in a failure to canvass issues that should have been canvassed in a post on SkS." In case (a), you would have found an example in which SkS practice could be (and should be) criticized in much the same manner as Michaels is criticized in the OP of the "serial deleter" thread. In case (b), you would have found an example in which SkS practice did not rise to the level of misrepresentation, and hence was not so criticizable; but in which it still represented a serious lapse from the standards which we would expect. It is noticeable that you do not criticize the OP in this article on either of these grounds. Instead you criticize it on the much weaker grounds that it contained relevant information. Of course, it does contain relevant information. Fortunately, however, we do not and should not expect articles of any nature to contain all relevant information. Where they to do so, nothing short of a expanded exposition of any scientific paper referred to would be acceptable; for, of course, all the information in those papers is relevant, and so is the background knowledge that could be expected of the scientists to whom the papers are addressed but which cannot be expected of the general public (hence the expanded exposition). Such a requirement would make any blog post extraordinarily long and turgid even by my long winded standards. You may suggest that the information in this case is so relevant that it should have been included, or that the information could have been included simply by including the figure (or both). The second, however, is false simply because the figure assumes background information, part of which I expounded after the bolded "more importantly" in my post 72. Because the figure is easy to misinterpret without background knowledge (and doubly so given the presence of people who would IMO willfully misinterpret it), its inclusion would have required adding at least two paragraphs to the two paragraph section on paleoclimate above, plus additional paragraphs in other sections in that the figure is not restricted to paleoclimate. Given an intent to communicate succinctly and clearly, the additional text required to include the relevant information from the graph was too high a load for the additional information required. And of course, much of the information about certainty is already included in the error bars from figure 3a, so it is not true that the additional relevant information should have been expanded on in the original article. Of course, the additional information is included in the article in the minimal form of a link to the original article by Knutti and Hegerl. Given this, and given the factors mentioned above, while the information in figure 3a is relevant, it was certainly not sufficiently relevant that it needed to be canvassed explicitly in the OP. That fact should lay to rest any suggestion that SkS is applying a double standard with respect to the use of graphs in its criticism of Michaels. 2 & 3) The issue of uncertainty in climate regimes is a major factor when considering a sensitivity analysis in relation to a particular period. It ceases to be a significant factor when a large number of paleo sensitivity analyses are made across a large range of different climate regimes. That is because a robust result found across all paleoclimate regimes almost certainly applies in any particular regime, including our current regime. I know that is simply repeating my point from 72 above, but I do not see anything in what you write that tends to rebut it. Yes there are other non-forcing related factors which adjust the base global average temperature for a given radiative forcing, either by altering the strength of feedbacks, or by altering the heat distribution of the Earth (with greater variation allowing a lower Global Mean Surface Temperature). Changes in land cover and land/sea proportions could also make minor changes to emissivity which would also adjust GMST relative to a particular forcing. But it is extraordinarilly odd that these factors should some how combine to produce the same apparent climate sensitivity when comparing either the pliocene (3 C warmer, low ice, higher sea levels) or the LGM (6 C cooler, much ice, lower sea levels) to the present day. It is even odder that with a climate sensitivity for doubling CO2 of between 3-4 degrees C during non-glacial periods and double that during glacial periods (due to the increased feedback from ice albedo effects) explains 85% or more of the variation in CO2 concentration, as found by Park and Royer (2011). Please note that this is the long term climate sensitivity, ie, the climate sensitivity allowing for meltback or growth of "permanent" ice sheets. In the absence of such ice sheets, that should approximate to the Charney Climate sensitivity discussed in the article above. Hence Park and Royer tends to confirm that the Charney climate sensitivity is in the range of 3 to 4 degrees C, and has been across all geographical conditions encountered in the last 540 million years. Once weatherable land surface is factored in, the primary determinant of CO2 levels is temperature. As Park and Royer show, factoring in weatherable land area allows an even greater explanation of the variance in CO2 levels with a presumed non-glacial climate sensitivity of 3-4 degrees C (figure 10). Hence a climate sensitivity given feed backs excluding long term changes in "permanent" ice sheets of 3-4 degrees C is a very robust feature of the phanerozoic. -
Riccardo at 11:20 AM on 22 January 2012How do Climate Models Work?
climateadj use a dice as an analogy. You can hardly predict next result but in the long run you know the probability. -
funglestrumpet at 11:18 AM on 22 January 2012How do Climate Models Work?
barry @ 14 What do you recommend then; just carry on as we are watching the world go to hell in a handcart? We see Copenhagen go by in a flurry of missed opportunities and then Durban do the same. We see the sort of tricks that the likes of Monckton, Lawson, Lindzen, Christy, Spencer and Michaels, to name but a few of the denialati, get up to. We see the enormous support given by the fossil fuel industry towards a b.a.u. scenario and nothing much happens to raise that publicly as an issue. We have America, one of the world’s most polluting nations, with a mainstream political party that has climate change denial as a rite of passage to membership. We have articles published here repeatedly reporting how things are just moving from bad to worse and we do nothing, but simply get the science right! Anything else is “Just not cricket, old boy!” Well, to hell with that. I come here to understand the science and this site is excellent at meeting that need. But the reason behind my desire to understand the science is that I am very concerned about the future that my children and grandchildren face. I assume that many others have the same concerns as me and come to the same trough of knowledge for the same purpose. So from time to time I might write something that could be considered advocacy. I make no apologies for that. I will do whatever I can to protect my family and if that is frowned upon, well go on then, frown. My family come before all other considerations. I am not alone in getting exasperated at the lack of action on combating climate change. It was obvious in her excellent article on Methane outgassing in the Arctic that Dr Natalia Shakhova is fed up with the lack of action on the issue. Perhaps she, more than most, can see just how urgent things are, especially if the methane outgassing follows a worst case scenario. She too can see just how much of a hindrance all this arguing about whether the warming is anthropogenic or not is. If it were not climate science, but the science surrounding that of a particular model of aircraft, say, we would have grounded the whole fleet long before now because of the danger posed by continued operation. Yet planet earth can carry on with business as usual. We can always catch another aircraft. We cannot catch another earth. -
Tom Curtis at 11:15 AM on 22 January 2012How do Climate Models Work?
climateadj @35, I do not see where you performed a mathematical step in order to examine seasonal variance rather than variance simpliciter. I'm not up on the maths involved, but it seems to me that if you just plot the variance of the data, it may well be dominated by quasi-periodic oscillations such as ENSO, or indeed possibly even by long term trends if seasonal variation is low compared to long term changes in temperature. -
Tom Curtis at 11:02 AM on 22 January 20122011 Hottest La Niña Year on Record, 11th-Hottest Overall
Alex C @18, Tamino writes:"For the updated results, rather than use TSI (total solar irradiance) to represent solar variations I used sunspot counts, because they’re easy to get, kept up-to-date, and already available as monthly averages."
The "easy to get at" and "available as monthly averages" may be particularly important factors in that his updated software passages included a program which gathers the data from the internet, and formats it for you so that you can easily keep the analysis up to date. It may be that the programming task was easier in that respect with sunspot numbers than TSI. Of course, I am speculating, and if you think it is important, you should ask him. What I do know is that in Foster and Rahmstorf (2011), Tamino wrote:"To test whether the results might be sensitive to these choices, we also did experiments characterizing el Nino by the southern oscillation index (SOI) rather than ˜MEI, characterizing volcanic aerosols by the volcanic forcing estimate of Ammann et al (2003) rather than the AOD data from Sato et al, and using monthly sunspot numbers as a proxy for solar activity rather than TSI. None of these substitutions affected the results in a significant way, establishing that this analysis is robust to the choice of data to represent exogenous factors."
That being the case, the switch to sunspot numbers should make no significant difference. -
John Hartz at 10:28 AM on 22 January 2012How do Climate Models Work?
climateadj; Thanks for the clarification and the link to your calculations. Alas, I am not qualified to assess the reasonableness of your computations and of your tentative conclusion. -
Alex C at 09:55 AM on 22 January 20122011 Hottest La Niña Year on Record, 11th-Hottest Overall
Tom Curtis @16: I have typically seen 11 year running averages, and thought that it was for much the same reason as that a centered mean cannot be given for an even number of years. I am aware of the solar cycle length average, but the thought that it was the primary driver behind a choice of 11 years hadn't occurred to me before (I suppose it should have, hm?). Thanks for the clarification. I personally found Tamino's switch to sunspot number interesting. I thought that TSI data was updated continuously (daily), why use a proxy instead of the real deal? -
Tom Curtis at 09:54 AM on 22 January 20122011 Hottest La Niña Year on Record, 11th-Hottest Overall
It would be interesting if one of the tech savvy people at this site used Tamino's software to adjust for exogenous factors for the periods 1880-1940, 1910 to 1940, and 1880 to 2011. (I have just made the same suggestion to Tamino, so you may want to hold of to see how he responds.) -
Tom Curtis at 09:47 AM on 22 January 20122011 Hottest La Niña Year on Record, 11th-Hottest Overall
Alex C @13, while the reason for the odd number of months is as you give it, the reason for choosing an approximately 11 year running average is almost certainly to remove the solar cycle. (I suspect your aware of that, and have merely phrased your response to Chris G @10 poorly.) -
Tom Curtis at 09:41 AM on 22 January 20122011 Hottest La Niña Year on Record, 11th-Hottest Overall
Sorry, I forgot to include the link to Tamino's site for those not familiar with it. -
Tom Curtis at 09:40 AM on 22 January 20122011 Hottest La Niña Year on Record, 11th-Hottest Overall
Grant Foster (Tamino) has updated the analysis from Foster and Rahmstorf to include (most of) 2011's data. The "most of" is because HadCRUTv3 has not yet released their data for Dec 2011. He has also switched to using sunspot data rather than TSI to allow for the influence of solar activity. For the computer savy, he has also updated his publicly accessible programs. His summary of the unadjusted data:
"For GISS data, 2011 was the 9th-hottest year on record, for NCDC it was 11th-hottest, for HadCRU (using only data through November) it was 12th-hottest, for RSS it was 12th-hottest, and for UAH 9th-hottest."
And of the data adjusted for exogenous factors: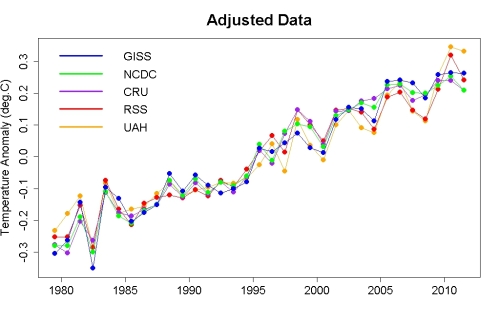
"In the adjusted data, GISS ranks 2011 as the 2nd-hottest year on record (just behind 2010), NCDC ranks it 5th, HadCRU (using only data through November 2010) ranks it 5th, RSS ranks it 2nd, and UAH 2nd. No, global temps are not in a crash — they still fluctuate (for a lot of reasons, including exogenous factors) but the trend continues. It’s called “global warming.” It’s caused by human activity. It’s dangerous."
-
climateadj at 09:35 AM on 22 January 2012How do Climate Models Work?
@John: The source of my assertions are my own calculations. The link below is my analysis. Since I'm just a hack with marginal programming skills, there is a high likelihood of error. I am not a scientist of any sort. Caveat Emptor: https://sites.google.com/site/climateadj/ocean_variance -
Alex C at 09:17 AM on 22 January 20122011 Hottest La Niña Year on Record, 11th-Hottest Overall
@Chris G: The running average I think is given at the center of the time interval, which only exists with an odd number of months. I don't think it has to do with removing the solar cycle. -
John Hartz at 09:07 AM on 22 January 20122011 Hottest La Niña Year on Record, 11th-Hottest Overall
Dana, Recommend that you move the text caught up in the right-hand margin of the graphics to underneath the graphics. -
John Hartz at 09:03 AM on 22 January 20122011 Hottest La Niña Year on Record, 11th-Hottest Overall
For a portend of what’s on the horizon, see “NASA Sees Repeating La Niña Hitting its Peak” posted on the NASA/Jet Propulsion website. -
Chris G at 09:02 AM on 22 January 20122011 Hottest La Niña Year on Record, 11th-Hottest Overall
Curious, why the 133-month average? I most commonly use a 132 because that smooths over any 11-year solar cycle effect, but then...I'm thinking that the solar cycle average may not be, actually, is highly unlikely to be, exactly 11 years, on average. So, maybe your rationale is the same, just using a more refined number for the period. I'd be surprised if it made any noteworthy difference though. Ah, good old friend Google. Seems the solar cycle average is more accurately 11.1 years; 133 it is. -
muoncounter at 09:00 AM on 22 January 20122011 Hottest La Niña Year on Record, 11th-Hottest Overall
actually thoughtful#1: "1910-1940 warming looks similar, in slope, to the 1970-2010 warming" Another big difference is seen here: Summer warming, driven by solar output, was faster than winter warming in the early 20th century. Latter 20th century (and ongoing) warming shows winters warm more rapidly; a greenhouse effect.
-
John Hartz at 08:52 AM on 22 January 2012How do Climate Models Work?
climateadj: What is the source of your assertion that GCMs "can't even mimic seasonal ocean temperature variability"? BTW, climate models cannot "replicate" the real world, they can only "simulate" it. -
Daniel Bailey at 08:50 AM on 22 January 20122011 Hottest La Niña Year on Record, 11th-Hottest Overall
@ actually thoughtful You will note from the 3rd figure in the OP that the La Niña's are consistently getting warmer. -
actually thoughtful at 08:44 AM on 22 January 20122011 Hottest La Niña Year on Record, 11th-Hottest Overall
I suspect La Ninas will bring us more coldest/driest and El Ninos will bring us more record heat. That we are getting record heat in a La Nina should give doubters pause. Very big pause. -
PT_Goodman at 08:23 AM on 22 January 20122nd law of thermodynamics contradicts greenhouse theory
The 2nd reference, "Physical Principles of Meteorology and Environmental Physics", under Further Reading is not free. The Table of Contents and Chapter 1 can apparently be freely downloaded for free. -
Johnb at 08:23 AM on 22 January 2012How do Climate Models Work?
Quote However, the big questions, like "Is human activity warming the planet?", don't even require a model. The only things you need to answer those questions are a few fundamental physics and chemistry equations that we've known for over a century. You could take climate models right out of the picture, and the answer wouldn't change. Scientists would still be telling us that the Earth is warming, humans are causing it, and the consequences will likely be severe Exactly my point - For the Public Understanding of the issue the science is clear and uncomplicated. By surrendering that clarity of message and allowing the skeptics to muddy the waters a great dis-service has been allowed. Within Science itself of course debate, experiment and challenge must continue to tease out the nuances, feed-back loops and the simple understanding of process and detail but how Science works shouldn't have obscured the basic science and the clarity of its message to the General Public. Johnb. -
Pete Dunkelberg at 08:17 AM on 22 January 20122011 Hottest La Niña Year on Record, 11th-Hottest Overall
The apparent cool spot in south Florida (fig. 4) is just lake Okeechobee. -
climateadj at 08:17 AM on 22 January 2012How do Climate Models Work?
@John: I suspect that GCM's model radiative forcings, conduction, and convection. Annual variability is a function of all three. It is predictable and testable against observations. -
MA Rodger at 08:07 AM on 22 January 20122011 Hottest La Niña Year on Record, 11th-Hottest Overall
Another noteworthy event from the 2011 temperature records. The UAH annual temperature anomaly is higher than RSS for the first time ever. The differences between them were getting more divergent up to 2000 since when they have converged and now swapped places with the UAH anomaly diverging at a rate of 0.3 deg C per decade! -
actually thoughtful at 08:04 AM on 22 January 20122011 Hottest La Niña Year on Record, 11th-Hottest Overall
Ironically two threads I am posting on over at WuWT are invoking the 1910-1940 (nothing to do with me or this post). Having just reviewed the solar contribution to the 1910-1940 I was able to quickly set the record straight. (not holding my breath that anyone posting at that site will accept said reality). In regards to WUWT - Must...stop...posting -
climateadj at 07:39 AM on 22 January 2012How do Climate Models Work?
@John/Riccardo: Seasonal ocean temperature variability is a somewhat constant feature. I'm not talking about trends which fluctuate. It's simply measuring the annual variance of temps for each gridbox, averaging out the longitudinal dimension, and plotting the results. The ARGO derived pattern is consistent from year to year or any 12 month period, regardless of ENSO. There's a clear pattern that the CMIP3 ensemble doesn't replicate very well. Now the CMIP3 models were generated circa 2004 when the ARGO network was in it's infancy. Perhaps this test is asking too much. It'll be interesting to see if the CMIP5 ensemble does better. -
actually thoughtful at 07:19 AM on 22 January 20122011 Hottest La Niña Year on Record, 11th-Hottest Overall
Dana - thanks. Still groggy from my time at WUWT. The evidence I find most compelling, when comparing 1910-1940 to 1970-2010 is the higher solar activity in the former time period, which is notably, stunningly absent in the the last 40 years (even more so for the last 10 years). -
Albatross at 07:14 AM on 22 January 20122011 Hottest La Niña Year on Record, 11th-Hottest Overall
actually thoughtful @1, You seem to be missing the point. In the absence of a log term underlying warming trend global SAT anomalies in 2011 should have been between -0.1 and -0.2 C. Instead they were over +0.5 C (w.r.t the 1950-1980 baseline) and according to GISTEMP the 9th warmest year on record. That, despite just emerging from a prolonged solar minimum and increased aerosol loading and about 7 of the 12 months having an ONI of <-0.5 (ONI values of -0.5 or less are typically consistent with La Nina conditions. -
wili at 07:04 AM on 22 January 2012Arctic methane outgassing on the E Siberian Shelf part 2 - an interview with Dr Natalia Shakhova
John, I left this comment over at the ClimateProgress reposting of the interview, but in case you miss it there: In your second to last paragraph you say: "we now know without doubt that methane is venting to Earth's atmosphere from parts of the ESAS seabed in copious quantities as a response - a positive feedback - to warming." What I would like to know is what in this interview or in other things you have read, seen or heard leads you to come to such a firm conclusion that this is already certainly part of a feedback. I think it most likely is, but this seems to be exactly the thing that is being hotly debated, and I have not seen Shakhova come out and say that it the methane releases she has observed are definitely part of a GW feedback--quite the opposite: she has pointed out that they have NOT made such a claim. So if you have some source or data that you are basing this conclusion on, I would definitely like to know what it is. Thanks ahead of time. Oh, and what do you think of the AIRS images posted above. Art they further evidence that something unusual is going on with Arctic methane this year? Should we expect levels to be much higher already? -
Riccardo at 06:57 AM on 22 January 2012How do Climate Models Work?
climateadj how can I tell that next summer will be warmer than now if I can't predict the weather 10 days from now? Short term variability is one thing, climate another. -
John Hartz at 06:55 AM on 22 January 2012How do Climate Models Work?
@climateadj: I suspect that the GCMs were not designed to "mimic seasonal ocean temperature variablilty." -
climateadj at 06:47 AM on 22 January 2012How do Climate Models Work?
Question: Why should I trust GCM's future projections when they can't even mimic seasonal ocean temperature variability? The CMIP3 ensemble was lacking in this regard, but perhaps CMIP5 will be better. -
actually thoughtful at 06:37 AM on 22 January 20122011 Hottest La Niña Year on Record, 11th-Hottest Overall
Looking at the first graphic, the 1910-1940 warming looks similar, in slope, to the 1970-2010 warming. Of course one is 30 years, and one is 40. But wouldn't we expect an increase in the slope as CO2 is driving temp up even more than it was in the 1940s? Or am I missing something.Response:[dana1981] See "It warmed just as fast in 1860-1880 and 1910-1940"
-
Riccardo at 06:22 AM on 22 January 2012How do Climate Models Work?
Icarus @ 25 the graph is taken from The Copenhagen Diagnosis, page 32 of the first edition. They say:This dramatic retreat has been much faster than that simulated by any of the climate models assessed in the IPCC AR4 (Figure 13). This is likely due to a combination of several model deficiencies, including: 1) incomplete representation of ice albedo physics, including the treatment of melt ponds (e.g., Pedersen et al. 2009) and the deposition of black carbon (e.g. Flanner et al. 2007; Ramanathan and Carmichael 2008); and 2) incomplete representation of the physics of vertical and horizontal mixing in the ocean (e.g. Arzel et al. 2006).
-
michael sweet at 05:21 AM on 22 January 2012What's Happening To Tuvalu Sea Level?
In my post above I misplaced the decimal. It should read minimum of 8.0 mm/yr and central estimate of 16.0 mm/yr for the entire globe. 16.0 mm/yr is three times the current rate (at Tuvalu). The expected rate of sea level increase is not linear so averaging the rate as mm/yr over the entire time period is not very meaningful. It does indicate that Tuvalu is in for a world of hurt when the sea really starts to rise. -
Icarus at 05:11 AM on 22 January 2012How do Climate Models Work?
Fascinating article, many thanks for writing and posting it. I thought it was particularly interesting that the models are run from scratch rather than trying to initialise them with real world data. The fact that they then accurately simulate observations is good evidence that they have 'skill' and aren't just being tweaked by making them adjust to observations, as some would have you believe. Here's something I'm curious about: In the example of Arctic sea ice extent falling substantially faster than projected, is that because the projections got the Arctic climate wrong (perhaps polar amplification is greater than projected), or is it because they got the climate right but the ice has turned out to respond faster than projected? Or is it neither of these things, or both? Cheers... -
climatesight at 05:01 AM on 22 January 2012How do Climate Models Work?
#21 michael sweet: I am an undergraduate math student just starting to get into climate modelling research. Eventually I want to develop and run experiments on climate models (not necessarily GCMs, I am also interested in lower-resolution, faster EMICs). Last summer I did a project with Steve Easterbrook, a computer science professor at the University of Toronto, to examine the software architecture of climate models: how they are built and organized. I give a summary of our research and findings here. #22 apiratelooksat50: 1) In general, it's really easy to get access to GCM code. I summarize my experiences here: the process ranges from an open download to an automated registration process to an informal email requesting access. Some of the models developed at governmental labs outside the United States require that a more formal license agreement be signed. 2) Not really. Input format depends hugely on the architecture of the model, which changes so drastically between GCMs. 3) Yes, absolutely. You can give the models any combination of forcings, whether natural or anthropogenic, that you want. You can even turn the Sun off and see what happens. What actions I realistically propose - this is straying away from my original post, so I must stress that I am taking off my scientist hat and putting on my public hat. That said, I am a fan of the revenue neutral "fee and dividend" system that James Hansen advocates. -
DMarshall at 04:46 AM on 22 January 2012How do Climate Models Work?
Thanks to Kate for this accessible explanation. The "skeptical" sites tend to trivialize the computer models as if they were an iPad app that "alarmists" whip up in their spare time. -
Lars Karlsson at 04:28 AM on 22 January 2012A Comprehensive Review of the Causes of Global Warming
A typo in the text:Tett et al. (2000) used an "optical detection methodology".
I believe it should say "optimal". -
muoncounter at 03:52 AM on 22 January 2012Climate Change Denial and the Media - Banishment of Science Reality
skeptikal: "In 1970, scientists of the day were saying ... I want to know what makes scientists today right, when the only thing they have is computer models." One thing that gives us greater confidence in what we say today over what may have been said forty years ago is an additional 40 years of observations. Much has changed in those 40 years: satellites, computers, worldwide monitoring of GHGs, etc. So to posit that 'they only have computer models' is nonsense. They have lots more data to work with - and more data allows lower uncertainty. Then there is the undeniable fact that the global warming signal was barely emergent in the 70s, but may well be in full swing now. You should investigate the parable of the frog in a pot of water. While you investigate, be sure to read the SkS posts that explicitly address your need to be 'convinced.' -
apiratelooksat50 at 02:53 AM on 22 January 2012How do Climate Models Work?
Kate, I have some experience in using modeling software (CORMIX for water and Beeline for air). As anything else accurate output depends on accurate input. Your article is very interesting and informative. I have a few questions: 1. Is the software available to the general public? 2. Is there a standard database for the input? 3. Are you able to remove/add anthropogenic factors? Also, I'm curious about what "actions" you realistically propose. -
Tom Dayton at 02:41 AM on 22 January 2012Climate Change Denial and the Media - Banishment of Science Reality
skeptikal, you are wrong that it is hard to get the raw data and that the algorithms are closely guarded secrets. Really, really wrong. Links to all those are here among other places: Tamino's Climate Data Links; look in the comments on that page for even more links. RealClimate's Data Sources page of links. -
Tom Dayton at 02:28 AM on 22 January 2012Climate Change Denial and the Media - Banishment of Science Reality
skeptikal, see the Skeptical Science argument "Ice age predicted in the 70s."
Prev 1311 1312 1313 1314 1315 1316 1317 1318 1319 1320 1321 1322 1323 1324 1325 1326 Next


