


 Arguments


Recent Comments
Prev 1325 1326 1327 1328 1329 1330 1331 1332 1333 1334 1335 1336 1337 1338 1339 1340 Next
Comments 66601 to 66650:
-
Daniel Bailey at 22:28 PM on 12 January 2012Sea level rise predictions are exaggerated
The GIS is drained very effectively by many marine-terminating ice-streams which penetrate into the heart of the sheet. Thus, decadal doublings of mass loss which can raise global sea levels by several meters per century have been observed in the paleo record. So even if the GIS takes several centuries to largely collapse, the ramifications of the collapse will still be felt this century. By us, our descendants and our civilization. The West Antarctic Ice Sheet (WAIS) is another story... -
Robert Murphy at 22:07 PM on 12 January 2012It's aerosols
JamesWilson#10: "I did find this link which claims CFC cools in the upper atmosphere. http://www2.ucar.edu/climate/faq under Ozone." From that link: "Ozone is actually a greenhouse gas, and so are CFCs, meaning that their presence in the troposphere contributes slightly to the heightened greenhouse effect." In the stratosphere, CFC's do lower ozone levels which then lowers temps there, but this is only a small part of the cooling that has happened in the stratosphere. Most of the cooling is from rising CO2, and this cooling is a direct fingerprint of AGW. More importantly, this is yet another example of CFC's being called GHG's and direct warming agents. This goes against your claim that CFC's were considered to cause net cooling, and that aerosols were substituted as cooling agents only very recently. The later claim is absurd, since the cooling effects of aerosols have been known for many decades now and were at the center of the debate in the 60's and 70's over whether cooling from aerosols would outweigh the warming from rising GHG's. Why can't you just admit you messed up? -
scaddenp at 20:17 PM on 12 January 2012Sea level rise predictions are exaggerated
Greenland inner plateau is high as well. However, you dont need to melt all of it to get very wet. -
Tony O at 19:58 PM on 12 January 2012Climate and Sea Level: An Emerging Hockey Stick
Coming out of the last ice age we got as fast as 4m per century. We have changed the forcing more than an order of magnitude faster than anything in the paleo record and yet we are expecting rises slower than that which has previously happened. Ice sheets are incredibly complex, expect surprises. I realy do have to agree with Bernard J'c comment it is not going to stop in 2100. While we may not be able to stop it, we will be able to make it worse. -
scienceteacher at 18:53 PM on 12 January 2012Satellites show no warming in the troposphere
Could you please add a direct rebuttal to the following article by Singer? Lack of consistency between modeled and observed temperature trends It attacks CCSP's modeling as being "an artifact."Moderator Response:[DB] Please, no All-Caps.
[JH]CCSP = US Climate Change Science Program. -
Rob Painting at 18:35 PM on 12 January 2012Climate and Sea Level: An Emerging Hockey Stick
Bernard J - I agrees wid ya! The Pliocene is where we're heading (so far) in terms of sea level rise. That's around 25 metres higher than present. There was a presentation at the last AGU where one of the scientists confirmed as much. I think it was part of James Hansen's lecture. Sure it'll take about a thousand years to get there, but so? -
Bernard J. at 18:01 PM on 12 January 2012Climate and Sea Level: An Emerging Hockey Stick
The thing that I find frustrating about almost all discussion on the topic of sea level rise is that it's all referred to in the context of increase by 2100 - as if it all suddenly just stops then. Consider that the rise was 20 cm in the 20th century, and likely to be around 1m in the 21st. What of the period between 2100 and 2200? And beyond? What of the eventual plateau once our emissions are finally controlled? I want to see and hear from the people who believe that we have no responsibility to the future, their justification for inaction. It's bizarre how so many denialists think that the faceless 'future generations' will fix 'it', either through an extraordinary but apparently inevitable cornucopian accumulation of wealth (how's that supposed to work, exactly?), or by miraculous techology, or both. Consider that America has been populated by colonialists for about 400 years, and Australia for about half that time. Each country is still intimately tied to its respective Western founders, and by the standards of most other cultures of the world we are mere babies. Effectively, each of the colonisations was little more than 'yesterday' in the scheme of things. And yet it seems that the decendants of those colonial 'fathers' and 'mothers' regard the time spanning backward to be far more important than the same periods projecting into the future. Hnnn. I suspect that generations 200 and 400 years hence will not have the same respect for us that we, today, apparently exhibit for our own ancestors. Indeed, I suspect that we will be perceived by our descendants with the same contempt that many native Americans and indigenous Australians have for the European settlers who invaded their respective lands those centuries ago. It's long past time that the world faced the fact of warming, and of concommitant sea level rise, and gave the future as much right to a decent world as we demand for ourselves today. -
Sceptical Wombat at 17:34 PM on 12 January 2012Sea level rise predictions are exaggerated
As I understand it the Greenland Ice Sheet is unlikely to collapse because it is surrounded by coastal mountains. The Antarctic sheets are however a different story. -
skywatcher at 16:51 PM on 12 January 2012Sea level rise predictions are exaggerated
It is clear in the above post's graphs and elsewhere, sea level rise has been accelerating through the past 100 years - I presume that ClimateWatcher's first graph, covering just 23 tide records, is an unrepresentative sample. The thrid graphic presented by ClimateWatcher is, to me, one of the scariest graphs in climate science, but I suspect ClimateWatcher does not realise why. It shows Meltwater Pulse 1A, a sea level rise of about 20m in <~500 years, which happened abruptly at some point during the melt of the last great ice sheets (though two great ice sheets remain). Thus the graph shows what is possible when you begin to melt a big ice sheet - sudden pulses of accelerated sea level rise. There was little warning as to the onset of the Pulse 1A, no gradual ramping up to it. Of course, something like that might not happen this time, or it might be thousands of years down the line. But the climate forcing this time is much bigger, and who'd like to deal with a sea level rise rate of >~60mm/yr? Wetsuit fitting sessions for St Mark, Galileo, the Statue of Liberty, the Old Course and anything else within a short distance of the coast? Or invest in a sea wall manufacturing company... -
Bern at 16:43 PM on 12 January 2012Climate and Sea Level: An Emerging Hockey Stick
Doug H: prudence would be recognising that, however much wealthier the future world may be, relocating, say, the cities of New York, London, Amsterdam, and many others to higher ground will cost a lot more than switching away from fossil fuels now. However, that also ignores the "let somebody else pay the bill" mentality that seems to pervade those whose main goal in life is to add another zero to their net worth. While ice melt & sea level rise is by no means the worst impact predicted from climate change, I think it's probably the one that would get the most response. It'd be hard to deny the ice sheets are melting when famous coastal landmarks start spending part of their day underwater. Of course, by then it will be far too late to do anything about it. -
Daniel Bailey at 16:38 PM on 12 January 2012Climate and Sea Level: An Emerging Hockey Stick
Note: A comment questioning SLR predictions was redirected to this How much will sea levels rise in the 21st Century?, more appropriate, thread. Please respond there if such is your interest. -
ClimateWatcher at 16:11 PM on 12 January 2012Sea level rise predictions are exaggerated
Sea level is rising. But rising at a fairly constant rate:
 And we should remember that during the Holocene Climatic Optimum, Greenland encountered significantly more summer sunshine for thousands of years around six thousand years ago, but this did not effect sea level:
 Response:
[DB] Note: This comment was moved from the Climate and Sea Level: An Emerging Hockey Stick thread to this one.
-
Doug Hutcheson at 16:00 PM on 12 January 2012Climate and Sea Level: An Emerging Hockey Stick
The question seems to be when, not if, we will see dynamic changes to the large ice sheets (Greenland and Antarctica). Given that so many indicators are already at or exceeding IPCC estimates, I feel that planning for a pessimistic sea-level outcome this century would be prudent. Can't see much prudence in the political agendae being pursued around the world at present. As we sow, so shall we reap. -
Tristan at 14:36 PM on 12 January 2012Global Warming: Trend and Variation
Perhaps the displacement of the growing billions of boats on the water, all rising with the unlimited bounty of capitalism. Love it! -
Rob Painting at 14:08 PM on 12 January 2012Why does CO2 lag temperature?
Muon - Sphaerica's comments helped clear exp137's confusion, whereas our current rebuttals did not. There is almost always room for improvement, and that's no slight on all our current rebuttals. I don't think that the number of comments is of that much value either - sometimes specific topics are contentious because they decimate well-worn fake-skeptic myths and said fake-skeptics swarm to defend it. The more valuable rebuttals, to my mind, are those that so thoroughly discredit a myth it never really gets going in the first place But YMMV. -
scaddenp at 13:52 PM on 12 January 2012Myth of the Mini Ice Age
James Wilson - your post and my response are here -
scaddenp at 13:45 PM on 12 January 2012It's aerosols
James, responding where this should be. "Notice that the Sulfur emissions are higher in 1980 than they are today. ie if Sulfur emissions reflect sunlight then we should have been freezing in 1980 and cold today. Not the other way around. ie that graph blows the premise of the article." Nonsense - because aerosols are only one of the forcings at play. GHGs are another. See the recent article on Lean and Rind 2008 which look at temperature as function of all forcings. A similar study would be Benestad and Schmidt 2009. "it had the other forcing value in 2007 according the IPPC however it has been scrubbed apparently" This is very close to accusations of fraud. Which is more likely - that IPCC managed to change what they said in printed copies of reports in libraries round the world - or that you misunderstood what it said. Looking at our bound copies, I see that in First Assessment report 1990, CFCs were reported at having positive forcing - a theme repeated in every report since that. Since the IPCC reports are summaries of the published science, this is no surprise since there is no published science that says otherwise. As to effect on stratosphere, well funny you mention that. A warming surface and cooling stratosphere is a fingerprint of GHG warming. CO2 is actually the main player in cooling the upper stratosphere. As to why, that is not so straightforward to understand. In one sense it can directly calculated from the Radiative Transfer Equations (RTEs), but for a qualitative explanation, see here. Whether you understand it or not, the actual measurements of temperature and spectra closely confirm the theoretical prediction from solving the RTEs. As to that paper on aerosols that I linked, read more closely. The satellite does not directly sample aerosols (it couldnt). Instead it deduces them from Aerosol Optical Thickness - which is of course the radiative effects from the aerosols. More detail on this can be found here. Note the references for studies on checking and calibration of the method. I would like to point out that so far you have insisted that aerosols warm based on no evidence at all that I can see, while refusing to accept laboratory and direct emperical evidence ( eg satellite or say Ball R J and G D Robinson, 1982 "The origin of haze in the Central United States and its effect on solar radiation") to the contrary. -
muoncounter at 13:31 PM on 12 January 20122010 - 2011: Earth's most extreme weather since 1816?
Masters strikes yet again: U.S. weather in 2011: unprecedented rains and wet/dry extremes An extraordinary twenty major U.S. cities had their wettest year on record during 2011. This smashes the previous record of ten cities with a wettest year, set in 1996 ... If you weren't washing away in a flood during 2011, you were probably baking in a drought. ... Climate change science predicts that if the Earth continues to warm as expected, wet areas will tend to get wetter, and dry areas will tend to get drier--so 2011's side-by-side extremes of very wet and very dry conditions should grow increasingly common in the coming decades. -
Michael Hauber at 13:29 PM on 12 January 2012Skepticism About Lower Atmosphere Temperature Data
The BEST analysis does not prove the surface temperature record is perfect, and there hsa to be some error in this record. Whether it is 0.0001 or 0.01 I don't know. It seems that whatever the error may be it is not large enough to fundamentally change our view that the globe is warming significantly. But there still could be a large enough error in surface records to at least partly account for why the troposphere is not measusred as warming faster than the surface. A true skeptic would consider the possibility that more than one factor could be contributing to the discrepancy. And perhaps the models aren't 100% correct in their predictions of the atmosphere's vertical temperature profile. Of course if we start changing the vertical temperature profile of the atmopshere this could result in unexpected changes in convection, and therefore in rainfall and severe weather. -
muoncounter at 13:14 PM on 12 January 2012Why does CO2 lag temperature?
It turns out the mechanisms for glacial onset are still uncertain. Timmerman et al 2010: Compared to the rapid glacial terminations, the buildup of glacial ice sheets in the Northern Hemisphere took tens of thousands of years. During the buildup phase, the growing ice sheets were subject to major orbitally induced summer insolation changes, without experiencing complete disintegration. The reason for this behavior still remains elusive. But why another lag post? See the existing 'CO2 lags temperature' rebuttals; both basic and intermediate are quite good - they generated 330 comments. -
Daniel Bailey at 12:57 PM on 12 January 20122012 SkS Weekly Digest #1
You're very welcome, Chris. My pleasure. -
chirhophoros at 12:23 PM on 12 January 20122012 SkS Weekly Digest #1
PS And than you Daniel Bailey. CC -
chirhophoros at 12:22 PM on 12 January 20122012 SkS Weekly Digest #1
Thank you Tom Curtis. I am actually a regular visitor and have been so for some years. I used to post frequently under another name but have not contributed a comment for well over a year (I think). The moderation policy at SkS has been a source of concern to me for a long time. My last contribution to SkS under my former nom de plume comprised an expression of concern about moderation standards (as best as I recall). I decided to write under another name as an experiment. The null hypothesis comprised: SkS would willingly accept a criticism made in good faith in response to a specific invitation to discuss the moderation policy. Following deletion of my comment, I responded to the effect that SkS had confirmed my hypothesis (or strictly speaking, strongly undermined the null hypothesis). As of today, I think the null hypothesis is decidedly strengthened. I'm pleased with the outcome. I should add that I have no huge personal stake in the matter. I don't get a major buzz out of seeing my comments on a blog. These days, I contribute very rarely to any blog because of sheer lack of time. The actual science on SkS is often very thought provoking and challenging - hence, I do check it out at least a couple of times a week if not more. I see myself as a "lukewarmer" and thus quite interested in all aspects of the science. Unfortunately, you run the risk of "preaching to the choir" if you don't maintain a consistently high standard of moderation. My comments were made in good faith - I really don't have the time or inclination to "troll." With best wishes to all for 2012 chirhophorus (formerly chris1204 and chriscanaris) -
Tom Curtis at 11:52 AM on 12 January 20122012 SkS Weekly Digest #1
I'ld like to thank Daniel Bailey (moderator) for restoring chirhophoros' original post. I certainly understand his concern about the use of the discussion of moderation policy as an excuse for trolling. I also understand why he thinks chirhophoros's original post went to far. Never-the-less, his consideration in the interests of discussion on this thread is appreciated. -
Tom Curtis at 11:45 AM on 12 January 2012Skepticism About Lower Atmosphere Temperature Data
Fred Staples @18: 1) The satellite data only has near global coverage, being very restricted in its coverage of the poles. UAH does publish polar data, but RSS does not because the imprecision (error bars) of the data are too large relative to the rest of the globe. 2) The Temperature Middle Troposphere (TMT) channel is poorly named as it includes significant data from the lower stratosphere and the surface (see figure below). As the lower stratosphere is cooling and the surface may not be warming as fast as the middle troposphere, that under reports middle to upper troposphere temperature trends and makes direct comparisons the model predictions of a tropospheric hotspot difficult. Such comparisons require construction of an explicitly weighted function of temperature to match the signal strengths in the TMT channel which you have neither done nor cited. Therefore absent such a weighted model prediction, the TMT comparison is irrelevant. 3) For the Temperature Lower Troposphere (TLT) channel, UAH understates the HADAT radiosonde trend by 10%, the RAOBCORE radiosonde trends by 5%, the RICH radiosonde data by 8%, but overstates the IUK radiosonde trend by 6%. The IUK radiosonde trend is a clear outlier among the radiosonde data sets understating the average trend of the other three sets by 12%. The RSS trend is lower than the UAH trend when compared to the first three radiosonde data sets, but (illustrating the idiosyncracies that can arise with small data sets) overstates it compared the UAH in the IUK comparison.
Based on this, satellite data understates the TLT trend by at least 4%, and probably closer to 10% when compared to radiosondes. Given that the TLT channel still includes surface data, biasing it low, that means the satellited data from RSS is entirely consistent with a tropospheric hotspot. Once adjusted for endogenous factors as per Foster and Rahmstorf 2011, that means the long term trend in tropospheric temperatures is at least equal to the surface trends, and probably greater. The same adjustment for endogenous factors clearly illustrates that UAH is a low outrider, with an adjusted trend of 0.14 C/decade compared to the RSS trend of 0.16 C/decade.
3) For the Temperature Lower Troposphere (TLT) channel, UAH understates the HADAT radiosonde trend by 10%, the RAOBCORE radiosonde trends by 5%, the RICH radiosonde data by 8%, but overstates the IUK radiosonde trend by 6%. The IUK radiosonde trend is a clear outlier among the radiosonde data sets understating the average trend of the other three sets by 12%. The RSS trend is lower than the UAH trend when compared to the first three radiosonde data sets, but (illustrating the idiosyncracies that can arise with small data sets) overstates it compared the UAH in the IUK comparison.
Based on this, satellite data understates the TLT trend by at least 4%, and probably closer to 10% when compared to radiosondes. Given that the TLT channel still includes surface data, biasing it low, that means the satellited data from RSS is entirely consistent with a tropospheric hotspot. Once adjusted for endogenous factors as per Foster and Rahmstorf 2011, that means the long term trend in tropospheric temperatures is at least equal to the surface trends, and probably greater. The same adjustment for endogenous factors clearly illustrates that UAH is a low outrider, with an adjusted trend of 0.14 C/decade compared to the RSS trend of 0.16 C/decade.
-
DSL at 11:40 AM on 12 January 2012Global Warming: Trend and Variation
Did I misread QE? I thought s/he was poking fun at the whole "it's a natural cycle" crowd. -
ms2et at 11:33 AM on 12 January 2012Lean and Rind Estimate Human and Natural Global Warming
Thanks, guys. I now understand why my analogy was a very poor one: TSI correlates well with the other solar variables that I was curious about, so it's appropriate to use it in the regression. -
Daniel Bailey at 11:30 AM on 12 January 2012Why does CO2 lag temperature?
"every time you leave something not explicitly explained, a skeptic will use this as a point of attack against the entire concept"
Those aren't skeptics. Those are fake-skeptics. -
Tom Curtis at 11:09 AM on 12 January 2012Climate Change Denial and the Media - Banishment of Science Reality
A transcript of the podcast can be found by following the link to the ABC at the podcast site. -
exp137 at 11:05 AM on 12 January 2012Why does CO2 lag temperature?
Thanks for the responses everyone. This was seriously informative, and needed. I agree with Rob Painting here, that it would be great to put this together into a post to fill the gap left by focusing mainly on the lag on the warming end of the cycle. From what I've seen, every time you leave something not explicitly explained, a skeptic will use this as a point of attack against the entire concept. Again, thank you very much for your quick and detailed responses. -
Doug Hutcheson at 10:54 AM on 12 January 2012Climate Change Denial and the Media - Banishment of Science Reality
Given the media bias and the fact that I am not a scientist of any flavour (my career was computer programming), I am surprised that I ended up as, I hope, a true sceptic. The processes by which people like me come to understand the science, in spite of the smoke and mirrors, might be interesting to investigate. I guess I have always been truly sceptical of advertising, therefore of much in the commercial MSM, making it easier for me to say 'show me the data'. It also might have something to do with my training in analysis, in that I like to start with the data when framing a software design. OTOH, it might just be chance. -
Albatross at 10:50 AM on 12 January 2012Skepticism About Lower Atmosphere Temperature Data
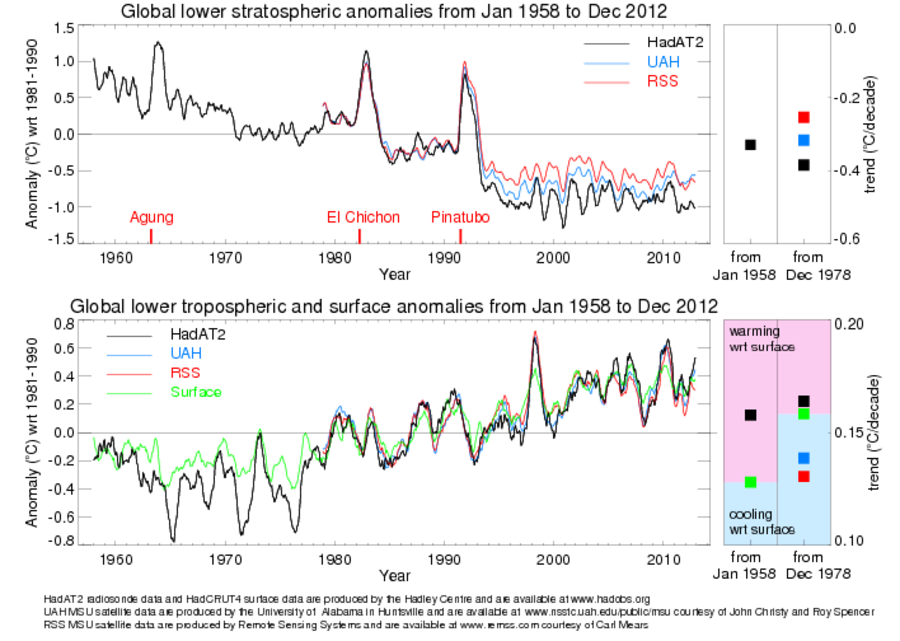
"However, the most likely explanation for UAH showing less warming than models and atmospheric physics predict is that UAH is biased low" This is a legitimate possibility that is supported by the data. A 2006 report on which John Christy (developer of the UAH product) was a lead author concluded that: "These results could arise either because [1]“real world” amplification effects on short and long time scales are controlled by different physical mechanisms, and models fail to capture such behavior; or [2] because non-climatic influences remaining in some or all of the observed tropospheric data sets lead to biased long-term trends; or [3] a combination of these factors. The new evidence in this Report favors the second [2] explanation." [I added the numbering for clarity] This figure from the UK Met office shows UAH (blue square) to be biased low: Caption: HadAT2 radiosonde data (black) vs. UAH (blue) and RSS (red) lower troposphere temperatures, and HadCRUT3 surface temperatures (green) [Source]
Note that the surface rates of warming compare well with RSS and HadAT and RATPAC.
The point was that the satellite data, in particular the UAH data are biased low is a very real possibility that should not be ignored. Yet, Taylor did just that. Satellite data are not the gold standard that "skeptics' imagine them to be, corrections to the satellite data have been numerous and are ongoing. Mears et al. (2011) note that there are still outstanding issues:
"This further confirms our finding for our data set that unambiguously resolving the diurnal drift effect correction and its impacts is likely to be a key determinant in reducing the uncertainty in long term tropospheric temperature changes from MSU/AMSU records."
Also, something else Mr. Taylor and Dr. Michaels decided to not share with their readers is that other satellite products that use different techniques to correct for stratospheric contamination obtain much higher rates of warming in the mid troposphere than do UAH, see here.
Caption: HadAT2 radiosonde data (black) vs. UAH (blue) and RSS (red) lower troposphere temperatures, and HadCRUT3 surface temperatures (green) [Source]
Note that the surface rates of warming compare well with RSS and HadAT and RATPAC.
The point was that the satellite data, in particular the UAH data are biased low is a very real possibility that should not be ignored. Yet, Taylor did just that. Satellite data are not the gold standard that "skeptics' imagine them to be, corrections to the satellite data have been numerous and are ongoing. Mears et al. (2011) note that there are still outstanding issues:
"This further confirms our finding for our data set that unambiguously resolving the diurnal drift effect correction and its impacts is likely to be a key determinant in reducing the uncertainty in long term tropospheric temperature changes from MSU/AMSU records."
Also, something else Mr. Taylor and Dr. Michaels decided to not share with their readers is that other satellite products that use different techniques to correct for stratospheric contamination obtain much higher rates of warming in the mid troposphere than do UAH, see here.
-
Rob Painting at 10:30 AM on 12 January 2012Why does CO2 lag temperature?
Sphaerica - You have the makings of a post/rebuttal there. Maybe a few graphics to explain how it fits together. I only mention this because it is a legitimate area of confusion, and perhaps we haven't adequately explained the process. -
Tom Curtis at 10:13 AM on 12 January 2012Lean and Rind Estimate Human and Natural Global Warming
skept.fr @14, so long as the change in relative strengths in different bands is consistent across all solar cycles, it will correlate with TSI, and its effect on temperature will be included in the regression. That effect may have the same sign as the effect of change in TSI, and hence strengthen the TSI signal. Alternatively it may be of opposite sign, and weaken the signal. It will still be incorporated in the regression. It is only if the effect is largely random with respect to the strength of TSI that the regression will not include it as either a strengthening or weakening effect on the TSI, but I am unaware of any suggested solar mechanism effecting climate that is not correlated with TSI. -
Bob Lacatena at 09:49 AM on 12 January 2012Why does CO2 lag temperature?
exp137, Okay, one more point. I'm actually really glad that you brought this up, because it highlights a very, very important aspect of CO2, and that is that because of the logarithmic nature (i.e. double CO2 to get the same incremental increase in temperature, so 2x = 1, 4x = 2, 8x = 3, and so on) the effects of increasing CO2 are more evident when you raise it from a low value, and less evident when you first drop it from a high value. This has huge implications on the idea of adding it, and somehow later trying to reduce it and return temperatures to normal. What this inevitably means is that it is easier to raise temperatures by increasing CO2 than it is to drop them by decreasing CO2. As such, the impact of CO2 at the start of a glaciation is far less evident than the impact on the start of a glacial termination. Also... it is going to be a whole lot easier for man to raise temperatures by increasing CO2 than to draw them down by extracting it. The bang from the first X gigatons added to the atmosphere is far greater than the bang from the first X gigatons somehow subtracted (assuming we can come up with a cost effective way of doing so). -
Brian Purdue at 09:37 AM on 12 January 2012Climate Change Denial and the Media - Banishment of Science Reality
tmac57 – The Young Australian Skeptics are doing some really good work too. They carried this review of John Cook and Haydn Washington’s book http://www.youngausskeptics.com/2011/12/climate-change-denial-book-review/ -
Bob Lacatena at 09:36 AM on 12 January 2012Why does CO2 lag temperature?
exp137, I should clarify something. I rather inadvisedly said "fighting against rather than in concert with CO2 changes." That didn't come out as I intended, and is incorrect. CO2 is a feedback that enhances the temperature drop. The point I intended to make was rather that because CO2 levels are high, the high temperatures that result help to hold back the expansion of the ice sheets. At the same time, because of the logarithmic nature of CO2, a "draw down" of CO2 levels and temperatures is much harder to enact than an increase. One must get more CO2 out of the atmosphere, at the start of glaciation, to get the same change in temperature. As such the effects of CO2 changes at the initial stages of glaciation are small/sluggish, the opposite of the result of changes in CO2 at the start of a glacial termination. This makes it look like CO2 provides a bigger "kick" to a glacial termination (it does, at the start, as opposed to glaciation where that kick is harder at the end). -
scaddenp at 09:14 AM on 12 January 2012Why does CO2 lag temperature?
My understanding of the role of CO2 in Pleistocene glaciations is twofold. 1/ One it is a slow feedback amplifying effect of solar (which would be too weak for the scale of temperature change by itself). 2/ It is part of the mechanism by which changes in NH also causes warming/cooling in the SH. Note that albedo is also major player in the feedback the amplifies the solar change. The relative importance of the forcings are discussed in Ch 6 of the IPCC WG1 report. -
tmac57 at 09:12 AM on 12 January 2012Climate Change Denial and the Media - Banishment of Science Reality
Nice to see some recognition of some legitimate Skeptics.Eran Segev and The Australian Skeptics do some really good work. -
John Cook at 08:56 AM on 12 January 2012Just Science app shows climate change is happening in pictures anyone can understand
No Android version?? Sniff, whimper?? Nick, welcome to my world :-) -
Bob Lacatena at 08:42 AM on 12 January 2012Why does CO2 lag temperature?
exp137,...in which CO2 does appear to drive temperature...
This is a bad way to look at things. Talk of a "driver" is a trap, or rather a denier's canard. In a natural climate there are very few true forcings. Orbital forcings are one. Change in solar output is another. A massive injection of CO2 due to, for example, volcanic or anthropogenic activity are also true forcings. A massive injection of dimming aerosols due to volcanic activity or a huge asteroid strike is yet another. These can be true "drivers." Outside of that, almost all of the possible influencing factors are interlocked. Atmospheric H2O rises/falls quickly with temperature changes, and drags temperatures further up/down. CO2 rises/falls similarly but less quickly, also dragging temperatures further up/down. Changes in temperatures can contract/expand ice sheets, which reduce/expand albedo, which drag temperatures further up/down. Virtually everything in the normal ebb and flow of climate is an interlinked feedback. Actual drivers vary, but the definition of the "driver" is more complex than simply "is this a driver?" The true "driver" somehow changed due do an event outside of the normal climate system... a quirk in the slow change in orbit, a massive flurry of volcanic activity, who-knows-what in the sun, or... a fossil-fuel based civilization. Albedo (snow/ice) is never a "driver"... orbital forcings cause that change, although orbital forcings don't themselves directly influence temperature, but rather the effects on snow/ice extent do so. CO2 is a "driver" only when it is "un-naturally" changed (volcanoes, humans). Otherwise it is a feedback. But the reason for the change in no way changes the efficacy of the forcing. If a car runs you over, it doesn't matter if someone was behind the wheel driving it or not, it still has the same effect. -
skept.fr at 08:42 AM on 12 January 2012Lean and Rind Estimate Human and Natural Global Warming
#11 : I think my point was clear, but whatever the (non) influence of spectral / total solar irradiance on Earth climate, you've not to say that TSI variance is correlated to UV-EUV variance if it is not in reality or if scientists debate about the nature and scale of this correlation (see also Lockwood et al 2010, Lukianova et Mursula 2011 ). There's no reason to doubt that GHGs are the main driver of T for the past 50 yrs, but also no reason to overestimate our level of confidence in solar physics understanding, still low to medium. They are many debates in solar physics community but 99% of solar specialists interested in climate do not think the TSI could have a warming influence on Earth for cycle 21-23 (I think the 1% is Scafetta alone :-)). So, LR08 and FR11 are not in question for their major conclusion. #12 Who is "clinging to UV as a significant cause of global warming"? Certainly not me, you should not be so "warming-centered" in your interpretations. I think the following sentence in the article "Any solar effect (either direct or indirect) which is correlated to solar activity (i.e. solar irradiance, solar magnetic field [and thus galactic cosmic rays], ultraviolet [UV] radiation, etc.) is accounted for in the linear regression" is not enough precise. If you look for example at Harder et al 2009 , figure 1, giving results for the SIM-SORCE instrument (=measurement of spectral irradiance), you observe that changes in the different bands are sometimes orthogonal (200-400 nm bands = UV are down whereas others in visible or near IR are up). So I think the linear regression used by LR08 informs us about TSI (what is de facto linearily regressed in regards of T), but not specially about particular components of this total irradiance. Maybe I'm wrong, I'm not familiar with statistics (nor solar physics by the way). If you agree with me (with the papers I linked) that spectral and total irradiance are not necesseraily correlated in a cycle (or in trend of cycles), this is just a suggestion for a more precise formulation. Feel free to ignore it if unsound. -
Bob Lacatena at 08:28 AM on 12 January 2012Why does CO2 lag temperature?
exp137,...there doesn't appear to be much input from CO2 at all.
No? What about the fact that the glacial onset takes tens of thousands of years longer than a termination, because the orbital forcings/change in albedo are fighting against rather than in concert with CO2 changes? Another factor, of course, is one of pure area... on a sphere (the earth), there is more area at a latitude closer to the equator than a pole, and the sunlight is more direct and seasonally constant towards the equator, with the upshot that albedo changes are stronger when the ice sheet is further south. This in turn means that when the ice begins to retreat (during a termination), the strength of change in albedo is greater and faster at the beginning of the change than at the end as compared to the reverse, the growth of ice from the pole southward, when the growth (in area) is slow at first with a greater affect near the end. A model for the relative influences cannot possibly be as simple as you'd like, but one problem is exactly that you are eyeballing graphs and using a rule-of-thumb approach to the problem. It's easy to come up with any inference that appeals to you with that approach. To go over the glacial onset... orbital forcings cause summers to be shorter and cooler. This leads to a very, very slow build up of the snow and ice extent in the northern hemisphere. Each year, the snow melts not quite as far back as it did the winter before. Each time this happens, the total amount of sunlight reflected back to space without warming the planet is greater. At first, the difference is small, because the change happens at a high latitude. The total change in area is small, and the angle of incidence and W/m2 is less because of how the light strikes the earth at the poles. As the ice sheets extend further south, the effect becomes more and more severe. As temperatures drop due to this forcing, the amount of CO2 (and H2O) in the atmosphere falls, which causes temperatures to drop even further. There is no inconsistency in this. -
exp137 at 07:41 AM on 12 January 2012Why does CO2 lag temperature?
scaddenp: I don't expect the temperatures to not drop at all, it's just that in the case of glacial cycles there doesn't appear to be much input from CO2 at all. This is a frequently used case by climate change skeptics that CO2 is not a climatic driver (or a very weak one at best) but instead simply follows temperature. I'm familiar with other cases in which CO2 does appear to drive temperature, such as the PETM and the Ordovician glaciation, but I just would like to understand this case better. I guess what I'm really looking for is a model that shows the relative influences of both insolation and CO2 during the Pleistocene glaciations. Because in this case, at least, it's obvious that changing solar input is the primary driver, but the role of CO2 isn't very clear. -
scaddenp at 07:31 AM on 12 January 2012Myth of the Mini Ice Age
James, I think moderator patience with off-topic posts (nothing to do with the topic of this post). I suggest that you make any further response here - its aerosols. A few seconds with the search function on top left is best way to find appropriate threads. -
Riccardo at 07:22 AM on 12 January 2012Positive feedback means runaway warming
William Haas in climatology by runaway warming (or cooling) one does not mean an endless warming (cooling) like what you get mathematically from the feedback factor f=1/(1-g) for g~1. Usually it indicates that above a certain threshold the process will not end untill the system finds a new equilibrium in a radically different state. The feedback factor quoted above is just a first order aproximation which has, by definition, limited validity. When the response becomes large, higher order terms need to be taken into account. More details here. -
Rob Honeycutt at 07:20 AM on 12 January 2012Human CO2 is a tiny % of CO2 emissions
pbjamm... WOW! I was trying to find a link to Norville Barnes in the Hudsucker Proxy saying "WOW!" but alas... -
pbjamm at 06:52 AM on 12 January 2012Human CO2 is a tiny % of CO2 emissions
Was not sure where else to post this. The (evil/job destroying) EPA has a GHG Data Page. Pretty nifty. If this has made an appearance on SkS before I have missed it. -
scaddenp at 06:15 AM on 12 January 2012Global Warming: Trend and Variation
QE - even natural variations must still obey the laws of physics. If you think current warming is natural, then where is the extra heat coming from? If the heat is from ocean, then why is ocean heat content increasing? If you wish to discuss further, then please go to Its a natural cycle. -
scaddenp at 06:09 AM on 12 January 2012Why does CO2 lag temperature?
exp137 - if two of the forcings go negative while GHG remain stable, then why would you expect temperature not to drop? Explicitly, when onset occurs, direct insolation from sun is dropping in NH (cooling), while CO2 concentration are possibly still rising - but very slowly as there is a considerable lag. On the other hand, ice albedo is a rapid feedback and the two together drop NH temperatures, freeze the methane sources, cool northern oceans which in turn leads eventually to lower CO2 and SH cooling as well.
Prev 1325 1326 1327 1328 1329 1330 1331 1332 1333 1334 1335 1336 1337 1338 1339 1340 Next


