


 Arguments


Recent Comments
Prev 1341 1342 1343 1344 1345 1346 1347 1348 1349 1350 1351 1352 1353 1354 1355 1356 Next
Comments 67401 to 67450:
-
Tom Curtis at 03:28 AM on 29 December 2011UAH Misrepresentation Anniversary, Part 2 - Of Cherries and Volcanoes
muoncounter @28, I think your point is well made. However, rather than say there was not two volcanic coolings (there where) I would say that Christy is doubly inconsistent in ignoring ENSO effects as he needs to ignore ENSO effects to find his first cooling. -
skept.fr at 03:28 AM on 29 December 2011Foster and Rahmstorf Measure the Global Warming Signal
#81 muoncounter : Why is this level of scrutiny - and semantic precision - not applied to the pseudo-skeptics who routinely make unsupported claims? It is, and notably here on SkS. The better way to convince your reader is to be blameless. Concerning FR2011, here are some supplementary suggestions for understanding why it is not an attribution study: a) The solar forcing is reduced to TSI signal, but we know there are other factors influencing climate (for example spectral changes in UV, not correlated to total irradiance, and their effect on stratosphere-troposphere coupling). Furthermore, we don't know the precise time response of climate (mainly oceans) to solar forcing. So the T trend 1979-2011 may contain noise from past forcing from solar origin. Only a physical model can tell us. b) The unforced variability is ignored except for ENSO. See our long discussion above about all others modes of variability, and the possibility that coupling / decoupling of these modes create multidecadal variability, not just year-to-year change. Again, only a physical model can answer, see my reference to GEOMAR as an example of such model. c) the tropospheric aerosols (mainly from anthropogenic source) is ignored, so on the 32 yrs, we don't know what part of the signal is due to changes in aerosols inside the period and what part to changes in GHGs. Here too, a physical model would use estimation of aerosol emissions and fully calculate their direct/indirect effects so as to bring a clearer picture. The Christy point (other discussion) was about a precise quantification of GHGs signal - not about its existence, not even about its first order importance (even if Christy is skeptic about that, the press release is cautious). So the reference to FR2011 cannot answer to this level of precision. -
markx at 03:27 AM on 29 December 2011Medieval project gone wrong
I appreciate the replies. (and I did read the original article: I hope you will forgive me or even commend me for not immediately accepting all I read. Hence the questions). Good points re Lamb 1995, thanks. The CET is discussed in Judith Curry’s page (a very interesting read, if somewhat rambling - that perhaps a function of apparently being collected as snippets over many months) http://judithcurry.com/2011/12/01/the-long-slow-thaw/ Re the MWP: Increased solar radiation and less volcanic activity are hypothesised as a likely cause of the MWP, but what is the explanation for the variations in the timing of this warming? It does seem strange. It is still interesting to me that these warming occurrences apparently did happen also in the southern hemisphere.MWP sensu lato in New Zealand adds an important new datum to the debate concerning its large-scale occurrence and supports Broecker’s [2001] argument that it was indeed global.
SE bars on both the Tasmanian and New Zealand data both indicate the possibility of many ‘as high’ or higher temperature peaks over that recent 1000 year period….it is apparent that the current warming trend over Tasmania is still a significant event when viewed in the context of multi-decadal variability covering the past 2000 years. In that period it remains the warmest event to a marginal degree, although a much longer warm period is indicated in the AD 900±1500 interval. The early 1900s period likewise remains a significant cold event, …………. little indication for a ``Little Ice Age'' period of unusual cold in the post-1500 period. Rather, the AD 1500±1900 period is mainly characterized by reduced multi-decadal variability.
Indeed, the Tibetan data too shows several possible “much higher than normal” temperature peaks in “their” MWP of about 700 to 1100 AD. And I’m sure at least some of these would have made it onto the ‘extreme weather’ stories of recent times! With all this media attention on alarming weather stories, you surely can scarcely be surprised if the first question is, “ Has this ever happened before?”. -
muoncounter at 02:56 AM on 29 December 2011UAH Misrepresentation Anniversary, Part 2 - Of Cherries and Volcanoes
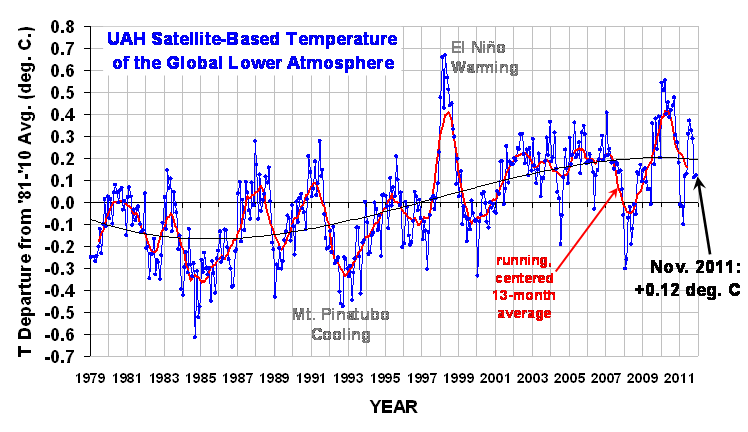
Tom C#25: There's a problem with the el Chicon eruption (1982): Because of the simultaneous eruption and El Niino, the climatic system felt the impacts of both, and it was difficult to separate their effects on temperature. Normally a large eruption like this would cool the global climate, especially in the summer, but during the first year after the El Chich´on eruption, no large cooling was observed, as the El Ni˜no produced large compensating warming. That's very well illustrated in FR Fig 6, which shows AOD with a calculated effect of -0.2 to -0.3C vs. MEI with +0.3 to +0.4C for the period immediately after the el Chicon eruption. If you look at the raw data (FR fig 1), the bulk of the cooling on UAH and RSS doesn't occur until 1985, a full 3 years after the eruption. That's not the volcano. The UAH graph shows a large cooling (-0.25 C) centered around 1985 with a 3-4 year duration, yet this is not labeled by UAH as 'el Chicon cooling'; the 1993 cooling is clearly labeled 'Mt. Pinatubo'. So Christy's contention that there are two volcanic coolings 'early in the record' is not correct. -
DaneelOlivaw at 02:53 AM on 29 December 2011Foster and Rahmstorf Measure the Global Warming Signal
muoncounter, relax. This level of scrutiny is applied to fake sceptics. Although, since their claims are for the most part so deattached from reality, one does not even need to apply much scrutiny at all to tell they are bunk. "A valid step towards establishing the most likely causes is to eliminate less likely factors from consideration. " Yeah, but... were volcanic aerosols or ENSO really "likely causes" of global warming? Volcanic aerosols have actually a cooling effect so they are excluded from the get go. ENSO is cyclical and cannot increase the energy in the earth system that is documented and that the ocean surface is hotter than the deeps. And we know that solar activity is actually decreasing while temperatures are on the rise. So I don't think that what FR2011 set to do was to eliminate those factors as causes of global warming. If that were the case, it would be a boring and redundant paper. In my view what they tried to do is to, knowing that global warming is primarily anthropogenic, remove the noise produced by other factors in order to see that anthropogenic signal more clearly. This is a subtle point, I understand that! -
Composer99 at 02:45 AM on 29 December 2011UAH Misrepresentation Anniversary, Part 1 - Overconfidence
victull: If Christy & Spencer's statements in press releases and blog posts are found to be false (that is, contradicted by the available evidence) or misleading (that is, liable to lead readers to incorrect conclusions - whether deliberately or inadvertently), there is nothing inappropriate in (a) describing their statements as such and (b) calling them out for it. -
JamesWilson at 02:30 AM on 29 December 2011Polar bear numbers are increasing
Seal populations are through the roof? Why? Seal hunting basically collapsed when the EU banned the import of seal skins. It used to be the Canadians killed thousands of seal pups every year for their white pup fur. Polar Bears aren't the only change. Certain fish populations in the Grand Banks have severely dropped as the seals eat them. Will the Polar Bear populations stay up as the seal population becomes more balanced? Possibly. It will likely end up higher than it was but not at the current extremely elevated levels. -
skept.fr at 02:24 AM on 29 December 2011UAH Misrepresentation Anniversary, Part 2 - Of Cherries and Volcanoes
#22 Tom : no better wording for Dana, sorry. The precise quantification of GHGs specific warming is not really possible with models in their actual states (different models will produce different estimates because they parametrize differently many details or begin their run with slightly different initial conditions), so I think the problem is not the formulation itself. The point of Christy was just non-sensical rhetoric: there is no real uncertainty about GHGs as the first known factor of warming since 1979 (and for the next decades), to require a precise quantification is simply a kind of dubious distraction. Let's say I've an epidemiological model of flu, whose conclusion is that the past epidemics had killed 10-50 million, and the next one will kill 2-5 million. It is clearly unimportant to ask for a "better quantification", because the major conclusion about the threat and its cause is self-evident. (A short epistemological reflexion on the notion of "proof" advanced by Christy would also have been of interest for SkS readers, IMO.) -
muoncounter at 02:17 AM on 29 December 2011Foster and Rahmstorf Measure the Global Warming Signal
skept.fr#80: Your quote from 9.1.2 misses the actual definition of attribution in that section: ‘Attribution’ of causes of climate change is the process of establishing the most likely causes for the detected change with some defined level of confidence ... A valid step towards establishing the most likely causes is to eliminate less likely factors from consideration. That is the primary result of the method used in FR2011. ... in practice attribution of anthropogenic climate change is understood to mean demonstration that a detected change is ‘consistent with the estimated responses to the given combination of anthropogenic and natural forcing’ and ‘not consistent with alternative, physically plausible explanations of recent climate change that exclude important elements of the given combination of forcings’ FR2011 demonstrate that the detected change is inconsistent with three physically plausible natural forcings. That is the second part of the above 'in practice attribution.' Why is this level of scrutiny - and semantic precision - not applied to the pseudo-skeptics who routinely make unsupported claims? To say 'its the sun' or 'its cosmic rays' is to make claims of attribution: Where is this rigorous standard in those cases? -
skept.fr at 02:05 AM on 29 December 2011UAH Misrepresentation Anniversary, Part 2 - Of Cherries and Volcanoes
For an interesting background, one can read Thorne et al 2011, Tropospheric temperature trends: history of an ongoing controversy . Their conclusion is clear and opposite to the UAH press release: "Overall, there is now no longer reasonable evidence of a fundamental disagreement between models and observations with regard to the vertical structure of temperature change from the surface through the troposphere. This is mainly due to a much better understanding of the real level of uncertainty in estimates of past changes and expectations from climate models." -
Tom Curtis at 02:04 AM on 29 December 2011UAH Misrepresentation Anniversary, Part 2 - Of Cherries and Volcanoes
Further to my 24, a large cooling or warming event, even of short duration, can effect trends over short (30 year) time spans if located near to the start or end of the sequence. F&R2011 show volcanic effects as introducing a 0.041 C/decade warming effect to the overall UAH record (see table 1 of main post) so Christy is in fact correct. He is also cherry picking by ignoring the impacts of ENSO and TSI on the trend over the same period. -
Tom Curtis at 01:59 AM on 29 December 2011UAH Misrepresentation Anniversary, Part 2 - Of Cherries and Volcanoes
muoncounter @23, Spencer is referring to El Chichon and Mount Pinatubo.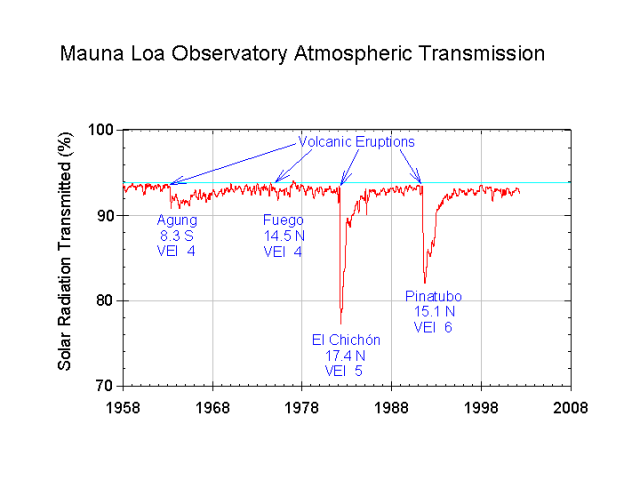
-
muoncounter at 01:55 AM on 29 December 2011UAH Misrepresentation Anniversary, Part 2 - Of Cherries and Volcanoes
Isn't this a whopper of an error? "Part of the upward trend is due to low temperatures early in the satellite record caused by a pair of major volcanic eruptions. Because those eruptions pull temperatures down in the first part of the record, they tilt the trend upward later in the record" A pair of major eruptions? Pinatubo (1991) is not 'early' in the temperature record, which starts in 1979. The resulting global cooling lasted all of a year and a half. Surely he's not referring to Mt. St Helens, as that hardly produced any cooling on a global scale: While the Mount St. Helens eruption of 1980 was very explosive, it did not inject much sulfur into the stratosphere. Therefore it had very small global effects There is no 'pulldown' in the record, nor would a short-term cooling 'tilt' the trend for the later period. That's just ridiculous. -
Tom Curtis at 01:54 AM on 29 December 2011UAH Misrepresentation Anniversary, Part 2 - Of Cherries and Volcanoes
skept.fr @15, F&R2011 is not an attribution study. However, it does have certain features in common with attribution studies, ie, picking out the contribution of various features to the overall temperature record. Those features do what Spencer says it is not possible to do, ie, to pick out how much of the record is due to certain features. Therefore F&R2011 is a clearly relevant paper in rebutting Spencer's claim. Now, if you or anyone else can come up with a suitable form of words to capture this nuance without being too wordy, I'm sure Dana would love to incorporate the revision. But if you cannot come up with suitable words which do not rival in length the current section as is (and nobody has to date), then this has all the appearance of an irrelevant nit pick. -
UAH Misrepresentation Anniversary, Part 2 - Of Cherries and Volcanoes
Arkadiusz - I would have to consider your last post to be approaching a Gish Gallop, a series of half-truths and misrepresentations. You quote an article that in turn misinterprets Dicky et al 2011, where they examine a number of cyclic influences, pointing out that "In all ... cases, their signals would be much smaller than the anthropogenic greenhouse gas effect on Earth’s radiation budget during the coming century." Hardly a disproof of anthropogenic warming. You follow this by pointing at unsourced graphs without definitions or context, apparently claiming that length of day is a major driver of climate (in contradiction to Dickey), Koznetsova's "climastrology" claims of long term cycles (basic curve-fitting without physical mechanisms), introduce an apparently unrelated argument about ocean upwelling, and trail off without having said anything at all. Make an argument, actually state something, supported by data and peer-reviewed papers, Arkadiusz - what you are doing now is (IMO) just adding to the noise level and trolling. -
John Hartz at 01:48 AM on 29 December 2011UAH Misrepresentation Anniversary, Part 2 - Of Cherries and Volcanoes
According to Eli Rabett, Spencer and Christy have yet to make public the software they use to convert the data collected by the NASA satellites into their estimates of the temperatures of the lower troposphere (TLT) and of the mid troposphere (TMT). As Rabett suggests in “MacIntyre and Mosher at the door, hand over the rent.” posted Dec 21, 2011 on his blog, Rabett Run, someone in the US ought to file an FOIA request for the software so it could be scrutinized by experts with microwave and programming experience. -
skept.fr at 01:47 AM on 29 December 2011Foster and Rahmstorf Measure the Global Warming Signal
#16 muoncounter (off-topic there, so I post my answer here) : FR2011 is not an attribution study, so you're correct, "let's not start again". Readers will usefully refer to the IPCC 9.1.2 for the common characteristics and differences between attribution and detection. Notably: The approaches used in detection and attribution research described above cannot fully account for all uncertainties, and thus ultimately expert judgement is required to give a calibrated assessment of whether a specific cause is responsible for a given climate change. The assessment approach used in this chapter is to consider results from multiple studies using a variety of observational data sets, models, forcings and analysis techniques. The assessment based on these results typically takes into account the number of studies, the extent to which there is consensus among studies on the significance of detection results, the extent to which there is consensus on the consistency between the observed change and the change expected from forcing, the degree of consistency with other types of evidence, the extent to which known uncertainties are accounted for in and between studies, and whether there might be other physically plausible explanations for the given climate change. Having determined a particular likelihood assessment, this was then further downweighted to take into account any remaining uncertainties, such as, for example, structural uncertainties or a limited exploration of possible forcing histories of uncertain forcings. The overall assessment also considers whether several independent lines of evidence strengthen a result. So, you need a complex array of evidences – not just a paper grossly detrending for 3 factors on 3 decades or another running with an EMIC – to produce a correct assessment in detection-attribution. Christy and Spencer are criticable for their imprecise rhetoric, and the correct answer to such a behavior is to be very precise in what is said. At least, it is what I judge convincing. -
John Hartz at 01:46 AM on 29 December 2011UAH Misrepresentation Anniversary, Part 2 - Of Cherries and Volcanoes
@mace #12: Your point begs the question: Why does Spencer post his satellite derived temperature data on his private website, and not on the website of the UAH’s Earth System Science Center? -
Tom Curtis at 01:40 AM on 29 December 2011UAH Misrepresentation Anniversary, Part 1 - Overconfidence
victull @9, it must certainly be your legal training, for as a life time speaker of the Queen's English I can tell you that "false" means "not true", and not "deliberately false". Likewise "misleading" means "likely to mislead" and not "deliberately misleading". What is more, this is evidently the case, for we do not see the "deliberately" in "deliberately false" and "deliberately misleading" as redundant. The issue on Spencer and Chrity's acceptance of the red corrections is complicated. In both cases the errors in need of correction where found by other teams. In the first case, Wentz and Schabel (1998) found the error. They state in their abstract:"The 17-year lower-tropospheric temperature record derived from the satellite Microwave Sounding Unit (MSU) shows a global cooling trend, from 1979 to 1995, of -0.05 K per decade at an altitude of about 3.5 km. ... Here we identify an artificial cooling trend in the satellite-derived temperature series caused by previously neglected orbital-decay effects. We find a new, corrected estimate of +0.07 K per decade for the MSU-based temperature trend, which is in closer agreement with surface temperatures."
(My emphasis) The correction found by Wentz and Schabel resulted in a 0.12 C/decade correction in the trend. Two years later Spencer and Christy corrected their record for the error, but their correction only compensated for a 0.1 C/decade artificial cooling trend. There is nothing untoward in that. The difference in the corrected trend between them and Wentz and Schabel may be quite legitimate, and certainly the two years for correction (one of which is required for the process of publication) is understandable given the complexity of the calculations involved. At the same time they implemented a -0.7 C/decade correction in the opposite direction for diurnal effects. Combined with the lower correction, this changes the original correction from a 0.12 C per decade correction to a 0.03 C/decade correction. The problem is that, as shown by Mears and Wentz (2005), the second adjustment by Spencer and Christy itself was in error, who report:"For most latitudes, the Christy et al. TLT correction is of opposite sign from our TLT correction and from the corrections applied by either group for the middle/upper troposphere."
and:"Surface and near-surface effects will be even more dominant for TLT, whose vertical weighting function peaks several kilometers closer to the surface and has a surface contribution roughly double that of MSU2. Thus, we expect the TLT diurnal cycle and diurnal correction to be similar in shape to the MSU2 diurnal cycle, but with larger amplitude. This is consistent with the diurnal correction we calculate from the climate model and is inconsistent with the Christy et al. correction."
We might think it takes a special talent to introduce an error consisting of a meticulously applied error in sign which is opposite in value for the same effect that you apply elsewhere and which contravenes basic physical understanding. Especially when introduced as a cooling correction which obviates a very large warming correction found necessary in your data so that you can report that:"The net global effect of these revisions (version D) is small, having little impact on the year-to-year anomalies."
instead of having to report a single correction which changed your trend from negative to positive, and made it greater than the surface trend. However, that may be entirely coincidental. Mears and Wentz also report:"To estimate what portion of the trend difference between our respective results is caused by the difference in diurnal correction, we performed a set of numerical experiments, where we substituted the Christy et al. diurnal correction into our analysis, and/or where we fixed the values of the target factors to the values used by Christy et al., allowing us to mimic different parts of the Christy et al. merging procedure separately and in combination. The results of these experiments suggest that the difference in diurnal correction accounts for over 50% of the difference in trends for global averages and over 70% of the difference in trends for tropical averages."
The reported difference in trend for the global average was 0.1 C/decade, so Mears and Wentz find the the correction needed to be at least 0.05 C/decade. Shortly after, Spencer and Christy implemented a correction of 0.035 C/decade. It should be noted that if the corrections actually found by other teams had been implemented, the UAH trend to date would be 0.173 C/decade or higher than the surface trend. The -0.035 C difference combined with the net -0.074 C/decade corrections discovered by Spencer and Christy show a definite tendency to corrections reducing the measured trend by Spencer and Christy. -
UAH Misrepresentation Anniversary, Part 2 - Of Cherries and Volcanoes
I have replied regarding the F&R 2011 study on the (far) more on-topic Foster and Rahmstorf thread. Perhaps we could reserve this thread for discussing the UAH record, and Spencer and Christys representations thereof? -
Foster and Rahmstorf Measure the Global Warming Signal
Redirected from the UAH Misrepresentation Anniversary, Part 2 - Of Cherries and Volcanoes thread: I would have to agree with DaneelOlivaw on the point he raised in that thread: F&R 2011 isn't an attribution study, but rather a separable components study which subtracts attributable influences. And, as they clearly demonstrate, subtracting time-dependent influences directly attributable to TSI, volcanic aerosols, and ENSO fluctuations leaves a linear trend behind. This demonstrates that the linear trend is not due to TSI, volcanic forcing, or ENSO variations. Now, that linear trend is likely a combination of a few different factors - well mixed GHG's, countered somewhat by lower atmospheric aerosols, various feedback effects (albedo and the like), etc. F&R, stating that "most likely these are exclusively anthropogenic", are making a very reasonable statement. The physics of greenhouse gases and fairly basic spectroscopy support a linear trend of just about that size, and claims otherwise require both dismissing that spectroscopy and introducing some Mysterious Unknown Forcing (MUF). The conclusions of the paper are that the linear trend is not due to the various examined additional forcings, and that with those additional forcings accounted for the linear trend is both clearer and statistically valid over much shorter time frames. But, while claiming the linear trend is due to non-anthropogenic factors requires invoking leprechauns or the like, F&R 2011 isn't making attribution claims about the linear trend... -
Arkadiusz Semczyszak at 01:28 AM on 29 December 2011UAH Misrepresentation Anniversary, Part 2 - Of Cherries and Volcanoes
A very "extensive post", really showing particulars errors UAH - Spencer and Christy. ... but, as usual, says "too much" of their - Spencer and Christy - general conclusions. „Many papers indeed have claimed to find a human “fingerprint”, but upon close examination the evidence is simply consistent with human caused warming — while conveniently neglecting to point out that the evidence would also be consistent with naturally caused warming.” - write Spencer. “... because “real world” amplification effects on short and long time scales are controlled by different physical mechanisms, and models fail to capture such behavior ...” - write Christy. ... It is these: “ ... a number of attempts to downplay the amount of warming.” As a decisive evidence of the lack of impact - the climate - natural changes linked with the Earth and the Sun “... during the past 80 years ...”, presented in this year: Dickey and Marcus from NASA's along with de Viron, from the Universite Paris. ““Our research demonstrates that, for the past 160 years, decadal and longer-period changes in atmospheric temperature correspond to changes in Earth’s length of day if we remove the very significant effect of atmospheric warming attributed to the buildup of greenhouse gases due to mankind’s enterprise,” said Dickey. “Our study implies that human influences on climate during the past 80 years mask the natural balance that exists among Earth’s rotation, the core’s angular momentum and the temperature at Earth’s surface.” This was to confirm this figure. But when we "will correct" this figure - including figure (different data from ca 1980) that we get long-term cyclic anti-correlation (LOD- Glob. Temp.) - in "long time scales" - to this day. About this is a R. Spencer blog - comments - Earth rotation - by salvatore del prete. I recommend reading of Influence of solar variability on rotation and climate of the Earth, Kuznetsova (2010): “We suggest a possible explanation of observed unexplained increasing in the Tnh [Temperature North Hemisphere] for the interval 1905-1940 and its subsequent decrease for 1940-1976 with rate 0.75 deg.C/100yr (in spite of the fact that the release of CO2 increased rapidly; at that time we had debates about the coming of a new ice age) by variation in w with period of 72 yr.” “We present arguments of solar-lunar origin of the power cycle, which is approaching to a maximum for now.” “The Poyting flux coming to polar cap leads in the end to heating of polar ionosphere and atmosphere, temperature contrast between two caps, intensification of the inter-hemisphere heat machine in the upper atmosphere ...” And also affect the clouds cover and natural aerosols of atmosphere. Next - for this reason: - heat comes now further (and bigger number of heat) in the North (the North Atlantic is narrow - like "neck of the bottle"). Arctic temperatures, Canada and Europe growing faster, also activated equatorial zone the deep upwelling - natural sources of GHG increase ... ... “fingerprint” this process “... be consistent with naturally caused warming ...”? So, if we examine the (a comprehensive) other natural factors (not just the TSI, ENSO and volcanoes - supposedly the greatest - the most important natural factors), it ...Response:[DB] Having read this comment several times now, I must agree with KR below: you use a lot of words to say nothing at all. As such, your entire comment devolves to Gish Gallop, handwaving off-topicness.
Future comments constructed as such will simply be deleted.
-
muoncounter at 01:27 AM on 29 December 2011Soares finds lack of correlation between CO2 and temperature
desertphile: As I explain to my classes, yes, its possible that you've overturned modern physics. If you really believe that, publish your results and buy your ticket to Stockholm. However, you might want to double-check your results first. See the other Soares thread, with comments pointing out the obvious errors. -
muoncounter at 01:12 AM on 29 December 2011UAH Misrepresentation Anniversary, Part 2 - Of Cherries and Volcanoes
skept.fr#15:"FR2011 is not an attribution study. " Let's not start that again. FR2011, as discussed at length here, finds that when a mere three 'natural factors' are removed from the temperature record, a strikingly consistent linear trend emerges. Here's the resulting 'attribution': Those three factors do not contribute to the underlying trend. Thus some other thing(s) must be the dominant factor(s). Suggestions? I know one ... Based on FR2011, the UAH press release, quoted under 'Out of Step with Reality' is incorrect. Worse still, coming out after FR2011's publication, it is mere opinion masquerading as 'fact.' That's clearly a deliberate attempt to mislead; a more objective statement would be something like 'Despite a recent publication indicating we are incorrect, our opinion is still that we're not.' Spencer and Co. have lost all credibility and should be ignored by anyone seriously studying this issue. Of course, that's not exactly news. Spencer is on record as saying he's biased and a lobbyist, not a scientist: “I view my job a little like a legislator, supported by the taxpayer, to protect the interests of the taxpayer and to minimize the role of government.” Last I looked, we elect our legislators. We'd prefer our scientists to do their job - gather accurate data and provide unbiased interpretations. -
chris at 00:37 AM on 29 December 2011UAH Misrepresentation Anniversary, Part 1 - Overconfidence
victull, you're simply repeating the same logical error that you made in your post #6, even 'though you're misconstruing of the top article was clearly pointed out to you by Tom and dana. Perhaps that's your "legal training"! The words "false" and "misleading" are used three times and two times, respectively, in dana's top article. In each case these adjectives are used in sentences describing statements made in the UAH press release or by Christy on Spencer's blog. It is these that are "false"/"misleading" for the reasons that dana has spelled out. This could hardly be clearer. Dana's statements simply don't refer to the methodology used by Spencer and Christy in their analysis of MSU data in constructing the UAH tropospheric temperatures. CBDunkerson has answered your question about whether or not Spencer and Christy accept the corrections (especially involving orbital drift and diurnal correction). The answer is yes. re your question of whether RSS scientists incorporated these corrections. Firstly, since it was the RSS scientists (in 1998) that identified the cooling bias arising from orbital decay [*], it's obvious that they include this in their RSS analysis. The diurnal drift correction is an oddball. RSS didn't so much as incorporate this correction, as not incorporate a rather astonishing error into their analysis in the first place. So RSS didn't need to make this correction since the error was very much a UAH-specific problem [**]. [*] F. J. Wentz and M. Schabel (1998) Effects of orbital decay on satellite-derived lower-tropospheric temperature trends. Nature 394, 661-664. [**] e.g. As Wentzl (RSS) said in correspondence folowing the publication of the diurnal drift problem [***] , [see Science 310, 972-3 (2005)]: "Once we realized that the diurnal correction being used by Christy and Spencer for the lower troposphere had the opposite sign from their correction for the middle troposphere sign, we knew that something was amiss. Clearly, the lower troposphere does not warm at night and cool in the middle of the day. We question why Christy and Spencer adopted an obviously wrong diurnal correction in the first place. They first implemented it in 1998 in response to Wentz and Schabel (1), which found a previous error in their methodology: neglecting the effects of orbit decay." [***] C. A. Mears and F. J. Wentz (2005) The Effect of Diurnal Correction on Satellite-Derived Lower Tropospheric Temperature Science 1548-1551.Moderator Response: [muon] fixed text -
skept.fr at 23:26 PM on 28 December 2011UAH Misrepresentation Anniversary, Part 2 - Of Cherries and Volcanoes
Daneel's objection in #1 seems to be founded, since FR2011 is not an attribution study. Of course, AOGCMs simulations, which are in charge of such attribution, suggest the 0,16 K/dec signal FR2011 have separated from natural noise very likely emerges from GHG forcing. And so did HK2011 with a model of intermediate complexity. The Christy's idea that we would need an ultimate "proof" for the role of GHG must be questioned. In climate studies, and particularly in detection-attribution, there is no other "proof" that the results of models implementing the "state of the art" physics of climate. Any climate scientist unsatisfied with models has to publish a critical analysis of their radiative or convective schemes in order to show they do a bad job and miss some essential mechanisms of Earth climate. Discrepancies between observations and simulations are frequent, but they are not considered as fatal flaws as long as models get the "big picture" right. It is the case, and that's why IPCC AR4 2007 concluded that most of the observed warming since the 1950s is very likely due to GHG forcing. Even if we imagine that UAH is correct on TLT, and so that models slightly overestimate the warming of LT, this would imply that the transient (not equilibrium) water vapour and lapse rate feedbacks have to be adjusted so as to better fit the observations. Such an optimization would not be a revolution, and would not create by itself a "new cause" for the observed surface warming. At least it is the way I understand these questions. -
CBDunkerson at 23:25 PM on 28 December 2011UAH Misrepresentation Anniversary, Part 1 - Overconfidence
victull wrote: "I can't see any comment about whether or not Christy or Spencer accept these 'red' adjustments as correct." You appear to be proceeding under the incorrect assumption that these adjustments were made from the outside. Think it through. These are adjustments to the UAH satellite temperature record... which is developed by people at UAH... namely Spencer and Christy. In short, if they hadn't agreed (eventually) with the errors identified by outside groups they presumably wouldn't have adjusted their results to correct those errors. Once you take their acceptance, and correction of, those errors into account it should then become clear that their statements about the trends and adjustments in their record seem not merely 'false' (which doesn't imply intent in my experience), but demonstrably contradictory of things they have previously acknowledged. I suppose we could assume that they 'forgot' or 'spoke without checking the numbers' and are thus still simply 'incorrect' rather than deliberately misleading... but then they should be acknowledging these additional, blatantly obvious, errors now that they've been pointed out. But they aren't. -
victull at 23:17 PM on 28 December 2011UAH Misrepresentation Anniversary, Part 1 - Overconfidence
tom @ dana It must be my legal training or Queen's english but when I read the words 'false' and 'misleading' then intent is involved. Innocent mistakes made in good faith are 'errors'. All three terms are used in the article. Neither of you has addressed the issue of what Dressler said about "I don't really trust the satellite data" and my point about RSS. Orbital decay and diurnal drift adjustments noted in red in Figure 2 were made by scientists outside of UAH. Were similar adjustments made to the RSS record? Presumably yes. I can't see any comment about whether or not Christy or Spencer accept these 'red' adjustments as correct. If they don't then it is understandable for them to defend their analysis and trends and come up with 'incorrect' statements. I would not defend either Christy or Spencer throwing about accusations of fraud against other unnamed scientists for a minute. They are clearly reckless in doing so. Finally, problems with orbital decay and other adjustments affect all satellites - those measuring sea level, gravity, TSI etc. Aren't we trusting these data as the best available is finding evidence of global warming? -
CBDunkerson at 23:17 PM on 28 December 2011UAH Misrepresentation Anniversary, Part 2 - Of Cherries and Volcanoes
owl905, actually 'albedo influence' would be a feedback effect... I suppose land use changes can create an albedo forcing, but that would be tiny on short time scales. The larger ice albedo change is a feedback on other factors forcing the temperature one way or the other. I assume that the large feedbacks like ice albedo and water vapor were factored in when F&R were filtering out the effects of natural forcings. If they adjusted for just the direct impact of the forcings then the feedback on those forcings would still be causing swings in the end result. There have been other studies which worked to separate out the different factors responsible for observed warming. F&R is just a new methodology and another step forward. Eventually we may be able to identify and chart each significant component to enough certainty that the remaining greenhouse forcing looks like a nearly straight line. At which point we'd also be able to use observations of natural forcings to better predict temperatures, and thus weather, in the immediate future. -
owl905 at 19:18 PM on 28 December 2011UAH Misrepresentation Anniversary, Part 2 - Of Cherries and Volcanoes
"I don't really think that the Foster and Rahmstorf paper is evidence of anthropogenic global warming." Their research redux's to the Albedo Influence, the Greenhouse Effect, or God. Based on the evidence, my vote goes to the Greenhouse Effect. -
mace at 19:12 PM on 28 December 2011UAH Misrepresentation Anniversary, Part 2 - Of Cherries and Volcanoes
@john hartz. Dr Roy Spencer's satellite derived temperature data can be found here http://www.drroyspencer.com/latest-global-temperatures/ -
Tom Curtis at 17:03 PM on 28 December 2011UAH Misrepresentation Anniversary, Part 2 - Of Cherries and Volcanoes
DaneelOlivaw @10, in light of the fact that you agree that Foster and Rahmstorf 2011 "... is strong indirect evidence for AGW", and that it quantifies the linear trend, it follows logically that it is strong indirect evidence that the anthropogenically caused linear trend is approximately 0.16 degree C per decade. All that it lacks as a quantification of "... how much of the warming trend is due to humans" is an error estimate on the proportion of anthropogenic contribution to the trend. Further, discussion of F&R2011 is clearly relevant to Spencer's claim. Foster and Rahmstorf clearly are doing what Spencer claims cannot be done scientifically, ie, showing how much of the underlying trend is due to certain factors. Given that, your objection to the wording in the blog is raising a very subtle point. I am unsure what raising that point contributes to the discussion, nor how the post could be better worded to meet your objection. -
muoncounter at 16:33 PM on 28 December 2011ConCERN Trolling on Cosmic Rays, Clouds, and Climate Change
Cole#26: "confirmed the statistically significant influence of CR intensity decrease on the state of the atmosphere." Except Agee et al 2011 unconfirmed that: It is concluded that the observational results presented, showing several years of disconnect between GCRs and lower troposphere global cloudiness, add additional concern to the cosmic ray-cloud connection hypothesis. In fact, this has been done in the most dramatic way with the measurement of record high levels of GCRs during the deep, extended quiet period of cycle 23-24, which is accompanied by record low levels of lower troposphere global cloudiness. So I guess CR 'intensity' alters the state of the climate (whatever that means) in a statistically significant way, if you ignore the years where it doesn't. Can you say 'robust results'? -
DaneelOlivaw at 16:23 PM on 28 December 2011UAH Misrepresentation Anniversary, Part 2 - Of Cherries and Volcanoes
I understand what you are telling me and I agree. There's no magical mechanism that could explain the steady linear trend but anthropogenic CO2, BUT... I think that this post is not strictly correct when it says that "The aforementioned Foster and Rahmstorf paper filtered out the effects of the three largest short-term natural influences on global temperature, and estimated the resulting man-made trend at approximately 0.16°C per decade since 1979 (Figure 3)". Strictly speaking what they found is a linear trend of about 0.16ºC per decade when you remove some natural factors. The paper, by itself, does not say anything about what is actually causing this trend. Of course, taking into account prior studies and basic physics means acknowledging that the cause is anthropogenic. I'll take this quote, cited by Albatros @3: "The resultant adjusted data show clearly, both visually and when subjected to statistical analysis, that the rate of global warming due to other factors (most likely these are exclusively anthropogenic) has been remarkably steady during the 32 years from 1979 through 2010" The data presented in RF11 alone, IMO, cannot be used to prove that statement. That the causes are "most likely anthropogenic" is a (correct) conclusion based on previous research. I may have been wrong in saying that "I don't really think that the Foster and Rahmstorf paper is evidence of anthropogenic global warming". In a second thought, I agree with dana1981 @2 in that "Foster and Rahmstorf's paper is strong indirect edvidence for AGW", but my point is that it's not a paper about attribution but about quantification. It takes the stance that the attribution problem is long settled (as it is) and then takes it from there; that's the way science works. But for fake sceptics I don't think FR11 would be compelling since they are stuck in a long forgotten (and mostly imaginary) past when we didn't know what could possibly cause a positive trend in global average temperatures. -
dana1981 at 15:36 PM on 28 December 2011UAH Misrepresentation Anniversary, Part 1 - Overconfidence
Tom @7 - correct, the 'misrepresentations' refer to the comments made in the press release and blog post. And it's a good point that Spencer et al. are the ones accusing others of frauds and the like. -
Daniel Bailey at 15:17 PM on 28 December 2011ConCERN Trolling on Cosmic Rays, Clouds, and Climate Change
FYI, Cole has a history of carpet-bombing threads here at SkS with misunderstood, off-topic or fake-skeptic links. -
Philippe Chantreau at 15:06 PM on 28 December 2011ConCERN Trolling on Cosmic Rays, Clouds, and Climate Change
Cole, thank you for providing once again confirmation that a certain crowd going by the motto "anything but CO2" will recycle any an all debunked arguments ad infinitum. Your interpretation of the Dragic et al paper is mistaken. This paper was first cited 3 and a half months ago ny Muoncounter, who knows about these things, as his handle indicates. I'll cite Muon's previous assessment on this, which comes straight from looking at the numbers in the Dragic paper: "The authors have a dataset running 41 years (1954-95); there are a grand total of 35 7% FDs in that period. If this is what is causing clouds to form, there isn't even 1 cosmic ray induced cloudy episode per year!" If one cloud event per year can modulate climate, what kind of effect would even a minute change in radiative forcing that operates 24/7 have? This is not even betting on the wrong horse, it's simply beating a dead one. The Dragic paper is indeed tragic news for GCRs/climate advocates. See this post, dating back to 3 and a half monts ago: http://www.skepticalscience.com/cern-cosmic-rays-basic.html#62404 -
Tom Curtis at 14:33 PM on 28 December 2011UAH Misrepresentation Anniversary, Part 1 - Overconfidence
victull @6, in no part of the article are Spencer and Christy accused of bias. Rather, evidence is given that the UAH temperature record results in a bias showing a cooler trend than that which probably exists. The reason for that bias may be flaws in the instrumentation, flaws in Spencer and Christy's particular methods, or even an unknown or unaccounted for physical effect which biases the temperature measurements. In stating that record of bias, evidence has come to light that does suggest a particular bias on behalf of Spencer and Christy, although the main post draws no conclusion on that point, instead concluding that:"Given that the radiation reaches the satellite sensors having travelled through a warming lower atmosphere and cooling stratosphere, that bias exists between the various sensors, issues with orbital decay, and a host of other obstacles, there's a lot of careful and painstaking analysis required, and much that can go wrong."
Despite the reticence of the main post, it is difficult to not conclude from: 1) The overall negative pattern of the corrections to the record made by Spencer and Christy (excluding errors discovered by others); 2) The repeated and confident statements that the UAH record is wrong, and that therefore the surface record is in error; and 3) The claims made by Spencer and Christy and examined in the second article in this series, that Spencer and Christy are in fact personally biased in favour of little warming, and that bias has effected their work. There is a vast difference, however, between that conclusion and the conclusion "...that they deliberately read the UAH temperature record 'low' thereby showing bad faith as scientists", ie, that Spencer and Christy have acted fraudulently, which you ascribe to the article. There is no claim of personal bias in the mainposts, let alone a claim of fraud. In contrast, Spencer has said:"In my opinion, the supposed “fingerprint” evidence of human-caused warming continues to be one of the great pseudo-scientific frauds of the global warming debate....Many papers indeed have claimed to find a human “fingerprint”, but upon close examination the evidence is simply consistent with human caused warming — while conveniently neglecting to point out that the evidence would also be consistent with naturally caused warming."
That is a deliberate accusation of scientific fraud, and of pseudo-science against his colleagues for which Spencer is unable to provide evidence. Further, it is an accusation he has supported with plainly false statements. Given your stated concern that accusations of fraud be well evidenced, it is stunning that you are wasting your time here where no such accusation has been made, rather than defending the reputation of scientists at WUWT, or indeed at Spencer's (or Roger Pielke Snr's blog) where such accusations are common. Finally, as I understand it, the "misrepresentations" referred to in the title of the series refer to the many blatantly false or misleading statements that Spencer and Christy made in their press statement and subsequent commentary. It is not a claim that their scientific work is a misrepresentation. Perhaps Dana could confirm this. -
victull at 13:17 PM on 28 December 2011UAH Misrepresentation Anniversary, Part 1 - Overconfidence
The charge made by this article is that Christy and Spencer are 'biased' - that is that they deliberately read the UAH temperature record 'low' thereby showing bad faith as scientists. There might be some truth in that claim but to make that case there needs to be some watertight evidence on the part of the accuser. For example RSS is (I believe) analysing the same raw satellite data as UAH then the trends from Table 1 for RSS are midway between UAH and the others (Fu and Zou) for the TMT trend and the same as UAH for the TLT trend. Would it be reasonable to ask if RSS is a reliable and unbiased analysis which has no Christy or Spencer influence? If we look at the RATPAC trend of 0.18 verses RSS of 0.14C/dec - is this a significant difference outside normal error bars which is even worthy of comment? And the comment quoted by Andrew Dessler: "As far as the data go, I don’t really trust the satellite data. While satellites clearly have some advantages over the surface thermometer record, such as better sampling, measuring temperature from a satellite is actually an incredibly difficult problem. That’s why, every few years, another big problem in the UAH temperature calculation is discovered. And, when these problems are fixed, the trend always goes up" Does this also apply to RSS? Surely error or bias in the UAH record does not necessarily apply to RSS as well. Or are all the satellite reconstructions now to be suspect? And what do we make of this statement: "To be fair, Dessler was incorrect to say that the trend always goes up after adjustments are made to UAH". So is Dessler showing his own bias by making an incorrect statement? On balance I think that Christy and Spencer do have a case to answer regarding honest difference of opinion, limitations of the technology and deliberate bias, but a case is not made by airing similar bias on the other side of the argument.Response:[dana1981] No, you misunderstand the article. The term "bias" has multiple meanings. We aren't saying Spencer and Christy are biased (in the article), we're saying the evidence points to the UAH record being biased low (meaning cooler than reality). Yes, the same applies to RSS, to a lesser degree. That's simply where the scientific evidence seems to point.
-
Tom Curtis at 13:16 PM on 28 December 2011UAH Misrepresentation Anniversary, Part 2 - Of Cherries and Volcanoes
jmorpuss @8, the paper you link to discusses the atmosphere as a source of noise for radio telescopes and has nothing to do with either the main article above or subsequent discussion. Nor does it discuss man made noise as you claim. My day is not improved by you wasting my time. -
jmorpuss at 13:00 PM on 28 December 2011UAH Misrepresentation Anniversary, Part 2 - Of Cherries and Volcanoes
Tom the only thing you missed out is man made frequency abuse (noise)Here's a link from NASA that looks at noise,microwave frequencies and temperature http://descanso.jpl.nasa.gov/Monograph/series10/06_Reid_chapt+6.pdf Cheers and have a great dayModerator Response: As Tom replied to you, your comment is off topic not just for this thread but for this entire site. -
Cole at 12:37 PM on 28 December 2011ConCERN Trolling on Cosmic Rays, Clouds, and Climate Change
Conclusions The superposed epoch analysis confirmed the statistically significant influence of CR intensity decrease on the state of the atmosphere. http://www.astrophys-space-sci-trans.net/7/315/2011/astra-7-315-2011.pdf This is a new paper that seems to contradict what you're saying here. Is there a response? -
desertphile at 12:24 PM on 28 December 2011Soares finds lack of correlation between CO2 and temperature
Yesterday I encountered this amusing lie (above) for the first time, but apparently it has been passing through the FOX "News" obeyers for several months already. Stating Paulo Soares has refuted 160 years of physics regarding greenhouse gases is equal to stating Stan Meyer's car really was fueled only by water: it would involve not only a massive world-wide munti-generational conspiracy, but also an astonishing change in the laws of physics. -
Tom Curtis at 09:51 AM on 28 December 2011UAH Misrepresentation Anniversary, Part 2 - Of Cherries and Volcanoes
DaneelOlivaw @1, not only do Foster and Rahmstorf 2011 show that neither the sun, volcanoes or the El Nino Southern Oscillation (or any combination of them) are responsible for the current warming; they also show that what ever is responsible has had a near constantly increasing effect over the last 33 years. So which mythical natural cause of global warming has that property? Not the Atlantic Multidecadal Oscillation: Not the Pacific Decadal Oscillation:
 Not Cosmic Rays:
 F&R2011 not only show the effects of short term variations in ENSO, etc. By doing so they also show that the remaining long term trend is inconsistent with all the favourite fake skeptic "natural" explanations leaving anthropogenic forcing as the only currently proposed mechanism consistent with the data. It follows that R&F2011 is strong evidence that the current warming is due to anthropogenic forcings.
-
CBDunkerson at 06:52 AM on 28 December 2011UAH Misrepresentation Anniversary, Part 2 - Of Cherries and Volcanoes
Daneel, based on our understanding of atmospheric physics we expect human activities, ENSO, and volcanic eruptions to cause significant warming on short time scales. Thus, if we filter out two of these (along with solar effects, which are actually tiny on short time scales but constantly cited by 'skeptics' anyway) then logically any trend remaining should be largely due to the third. F&R thus does indeed show "evidence" of the anthropogenic trend. Yes, there could still be unknown magical forces out there which are canceling out the warming GHGs should be causing AND simultaneously causing identical warming patterns (see the 'fingerprints' section of the article) themselves... but that's empty speculation with no foundation whatsoever. Every test we are able to perform confirms humans are responsible for the warming. The chances of that being incorrect due to multiple unknowns just happening to align to give the wrong impression is vanishingly small. -
Alexandre at 06:38 AM on 28 December 2011UAH Misrepresentation Anniversary, Part 2 - Of Cherries and Volcanoes
About this part: Of course, Spencer and Christy may well have meant not 'since that upward jump' but 'including that upward jump'. Of course, if you include the 'upward jump' in the part before 1998, you also get a lot of warming. The main point is the final trend in the fig. 1 gif: the whole period has a clear warming. You can play with words to get people paying attention to pieces of it, but it does not make the warming go away. -
John Hartz at 05:49 AM on 28 December 2011UAH Misrepresentation Anniversary, Part 2 - Of Cherries and Volcanoes
Roy Spencer states the following in his Dec 21 blog post, “Addressing Criticisms of the UAH Temperature Dataset at 1/3 Century”. “Earlier this week we reported on the latest monthly global temperature update, as we do every month, which is distributed to dozens of news outlets.” Who exactly are the recipients of the monthly temperature updates/news release? Are they all legitimate news organizations? I pose these questions because I cannot find the monthly temperature updates/news release posted on either the website of the University of Alabama Huntsville (UAH) or on the website of the UAH’s Earth System Science Center. In addition, why does Roy Spencer engage in a discussion about the UA temperature updates/news release on his private blog site rather than on the public website of the Earth System Science Center? Click here to access Spencer’s private blog. -
Albatross at 05:20 AM on 28 December 2011UAH Misrepresentation Anniversary, Part 2 - Of Cherries and Volcanoes
DaneelOlivaw @1, "As I see it, that papers assumes...that global warming is mainly anthropogenic..." It is not my understanding that Foster and Rahmstorf (2011, FR11) assume that a priori in their paper; I do not think that is a fair assessment of their paper by you. They find that what emerges when one removes the short-term, transient noise is a steady long-term warming trend. That steady background warming is what is very troublesome for the fake skeptics and those who deny the theory of anthropogenic global warming (AGW). The point is that natural variation alone cannot explain the observed warming trends in the data. From RF11: "Perhaps most important, it enables us to remove an estimate of their influence, thereby isolating the global warming signal. The resultant adjusted data show clearly, both visually and when subjected to statistical analysis, that the rate of global warming due to other factors (most likely these are exclusively anthropogenic) has been remarkably steady during the 32 years from 1979 through 2010. There is no indication of any slowdown or acceleration of global warming, beyond the variability induced by these known natural factors. Because the effects of volcanic eruptions and of ENSO are very short-term and that of solar variability very small (figure 7), none of these factors can be expected to exert a significant influence on the continuation of global warming over the coming decades." "Of course, they do show that GW cannot be due to the Sun, volcanoes or ENSO. " Yes, but if one does not like RF11 then their is another excellent paper Huber and Knutti (2011) that estimates the anthropogenic global warming component. Regardless, there go the fake skeptics' favourite cycles that they like to try and attribute the warming to. That is the true significance of the FR11 paper. Now that they have been forced to accept that the warming is real, Roy Spencer and his fellow fake skeptics are forced to try and attribute the warming to all kinds of natural cycles/oscillations while at the same time trying to claim that the present warming is insignificant in magnitude (i.e., inferring that the future warming will not be bad)-- the logical fallacy is obvious. So anything to downplay the anthropogenic component and to cast doubt is their means to delay taking meaningful action on reducing GHG emissions. They are quite good at it, at least when it comes to misleading people who do not know (and sometimes even those who should know) better. The big tell in the fake skeptics' game is that they have yet to develop a cohesive, physically-based and internally consistent theory that explains all the fingerprints and the nature of the observed warming. -
dana1981 at 05:02 AM on 28 December 2011UAH Misrepresentation Anniversary, Part 2 - Of Cherries and Volcanoes
Daneel - considering that the sun and volcanoes are the dominant natural external forcings, and they also filter out the main internal variation (ENSO), Foster and Rahmstorf's paper is strong indirect edvidence for AGW. -
Rob Honeycutt at 04:41 AM on 28 December 2011Medieval project gone wrong
Markx... You're making the same mistake that many people make with the MWP. There are hundreds of papers on the MWP. There are better than 300 listed on that CO2Science website alone. MOST of those papers are research into local records of temperature. The MWP is a very loose term applied to any warm phase occurring anywhere between 700-1300 AD. The key word to remember in any discussion on this subject is "heterogenous." Even the Ed Cook paper you quote states clearly that the MWP is NOT homogenous. It does not occur everywhere at the same time. In many places the warming is early, ~700-900 AD. Other places it occurs late, around 1000-1300 AD. AND along with that you have places that are cooling when other places are warming. This is the reason the hockey stick turns into a hockey stick when you start putting all the data together. Those offsetting events cancel each other out. But what we are left with is a clear modern global trend that is significantly positive, per Tom's second graph of NH temp reconstructions. What I always note about the CO2Science group (Idso's et al) is that, even though they've pulled together all this data for the MWP, they've never bothered to try to use it to construct a multi-proxy chart of their own. Or they have and they didn't like the result.
Prev 1341 1342 1343 1344 1345 1346 1347 1348 1349 1350 1351 1352 1353 1354 1355 1356 Next


