


 Arguments


Recent Comments
Prev 1347 1348 1349 1350 1351 1352 1353 1354 1355 1356 1357 1358 1359 1360 1361 1362 Next
Comments 67701 to 67750:
-
skept.fr at 00:54 AM on 22 December 2011Foster and Rahmstorf Measure the Global Warming Signal
Tom : thank you. Bert : read my first message in #13, my point was clear about signal-noise disambiguation, and my conclusion was clear too : "I think FR get the broad picture with their choices, but I don't know if the decadal trends they obtain from their removals are very precise. Maybe lower, maybe higher." (My emphasis). In my opinion, if multidecadal unforced variability exists and is assessed, the real AGW signal may well be higher (not lower) that the conclusion of FR2011. For example, if you look at this recent Douglass guest post on Curry's blog, you see that the author suggests the internal variability modes could have known a very low shift at the beginning of the 2000s, the lowest of the past 70 yrs (figure 1 from Towsley et al 2011). If he is correct (that I don't know, and remind this is just a blog post without real scientific value), it would mean that instead of a slight warming, and the warmest T from instrumental records, past decade should have known a very sharp cooling. So, maybe we underestimate (even FR2011) the real signal of AGW in climate. That is why even people who refers to the sun or the natural variability, frequently in a perspective of denialism, doesn't understand the real implication of what they advance for climate. The 2000s decade could well have been the definite proof that natural factors are henceforth unable to cool the Earth, even in the most favorable condtions for that. And this would be quite a bad news for all us. You must really keep an open mind on all these questions. I'm skeptic, not denier. -
Yvan Dutil at 23:35 PM on 21 December 2011The Media & Global Climate Science Communication
I don't share your optimism about the effectiveness of a good communication strategy. I have a Ph.D. in astrophysics and have given a countless number of interview. Many time, an astrologer was invited in the same news report to give a "balanced" view. In addition, I dis some science journalism. I can confirm, there is ZERO time to check your sources. Even putting things in context is very hard due to the limited amount of space. -
CBDunkerson at 23:02 PM on 21 December 2011Roy Spencer on Climate Sensitivity - Again
Spencer and Christy are at it again, using the 33rd anniversary of the satellite record to repeat their claims that their satellite records 'disprove' climate model projections and that the observed warming is therefor mostly 'natural variability'. A Washington Post article on these claims included a great rebuttal in image form; This was apparently created by John Abraham and sent to them by Andrew Dessler. In any case, I hadn't seen it before and it really brings home just how many serious problems there have been with Spencer & Christy's work and how they have consistently been biased in one direction.
The temperature trend Spencer & Christy show now is more than 0.2 C per decade higher than their original claims. If we apply that as a 'demonstrated uncertainty range' around their current claim then the possible spread on their current value includes warming much greater than any of the mainstream projections.
This was apparently created by John Abraham and sent to them by Andrew Dessler. In any case, I hadn't seen it before and it really brings home just how many serious problems there have been with Spencer & Christy's work and how they have consistently been biased in one direction.
The temperature trend Spencer & Christy show now is more than 0.2 C per decade higher than their original claims. If we apply that as a 'demonstrated uncertainty range' around their current claim then the possible spread on their current value includes warming much greater than any of the mainstream projections.
-
Tom Curtis at 23:00 PM on 21 December 2011Foster and Rahmstorf Measure the Global Warming Signal
Bert @50, while I may be disappointed in the end, on evidence to date I do not think you have skept.fr's measure at all. He is not a carbon copy denier, and should not be treated as one. Further, suggestions that he has simply trying to distract us from the obvious are not helpful. -
Bert from Eltham at 21:10 PM on 21 December 2011Foster and Rahmstorf Measure the Global Warming Signal
skept.fr The core of your question is now differentiating signal from noise?! I will say this very simply that the eddies in the flow of heat have been subtracted from the measured signal by FR 2011. These are real perturbations of the GTA caused by both the drivers and mediators apart from our CO2 pollution. The resultant signal is our contribution to the temperature increase of SpaceShip Earth You are complicating what is a simple scenario by pointing to red herrings. I reckon I have your measure. Bert -
Tom Curtis at 20:31 PM on 21 December 2011Foster and Rahmstorf Measure the Global Warming Signal
skept.fr @48:"Tom : only one such "oscillation" has a proven effect on global climate - ENSO I think we disagree on this point, because I consider there is a debate in climate community."
You misunderstand me. There is debate about the effect of several of these oscillations on global temperatures, most particularly the AMO and the PDO. But for just one oscillation has the debate moved to the point where it is beyond reasonable dispute that that oscillation effects global temperatures, ie, for ENSO. For all other candidates, you will find evidence and scientists on both sides of the debate. -
skept.fr at 20:16 PM on 21 December 2011Foster and Rahmstorf Measure the Global Warming Signal
#45 Tom : "what we are finding puzzling about your concentration on the AMO is, as has been pointed out, it is just one of many posited oceanic quasi-periodic fluctuations" Agree with that, but note that my concentration on AMO comes from the fact that Tamino has written on it on his blog, so I took this as an example of what I called in my very first message "the other Os". Following the advice of muoncounter, I posted a question on Tamino's blog, so I'll let you know. My question had no mention of AMO, here it is for information: I miss a point. In IPCC AR4 3.3.6 (2007), several patterns of variability are described, Southern Oscillation being one among others. On long term, these oscillations are centered on a zero mean value (they don’t create heat). But for a shorter term as 1979-2010, why should we consider the sole ENSO as a multidecadal “noise”? Or more precisely, on a 32 yrs period, from which physical arguments must we choose one oscillation in particular, rather than zero oscillation or all oscillations? Thanks. Tom : only one such "oscillation" has a proven effect on global climate - ENSO I think we disagree on this point, because I consider there is a debate in climate community. That's why I quoted Swanson, Tsonis or Latif as examples of scientists having recently published on multidecadal effects on internal (or unforced) variability. Real Climate had published a guest blog of Swanson (link above), so I suppose it is not a scoop. And in fact, IPCC AR4 3.6.8 2007 already said : Decadal variations in teleconnections considerably complicate the interpretation of climate change. Since the TAR, it has become clear that a small number of teleconnection patterns account for much of the seasonal to interannual variability in the extratropics. On monthly time scales, the SAM, NAM and NAO are dominant in the extratropics. The NAM and NAO are closely related, and are mostly independent from the SAM, except perhaps on decadal time scales. Many other patterns can be explained through combinations of the NAM and PNA in the NH, and the SAM and PSA in the SH, plus ENSO-related global patterns. Both the NAM/NAO and the SAM have exhibited trends towards their positive phase (strengthened mid-latitude westerlies) over the last three to four decades, although both have returned to near their long-term mean state in the last five years. In the NH, this trend has been associated with the observed winter change in storm tracks, precipitation and temperature patterns. In the SH, SAM changes are related to contrasting trends of strong warming in the Antarctic Peninsula and a cooling over most of interior Antarctica. The increasing positive phase of the SAM has been linked to stratospheric ozone depletion and to greenhouse gas increases. Multi-decadal variability is also evident in the Atlantic, and appears to be related to the THC. (My emphasis) So as you can see, the IPCC 2007 acknowledges that there have been decadal change in some pattern inside the 1979-2011 period, for NAM/NAO, SAM, Atlantic MOC, not only ENSO.The fact that ENSO have the strongest signature on T does not imply that coupling / decoupling of other patterns of variability during there decades have no signature at all on regional T and so mean global T. #47 Bert : "You either do not really understand the physics or you are as is usual with the deniers of AGW, casting doubt on the basic premise by pointing out a meaningless anomaly that has no basis in reality. Or you are genuine and simply misguided. Which is it?" You've a lot of hypothesis about me, I'd prefer a lot of hypothesis about my questions! That is I prefer ad rem to ad hominem. Of course, oscillations do not create heat, but just change its pattern of distribution between ocean and atmosphere. The point of the discussion is not to say that oscillations produce GW — nonsensical as I've already said (so please read me more attentively), they oscillate around a zero mean —, but to understand how FR 2011 can separate signal and noise. That is the core of their approach, and the core of my questions. -
Bert from Eltham at 19:35 PM on 21 December 2011Foster and Rahmstorf Measure the Global Warming Signal
skept.fr When dealing with slightly turbulent flow it is useless to dwell on one of the vortices as a driver of the overall flow. It is a property of the flow rather than a cause. All the 'oscillations' are just this. You either do not really understand the physics or you are as is usual with the deniers of AGW, casting doubt on the basic premise by pointing out a meaningless anomaly that has no basis in reality. Or you are genuine and simply misguided. Which is it? Bert -
Tristan at 18:19 PM on 21 December 2011Foster and Rahmstorf Measure the Global Warming Signal
Tom It's not just somewhat arbitrary, it's entirely arbitrary. P-values, and more importantly, likelihood distributions give us information with which to make decisions. A p-value of 0.05 will result in some decision being made. A p-value of 0.07 will result in some decision being made. They might result in the same decision, they might not. Most decisions are more finely grained than simply 'do' or 'don't'. In the case of this study, the p-value is stacked against a pretty strong body of work that implies that the AMO isn't an actor in global temperatures. I think it'd take much more than p:0.05 to shed doubt on what we currently believe. -
Mond from Oz at 18:14 PM on 21 December 2011Correction to the True Cost of Coal Power - MMN11
(apologies if this is off topic) Today (21/12) SMH 'Business News' writes that some 32 billion AUD is to be spent on mergers and acquisitions in coal production in Australia. Question: On average rough estimate how much does it cost to get a ton of coal out of the ground? In other words, how much coal is this talking about? -
DSL at 15:29 PM on 21 December 2011The Media & Global Climate Science Communication
DrTsk, I wonder if Althouse is also a 9/11 Toother. He should be picking cherries out of his teeth for brushing aside all other atmospheric scientists in favor of the Happer stance.Moderator Response: [JH] Off topic. -
Tom Curtis at 14:33 PM on 21 December 2011Foster and Rahmstorf Measure the Global Warming Signal
skept.fr, what we are finding puzzling about your concentration on the AMO is, as has been pointed out, it is just one of many posited oceanic quasi-periodic fluctuations. Among other posited (and in most cases well established) periodic variations are: The Indian Ocean Dipole (IOD); The Benguela Nino; (Both of which are analogues of ENSO in their respective oceans.) The AMO; The PDO; The Arctic Oscillation; The North Pacific Gyre Oscillation (which is part of the North Pacific Oscillation, an atmosphere/ocean oscillation) There is also a significant oscillation measured by the pressure difference between Hobart and Chatham Island whose name I forget, and no doubt many others. All of these "oscillations" have significant regional effects. The IOD effects climate not just in India and North Africa (as you would expect) but also in South Eastern Australia. However, only one such "oscillation" has a proven effect on global climate - ENSO. If others were to have a global influence, most logically it would be one (or both) of the two ENSO analogues. In the meantime, what can be said about the AMO is, if it is real, its long term effect could not be distinguished from the global warming trend in a study that only covers a half cycle period, and that its short term fluctuations do not correspond well with the residual of F&R's analysis, suggesting that its short term cycle, at least, has little bearing on global temperatures. -
DrTsk at 13:56 PM on 21 December 2011The Media & Global Climate Science Communication
At AccuWeather.com -> http://www.accuweather.com/en/weather-blogs/climatechange/does-satellite-temperature-dat-1/59306Elliott M. Althouse · Georgetown U. School of Dentistry The blog is wrong. Raw surface station temperature is adjusted all the time, and never down. The 14k and 25k mid troposphere temps are virtually at record lows for the satellite era. I believe the atmospheric physicists (e.g. Happer at Princeton)_are already dismissing greenhouse gas forcing as a major player in climate change in favor of their cosmic/solar models, and are concentrating much research into climate.
I guess the Dentists have spoken!!!Moderator Response: [JH] Off topic. -
muoncounter at 13:16 PM on 21 December 2011Foster and Rahmstorf Measure the Global Warming Signal
skept.fr#41. A precise interpretation? I prefer precise information: -- The earliest mention of 'AMO' in this page is your #13, where it is one among a number of possible oscillations you suggest need consideration. -- Stephen Baines offered a reasonable suggestion as to why Foster and Rahmstorf did not show AMO as a factor, but that is brushed aside here. -- There is then some back and forth, culminating in Tom Curtis' characteristically precise explanation of tamino's earlier work in this context. -- And so on (and that is not meant to diss any of the other excellent contributions to this thread; space is limited). My point was that there is no strong evidence for treating AMO as a factor here (as opposed to ENSO, which has had readily observable effects on global temperature). The observation that "there are currently many discussions on AMO" is hardly compelling. FYI, we have AMO threads which could be informative to consult. Please forgive my use of 'chimera' as my personal opinion of the importance of AMO; that was a needless and irrelevant confusion. Let's put it very simply: Why not post the AMO question directly to tamino's discussion of F&R 2011? He is remarkably clear in his responses to such questions and would no doubt provide more insight than I ever could. -
Tom Curtis at 12:53 PM on 21 December 2011Foster and Rahmstorf Measure the Global Warming Signal
Tristran @32, while I agree that the 95% confidence level is somewhat arbitrary, and would much prefer the use of Bayesian approaches to statistics, never-the-less the difference between a 95% and a 93% confidence level is not small. The 95% confidence level can be glossed as saying there is a 1 in 20 chance the result would be produced "by chance". The 93% confidence level, in contrast, equates to a 1 in 14.3 chance, a 40% increase of a chance result. Consequently the conventional standard of 95% for statistical significance is a convention, but not entirely arbitrary. That said, the Knudsen paper is tantalizing in its result. Just not statistically significant. -
alan_marshall at 12:52 PM on 21 December 2011The Media & Global Climate Science Communication
Brian, I hope someone has submitted this study to the Australian federal government's current Independent Media Inquiry. News Ltd. needs to be held to account. The Daily Telegraph, for example, is blatantly in breach of its own "code of ethics". -
Utahn at 11:45 AM on 21 December 2011Foster and Rahmstorf Measure the Global Warming Signal
Perhaps I see your point skept.fr: since one oscillation was included, why not others? I think the bottom line is that ENSO is universally accepted as a defined entity which produces marked short term global temperature noise, whereas the definitions for and likely magnitudes of effect of the other possible oscillations are in much (to put it mildly) debate. Is the lack of evidence for significant oscillation in the thirty years of this study evidence for a lack of global effect of the other oscillations(at least as currently defined)? My guess is yes, but I can't say I know enough to be certain... -
skept.fr at 11:18 AM on 21 December 2011Foster and Rahmstorf Measure the Global Warming Signal
#40 muoncounter : It is probably just my interpretation, but in some of your comments, you seem to be seeing things that aren't there and assuming these chimera must have some unexplored significance. Hence the suggestion that it could be AMO - on the basis that there are several current papers about it. Whatever your interpretation, it should be more precise. I wrote "My point is not to say a huge part of warming come from AMO (non sensical)", so what do you mean for your part by "it could be AMO" when you interpret my point? What could be AMO exactly? When you speak of "chimera", what do you refer to, the articles I linked or my bad understanding of the conclusions of these articles? The former as the latter may be well true, but I guess one or other merits to be explained. -
Tom Curtis at 10:49 AM on 21 December 2011The Media & Global Climate Science Communication
chriskoz @7, I would dispute your analysis of the Liberal Parties' position on Climate Change. In fact the Liberal Party is deeply divided on the science of climate change. While some Liberal Party MPs (of which Turnbull is the most noted example) accept the science, others (Bill Heffernan comes to mind) are clearly deniers. Opinion is divided as to whether Tony Abbot, the leader of the Liberal Party denies climate change out of conviction or convenience, it remains the fact that he has said that "Climate Change is crap." As Turnbull has observed, the only significant virtue of the Liberal Party's policy is that it is an easy policy to stop. It exists as a screen against attacks on the party that they are climate change deniers, which are perceived as politically damaging. However, as the very expensive policy is associated with no funding proposal, and the Liberal Party is committed to reducing taxes and hence revenue overall, the correct interpretation is that this is a policy designed to not be implemented. It is a smoke screen only. -
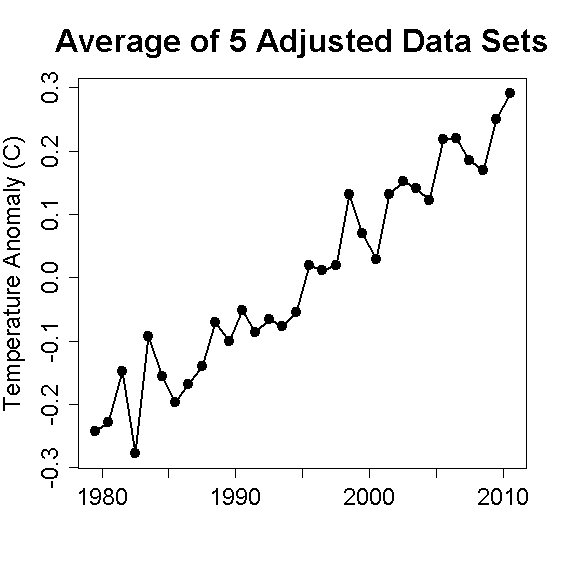
muoncounter at 10:29 AM on 21 December 2011Foster and Rahmstorf Measure the Global Warming Signal
skept.fr#24: "I see the very precise distinction between noise and signal as a difficult exercise." I am sure tamino would agree. Why don't you ask? "There are many other convergent lines of evidence to consider the ~0,15 K /dec signal as the very likely result of GHGs forcing," Yes indeed; a most important observation. "but to say for example this GHG decadal signal is really 0,15 K rather than 0,11 K or 0,19 K seems to me very difficult," Foster and Rahmstorf do not make any claim of such exacting precision. Examine Table 1 in this post: decadal rates (adjusted) range from 0.141 to 0.175; uncertainties are given. That range alone provides an arithmetic mean of 0.158 +/-0.017. #31: "there are currently many discussions on AMO periodicity (or reality) on different timescales" It is probably just my interpretation, but in some of your comments, you seem to be seeing things that aren't there and assuming these chimera must have some unexplored significance. Hence the suggestion that it could be AMO - on the basis that there are several current papers about it. As we have seen in other cases, the mere number of papers is not a good indicator of their relevance. -
Stevo at 10:07 AM on 21 December 2011The Media & Global Climate Science Communication
Thanks for an interesting article Brian. It will be interesting to compare this study of the reporting of climate policy with the soon to be released study of the reporting of climate science. I expect the results will make the Australian print media look rather dismal. -
chriskoz at 10:05 AM on 21 December 2011The Media & Global Climate Science Communication
I think the political situation in Australia with respect to AGW is quite different to that in US. Here, not only the gov but also the opposition accept that the globe is warming and that sth must be done about it. If you look at the liberal policy here you find not a single word denying the climate science. The disagreement is only about the policy: liberals favour their "direct action" and try disproving the carbon tax method being implemented by govs. If Tony Abbott digress sometimes that "science is not settled yet", that's because Tony's mind is influenced more by some external events like 'lord' Monckton speaches rather than his own reasoning. Look at other liberal leaders, like Malcolm Turnball for more reasonable representatives. So, this report, as confirmed by Brian, is about the climate policy. The one about climate sicence will be different. IMO. -
skept.fr at 09:48 AM on 21 December 2011Foster and Rahmstorf Measure the Global Warming Signal
#37 Sphaerica : AMO, on the other hand, is a black box. We're not even sure that it really is periodic or even exists at all. It may be a mere artifact of coincidence with actual, distinct forcings that in the past 100 years first temperatures down, then up (increase in TSI), then down (increase in human aerosols overpowering GHGs) and then up again (less aerosols, more GHGs) in a seeming cycle that does not actually exist. We have logical evidence to accompany changes in global temperature, and the AMO then mirrors those changes in global temperature. I suggest you're a bit "extreme" in your presentation of AMO. IPCC AR4 3.6.6 (2007) has presented the AMO among other "patterns of atmospheric circulation variability", including the Southern Oscillation, and what I read here from climate scientists is not exactly what you say. I mean, there are 17 years of publication on AMO since the first description in Schlesinger and Ramankutty, 1994, so it not just "a black box". Furthermore, if your prefer to speak about other patterns, why not : my question would be valuable for the better defined NAO or NAM, for example. I've no fixed idea on AMO. My point is a question of logical coherence rather than empirical evidence on such or such oscillation. If you think that oscillations (or patterns of variability or teleconnections) do not change surface temperature on long term, beyond interannual variability, you have no particular reason to include any oscillation in a 32 yrs analysis. It will oscillates around the zero mean on such a long period, by definition. This is quite independent of our exact level of understanding about ENSO, AMO, NAO, and so on. But if you include one oscillation, you must at least explain the statistical / physical reasons for excluding all the others. Why would one then go looking at the AMO as a cause rather than an effect? In fact some scientists do. So you should ask to them, not to me! For example in J Clim, Ting 2010 : "Comparing the results to observations, it is argued that the long-term, observed, North Atlantic basin-averaged SSTs combine a forced global warming trend with a distinct, local multidecadal “oscillation” that is outside of the range of the model-simulated, forced component and most likely arose from internal variability. This internal variability produced a cold interval between 1900 and 1930, followed by 30 yr of relative warmth and another cold phase from 1960 to 1990, and a warming since then." (My emphasis on produce) Also in J Clim, DelSole 2011 : "An unforced internal component that varies on multidecadal time scales is identified by a new statistical method that maximizes integral time scale. This component, called the internal multidecadal pattern (IMP), is stochastic and hence does not contribute to trends on long time scales; however, it can contribute significantly to short-term trends. Observational estimates indicate that the trend in the spatially averaged “well observed” sea surface temperature (SST) due to the forced component has an approximately constant value of 0.1 K decade−1, while the IMP can contribute about ±0.08 K decade−1 for a 30-yr trend. The warming and cooling of the IMP matches that of the Atlantic multidecadal oscillation and is of sufficient amplitude to explain the acceleration in warming during 1977–2008 as compared to 1946–77, despite the forced component increasing at the same rate during these two periods."(my emphasis) I've no idea of the value of these studies, but they suggest internal variability (and particularly AMO here) can be something like the cause of some mutlidecadal warming / cooling. That's why I speak previously of a debate among climate community on the origin, cause and effect of these oscillations, and particularly on relatively short period like 1979-2011. See also Latif and Keenlyside 2011 for a recent review on decadal climate variability and predictability. -
Bob Lacatena at 08:32 AM on 21 December 2011Foster and Rahmstorf Measure the Global Warming Signal
36, skept.fr, To put it another way, you find a bullet embedded in the wall. You trace the angle of entry, look across the room, and see a smoking gun lying on a table. You now conclude that the bullet must have thrown the gun across the room onto the table. The correlation between the two is obvious. The expectation of cause and effect is absurd. -
Bob Lacatena at 08:28 AM on 21 December 2011Foster and Rahmstorf Measure the Global Warming Signal
36, skept.fr, You also neglect the fact that much of the mechanics of ENSO are understood. We know, physically, what happens to cause the warming and cooling. We don't yet know what controls the transition between states so we can't predict when any state will appear or how strong it will be, but we do understand how and why it affects temperatures, and this allows us to understand that it could not possibly have a long term effect on global mean temperature. AMO, on the other hand, is a black box. We're not even sure that it really is periodic or even exists at all. It may be a mere artifact of coincidence with actual, distinct forcings that in the past 100 years first temperatures down, then up (increase in TSI), then down (increase in human aerosols overpowering GHGs) and then up again (less aerosols, more GHGs) in a seeming cycle that does not actually exist. We have logical evidence to accompany changes in global temperature, and the AMO then mirrors those changes in global temperature. Why would one then go looking at the AMO as a cause rather than an effect? This has nothing to do with statistics. It has to do with misinterpreting the correlation and so putting the cart before the horse. -
shoyemore at 08:21 AM on 21 December 2011The Media & Global Climate Science Communication
I am amazed at these statistics. Julia Gillard is an unusually courageous politician to take on this type of print media opposition. It is surprising that climate change science retains a hold on the Australian public. Is this repeated in other media? Or have bloggers and science communicators been unusually effective by other means? -
scaddenp at 07:22 AM on 21 December 2011The End of the Hothouse
A quick look at GeoCarb revealed another tool that I had forgotten - Sr isotopes as a proxy for weathering rate. eg this paper. Quite definitely a himalayan signal here. -
AussieinUSA at 07:20 AM on 21 December 2011The Media & Global Climate Science Communication
Thanks Brian and also John for the interesting links. -
cRR Kampen at 07:13 AM on 21 December 2011Arctic settles into new phase – warmer, greener, and less ice
John et al, thank you for the additional lecture. Btw I noticed the authorship of the title but only responded to the title's content. #18, that's what is sharpening the annual cycle of anomalies. Catastrophe theory (the mathematics/physics interpretation) is imo a useful concept. E.g. around a threshold average thickness below which, in summertime, ice cover breaks up and melts vastly more quickly. Positive feedback like open sea area, menacing the protective fogs and low stratus over the pack. -
skept.fr at 06:39 AM on 21 December 2011Foster and Rahmstorf Measure the Global Warming Signal
#34 Stephen - Sorry, I miss your second point : "On a more abstract statistical level, it's a little problematic trying to fit a cycle with a period twice as long as temperature record being used. It's also hard to know how to correct the AMO for the influence of AGW without seeming a little arbitrary. " I think this point partly answers my question: a purely statistical approach has no tool for a physical detection-attribution (contrary to climate models, like Huber et Knutti 2011), so its prior assumptions for detrending must rely on robust features in literature. ENSO is considered as the principal mode of high frequency variability for surface / LT trends (for the moment with a null hypothesis concerning an effect of GHG forcing), whereas AMO is still under discussion. -
Brian Purdue at 06:36 AM on 21 December 2011The Media & Global Climate Science Communication
AussieinUSA - the charts show negative/positive policy response. There is a second report due out soon on climate science coverage. Details are in the study. -
John Hartz at 06:32 AM on 21 December 2011The Media & Global Climate Science Communication
Chris Mooney is also a regular contributor on DeSmog Blog. Most of his posts focus how climate science is communicated and how it is received – particularly in the USA. His most recent DeSmog Blog post “The Climate-Media Paradox: More Coverage, Stalled Progress” is particularly provocative when juxtaposed with Brian Purdue’s excellent article. To access Mooney’s “The Climate-Media Paradox: More Coverage, Stalled Progress”, click here. -
skept.fr at 06:22 AM on 21 December 2011Foster and Rahmstorf Measure the Global Warming Signal
#34 Stephen Here is a AMO index (c) which is calculated as a substraction of (a) global STT anomaly from (b) NA SST anomaly, image from the Knudsen 2011 paper. So, concerning the anomaly we're debating, AMO is supposed to exhibit a warming trend from beginning of the 1990s to the present period, with no particular trend for 1979-1990.
I don't understand why this signal, relative to one basin and not all the hemisphere nor the globe, would be immediately identifiable in the detrended global signal from FR2011. I think it is your point (if I correctly understand) but in fact, we've just here a local warming trend (AMO or North Atlantic STT) in a global warming trend (global T). If this trend is partly natural ("noise" in the FR2011 sense), to remove its natural part permits to gain the correct forced signal.
A natural (unforced) part of AMO would probably be a low value in the global mean. My point is not to say a huge part of warming come from AMO (non sensical), or any other oscillation in particular, but to understand the rationale for detrending natural variability in three decades series (that is to assess what is natural variability and what is forced variability, even if a particular oscillation just produces 0,01K/dec, for example). As I said in #13, I think FR get the broad picture correctly with their choices, but details are still amazing for me (either the ENSO independency from forcings or the other "Os" except ENSO).
So, concerning the anomaly we're debating, AMO is supposed to exhibit a warming trend from beginning of the 1990s to the present period, with no particular trend for 1979-1990.
I don't understand why this signal, relative to one basin and not all the hemisphere nor the globe, would be immediately identifiable in the detrended global signal from FR2011. I think it is your point (if I correctly understand) but in fact, we've just here a local warming trend (AMO or North Atlantic STT) in a global warming trend (global T). If this trend is partly natural ("noise" in the FR2011 sense), to remove its natural part permits to gain the correct forced signal.
A natural (unforced) part of AMO would probably be a low value in the global mean. My point is not to say a huge part of warming come from AMO (non sensical), or any other oscillation in particular, but to understand the rationale for detrending natural variability in three decades series (that is to assess what is natural variability and what is forced variability, even if a particular oscillation just produces 0,01K/dec, for example). As I said in #13, I think FR get the broad picture correctly with their choices, but details are still amazing for me (either the ENSO independency from forcings or the other "Os" except ENSO).
-
John Hartz at 06:18 AM on 21 December 2011The Media & Global Climate Science Communication
Chris Mooney hit the nail squarely on the head when he wrote: “You can follow the logic to its conclusion: Conservatives are more likely to embrace climate science if it comes to them via a business or religious leader, who can set the issue in the context of different values than those from which environmentalists or scientists often argue. Doing so is, effectively, to signal a détente in what Kahan has called a ‘culture war of fact.’ In other words, paradoxically, you don't lead with the facts in order to convince. You lead with the values—so as to give the facts a fighting chance.” Source: “The Science of Why We Don't Believe Science: How our brains fool us on climate, creationism, and the vaccine-autism link,” by Chris Mooney, Mother Jones May/June 2011 Issue To access Mooney’s insightful article, click here -
scaddenp at 06:17 AM on 21 December 2011The End of the Hothouse
"The science on this subject is very clear. There is every scientific reason to dismiss claims that CO2 drop triggered the temperature drop of the Southern Ocean and Antarctica. Well I find the "science" somewhat lacking. Faced with Hypothesis 1 - development of ACC caused sufficient ocean cooling to draw-down CO2; and Hypothesis 2 - increased weathering from orogenesis caused CO2 drawdown, the scientific approach would be look for data that could separate them. Off the top of my head, I can think of a couple of things to check. Firstly, as others have done, there is the question of timing. Which event preceded the CO2 drop? Second, if ocean cooling was cause of CO2 drop, then do ocean temperature proxies support sufficient cooling to match the CO2 draw down? Since the same core would yield both the CO2 proxy and temperature proxy, then dating shouldnt be a major issue. Finally, if orogenesis is the cause, then a proxy for weathering would be sediment flux into ocean basins (if you are eroding then the sediment has to go somewhere). My own databases on the basins do not have sufficient time resolution to answer this (oh for some more funding), but I would imagine that the basins are sufficiently well known to at least do a back-of-the-envelope calculation. Sadly full-blown sedflux studies are very expensive but its possible that data is there. GeoCarb III might have done this - bound to have tried it at first order anyway. Both approaches require arithmetic rather than handwaving. I would find this more convincing. -
Stephen Baines at 05:52 AM on 21 December 2011Foster and Rahmstorf Measure the Global Warming Signal
BTW...much of my reasoning for discounting the effect of the AMO can also be applied to the PDO, which has exhibited several distinct shifts since '79 - including a late 90s shift to an extended negative phase. None of those shifts are apparent in the corrected temperature data in F&R. And again, the exact mechanism by which the PDO would affect global temperatures is not clear to me. Again, maybe others can help me there. -
Stephen Baines at 05:36 AM on 21 December 2011Foster and Rahmstorf Measure the Global Warming Signal
skept.fr My point @9 is that, were the AMO index influencing global temperature, the evidence for such an effect should have become clearer after Foster and Rahmstorf statistically removed the influence of other factors from the times series. All of those other factors have very distinct temporal signatures from the AMO index and could have obscured the influence of the AMO. However, there is no apparent trace of the AMO in the temperature data once those factors have been accounted for. The AMO index shifted sharply from a cold to warm phase starting in the 90s (see the Knudsen 2011 paper). By contrast, F&Rs corrected temperature series during the 90s shows a steady linear increase. There is not even a hint of a change in rate of warming during and after the 90s, as would be expected were the AMO important. On a more abstract statistical level, it's a little problematic trying to fit a cycle with a period twice as long as temperature record being used. It's also hard to know how to correct the AMO for the influence of AGW without seeming a little arbitrary. From what I can tell that's because we don't understand it well - it's not even clear to me that there is a consensus that it is actually a regular feature of the ocean-climate system. On a more general level...I understand the mechanism for how ENSO affects global balance of heat distribution between the atmosphere and the ocean - through its effect on intensity and distribution of deep water upwelling. But, what is the mechanism proposed for any influence of the AMO on global atmopsheric temperatures? Is there one? As far as can tell it's just an SST index. Is it supposed to be related to the intensity of meriodional overturning circulation, or some other process that could affect storage of heat in the ocean? -
Tristan at 05:31 AM on 21 December 2011Foster and Rahmstorf Measure the Global Warming Signal
skept.fr Certain statistical conventions in scientific publication aren't necessarily the best means of determining the 'weight' of evidence. Foster illustrates that when this particular event (which appears to pass the 99% 'significance' level) is given more context, it doesn't seem quite as compelling (roughly 7 times less compelling). The difference between 95% and 93% should not simply be the difference between yes and no. Unfortunately a lot of university courses teach just that. -
muoncounter at 05:17 AM on 21 December 2011It's the sun
dana, Here is a slightly different version of your Figure 3 (in the advanced rebuttal) from a slide talk by Dr. Nathan Schwandron, a professor/researcher in space and plasma physics at the University of New Hampshire. The peak value was in the early 80s. The figure shows a compilation of 45 years of satellite-era total solar magnetic flux (Note: that is not the same usage of flux as in radiative flux (Watts/meter2); it is magnetic field flux, Phi-B = B.A, where B is field strength in Tesla, A is a cross-sectional surface area and . is dot product. Phi-B is thus measured in webers = Tesla meter2).
Dr. Schwandron demonstrates that magnetic field flux is an excellent proxy for solar corona temperature - which dropped precipitously during the cycle 23/24 minimum of 2009. The reduced magnetic field flux has also driven the strength of the IMF (inter-planetary magnetic field), as measured at the earth, to a deep low. This point from Dr. Schwandron's talk is very interesting:
Space age context shows 1970’s also an era of lower coronal temperatures
We know that the 70s was a cool decade (and not just because of all this cool stuff). The reconstructed solar coronal temperature shows 2005-2009 to be even cooler. And yet,
The figure shows a compilation of 45 years of satellite-era total solar magnetic flux (Note: that is not the same usage of flux as in radiative flux (Watts/meter2); it is magnetic field flux, Phi-B = B.A, where B is field strength in Tesla, A is a cross-sectional surface area and . is dot product. Phi-B is thus measured in webers = Tesla meter2).
Dr. Schwandron demonstrates that magnetic field flux is an excellent proxy for solar corona temperature - which dropped precipitously during the cycle 23/24 minimum of 2009. The reduced magnetic field flux has also driven the strength of the IMF (inter-planetary magnetic field), as measured at the earth, to a deep low. This point from Dr. Schwandron's talk is very interesting:
Space age context shows 1970’s also an era of lower coronal temperatures
We know that the 70s was a cool decade (and not just because of all this cool stuff). The reconstructed solar coronal temperature shows 2005-2009 to be even cooler. And yet,
 and
and
 do not show this cooling (on earth) in any way, shape or form.
So no, it's not the sun.
do not show this cooling (on earth) in any way, shape or form.
So no, it's not the sun.
-
AussieinUSA at 05:10 AM on 21 December 2011The Media & Global Climate Science Communication
Quick question regarding the graphs......'Negative' means that it is anti-AGW article? -
skept.fr at 04:46 AM on 21 December 2011Foster and Rahmstorf Measure the Global Warming Signal
#30 Tom Curtis : OK, that's not rhetoric, I'm not specialist at all of statistics, so I neglected the nuance between 93% / 95% confidence. You're right. But from the exchanges between Tamino and the authors, I understood they agree that the method used by Knudsen is a kind of standard in the literature, even if too imprecise. Dr Knudsen : "We are not completely happy about this way of describing significance. It may easily create a feeling by the average reader that significances are higher than they really are. But we have adhered to this standard used in other literature on the subject." Tamino answer : "Honestly, I agree that their approach is perfectly valid, and that it is in accord with the way this kind of analysis is treated in the literature. I’ll also agree that it is easy for these results to be misinterpreted." So, for a layman (again, I'm dull in that matter), the point is totally unclear, if Knudsen et al did what is usually done in paleoclimate or oscillation studies, does it mean that Tamino critics would lessen significance of most results in theses fields? Anyway and beside Knudsen 2011, there are currently many discussions on AMO periodicity (or reality) on different timescales, for example Vincze 2001 , Marullo 2011 , Wyatt 2010, etc. (A lot of hits in Google Scholar, just give here some recent results about these discussion, I think the first one from Vincze is a pdf of interest for persons with a good knowledge of statistics.) So, for my initial point, unless there is a clear proof that AMO signal is an artifact, or 100% produced by AGW, or without any effect on a 32 years period of T, I suggest the opportunity of removing or not removing this signal could be a matter of debate among climate community. Would you agree with this cautious conclusion or do you think I still miss a point that justifies with certainty or near certainty the ignorance of AMO as a partial noise (like ENSO but not with the same magnitude and not the same statistics of lag/lead response to T)? -
Tom Curtis at 04:11 AM on 21 December 2011The End of the Hothouse
TIS @23, thankyou for the correction on the Drake Passage (and serves me right for relying on my faulty memory). With regard to your two hypotheses, the first Antarctic glaciation occurred 34 million years ago, at which time CO2 levels had fallen from less than 1000 ppmv. At that time, the Drake Passage looked like this: Although there is some evidence of Pacific water flowing through to the Atlantic at that time, there is no evidence it was anything but surface water passing through narrow channels. In the words of Lyle et al, 2007:
"The Antarctic Circumpolar Current (ACC) is a key feature of the Southern Ocean. Its development may have helped cool Antarctica and initiate Southern Hemisphere glaciation. The deep circulation of the ACC must have been established after both the Tasman gateway (between Antarctica and Australia) and the Drake Passage (between South America and Antarctica) opened. However, estimates for ACC initiation range over 20 m.y., from the middle Eocene to early Miocene. A new piston core of upper Oligocene to Holocene sediments from the South Pacific has allowed us to delimit the formation of the ACC to the late Oligocene (ca. 25–23 Ma). Upper Oligocene, current-worked sediments and a hiatus to the upper Miocene result from the beginning of the modern ACC flow; i.e., when strong currents and mixing throughout the water column were established. Previously published Nd isotope data date the first intrusion of Pacific water into the Atlantic much earlier. The discrepancy with our results can be reconciled by the different methods measuring different flow regimes. Tracer methods such as Nd are sensitive to relatively small and shallow incursions of water, whereas pelagic erosional regimes require vigorous deep flow."
(My emphasis). By 25-23 million years ago, the first time for which we have firm evidence of a circumpolar current, the Drake Passage looked like this: And here is the full progression of its development:
 So, on the evidence, Hypothesis 1 is that the geography of the Earth changes so as to cause a change in ocean currents, which causes the CO2 levels in the atmosphere to decline 10 million years before hand, by amounts which exceed the capacity of oceanic temperature changes to account for.
Personally, I prefer the real hypothesis two, not your strawman version, ie, that mountain building in the Rockies and Himalayas results in increased erosion, which results in increased sequestration of CO2, thus drawing down CO2 levels over a period of millions of years.
So, on the evidence, Hypothesis 1 is that the geography of the Earth changes so as to cause a change in ocean currents, which causes the CO2 levels in the atmosphere to decline 10 million years before hand, by amounts which exceed the capacity of oceanic temperature changes to account for.
Personally, I prefer the real hypothesis two, not your strawman version, ie, that mountain building in the Rockies and Himalayas results in increased erosion, which results in increased sequestration of CO2, thus drawing down CO2 levels over a period of millions of years.
-
muoncounter at 02:30 AM on 21 December 2011The End of the Hothouse
TIS#23: "The science on this subject is very clear. " So a hand wave is sufficient to dismiss the content of the paper that is the subject of this post. Perhaps that is because it is necessary to be dismissive of this particular point, rather than be truly skeptical. As noted here, this paper and prior work by the authors suggest that if CO2 drove temperature drop, it becomes very difficult to avoid a re-examination of the CO2-lags-temperature meme. A meme that is vital to pseudo-skeptic posturing over 'its not CO2.' BTW, if you look into that, the uncertainty in dating CO2 in ice cores is quite large (an oft-quoted lag of 800+/-600 years ought to make any true skeptic curious). Or is 75% uncertainty good enough for what passes as 'very clear science' in the world of pseudo-skepticism? -
Tom Curtis at 01:56 AM on 21 December 2011Foster and Rahmstorf Measure the Global Warming Signal
skept.fr @29, with respect, Tamino's purpose in 8000 years of AMO blog post was specifically to dispute the statistical significance of the results. He writes:"Although their results are both correct, and computed according to standard practices, an extreme caveat applies. A result which is reported as passing 99% significance, does not mean that it’s actually a 99% confidence periodic result! It would be, if and only if the test were applied only to a single, precisely determined, pre-defined test period. But the spectral analysis tests a wide range of periods (i.e., of frequencies), covering at least the plotted frequency range from 0.01 to 0.02 cycle/yr (periods from 50 to 100 yr). This means that there are lots more chances to get an apparently “significant” result — just by chance."
(Original emphasis) Later he analyses one "apparently significant result", and finds:"But what are the odds of finding a peak that strong when we scan the frequency range from 0.01 to 0.02 cycle/yr? I generated 500 white-noise data series with the same time sampling as the Agassiz d18O data from 6000 to 8000 yr BP. Then I computed the strength of the strongest peak in the DCDFT spectrum over the frequency range from 0.01 to 0.02 cycle/yr. This sample of 500 simulated noise spectra enabled me to define the probability distribution for the strongest peak in this case, and therefore to define the true significance level for the result from the Agassiz ice cap. It turns out that the peak which passes 99% confidence for a single-frequency test, is only significant at 93% confidence when taken in the context of having scanned a range of frequencies."
By convention, of course, results are only considered statistically significant if they are significant at 95% confidence level, so the Agassiz ice cap data for a 68 year period between 6 and 8 thousand years ago is tantalizingly close, but it is not statistically significant. Tamino continued:"I did similar tests (defining the probability distribution for the tallest peak by Monte-Carlo simulations) for the entire time span of the GISP2 d18O data. It turns out that all the plotted results fail to pass 90% significance except for a brief outburst of the 63-yr band between 6500 and 7000 yr BP."
In the face of this specific technical discussion, I think taking once rhetorical turn of phrase as defining Tamino's opinion is not warranted. -
skept.fr at 01:17 AM on 21 December 2011Foster and Rahmstorf Measure the Global Warming Signal
#27 Tom You’re right for AO ! (Decidedly, acronyms are perturbing for readers.) For AMO, I slightly disagree with your interpretation of Tamino-Foster point concerning the long term (8000 yrs for Knudsen et al. 2011) trend. In fact, as your link shows, Tamino concludes: «I will emphasize that the results are less “significant” than they may appear at first sight, so they should be treated as more tentative than definitive.» But this does not mean that there is «no statistically significant evidence of quasiperiodicity» (your point). So, the basic result of Knudsen (distinct ~55- to 70-year oscillations characterized the North Atlantic ocean-atmosphere variability over the past 8,000 years) is not contested, its statistical robustness is rather relativized by Tamino analysis. This 55-70 yrs AMO periodicity, if it really exists and is not a statistical artifact (to be confirmed, so), would imply the signal-noise analysis of 1979-2011 (32 yrs) period have to deal with it. The other Tamino-Foster article you linked (T leads AMO whereas ENSO leads T) probably explains the choice to include ENSO and ignore AMO in FR2011. But as the graph shows, peak correlation for the 2 months lag is just 0.4 and the distribution of time series suggest sometimes T lags AMO. Maybe this ‘sometimes’ is part of natural periodicity discussed in the previous point? -
Tom Curtis at 23:45 PM on 20 December 2011Foster and Rahmstorf Measure the Global Warming Signal
Arkadiusz Semczyszak, even in Polish, 1979-2010 does not equal 1901-2000. Therefore Viereck's claim is entirely consistent with Foster and Rahmstorf's result. Assuming they are consistent, we would expect (relatively) large increases in TSI prior to 1980, with a (relatively) small decline after 1980. And that indeed is what we see:
-
Tom Curtis at 23:08 PM on 20 December 2011Foster and Rahmstorf Measure the Global Warming Signal
skept.fr @24, as you correctly not Tamino (Foster) discusses the Atlantic Multidecadal Oscillation (AMO) on his blog. He has shown that the AMO is just detrended North Atlantic Sea Surface Temperature (SST) Anomaly, and that there is little evidence of anything more (your link). However, he has also shown that there is no statistically significant evidence of quasiperiodicity in the variations in North Atlantic SST of over the last 6000 years. He has also shown that the AMO lags temperatures land temperatures, rather than leads them, arguing against a causal role for the AMO. In his words:
"Now the peak correlation is at lag -2 months (again temperature leads AMO) and the difference from the lag 0 correlation is larger. I think this suggests two things. First, ... Second, the argument against causality from AMO to temperature is stronger. It’s still very weak — but based only on the time series, the argument for causality is even weaker."
In fact, rather than causality, I would suggest the lag is simply a consequence of the quicker response time of land surface temperatures relative to SST for a given forcing. With regard to the Pacific Decadal Oscillation (PDO), when Tamino first performed this analysis for his blog, the PDO was brought up in comments, so Tamino regressed against the PDO as well. The PDO did not show any significant effect. I believe only the AMO and PDO have been suggested as causes of a (purportedly) spurious anthropogenic warming signal by deniers. As a side note, AO is often used to refer to the Artic Oscillation, so its use to refer to Atmosphere/Ocean circulations while discussing various oceanic "oscillations" can be confusing. -
John Hartz at 22:55 PM on 20 December 2011Foster and Rahmstorf Measure the Global Warming Signal
For the record: I have great admiration and respect for Dana's analytic and communication skills. My apologies to him and to all for going overboard in making a point about the need to define scientific acronyms and terms. -
skept.fr at 22:20 PM on 20 December 2011Foster and Rahmstorf Measure the Global Warming Signal
PS : "LT T trend" better than "Ts trend" for Santer et al 2011. (For the acronyms, LT = lower troposphere, Ts for surface temperature). -
skept.fr at 21:56 PM on 20 December 2011Foster and Rahmstorf Measure the Global Warming Signal
#17 scaddenp # 19 skywatcher On his blog , Tamino have explained for example that the AMO signal is nothing but the AGW signal (so there is a trend) as North Atlantic temperature trend results of forcing : "Therefore global warming is the cause, not the effect, of much of the variation in the AMO". But why this would be true for AMO and not for all the other "O" including ENSO? Forcings and feedbacks act permanently on lapse rate, clouds, surface and vertical temperature profiles, wave propagation, etc. so I see no physical reason to suggest the frequency / intensity of oscillations will not be affected. Even a negative trend on a particular basin could be interpreted as a local and temporary effect of negative feedbacks – at least ‘theoretically’, this is what an AOGCM model is needed to analyse the possibility and probability of such event. You're right, models have no convergence on ENSO as recall Vecchi et Wittenberg 2010 for example : "the extent and character of the response of ENSO to increased in greenhouse gases are still a topic of considerable research, and given the results published to date, we cannot yet rule out possibilities of an increase, decrease, or no change in ENSO activity arising from increases in CO2. Yet we are fairly confident that ENSO variations will continue to occur and influence global climate in the coming decades and centuries.". Also of interest for readers Pierrehumbert and Benestad's point on Real Climate . For PDO, I've no particular information. Anyway, PDO, ENSO and AMO are probably not the only modes of variability (I’m pretty ignorant about the details of what climate scientists consider as ‘real’ quasi-periodic oscillations and their teleconnection in AO circulation). For example, Swanson and Tsonis 2009 have analysed what they called "shifts" in multidecadal variability (see Swanson’s op-ed on Real Climate) and M. Latif have some similar conclusions with GEOMAR model's team (see this page for GEOMAR publications, with many articles on this variability either natural or forced, particularly the Atlantic basin). That's why, for a period like 1979-2011 rather than a long term analysis 1900-2100 for example, I see the very precise distinction between noise and signal as a difficult exercise. There are many other convergent lines of evidence to consider the ~0,15 K /dec signal as the very likely result of GHGs forcing, but to say for example this GHG decadal signal is really 0,15 K rather than 0,11 K or 0,19 K seems to me very difficult, the removal of MEI-TSI-AOD noise being just a broad approach for that. And even without statistical work on signal and noise, we know that the stability of Ts trend in the 2000s is not a problem for AOGCMs, as they can obtain in their runs 17 years without trend (Santer el al 2011).
Prev 1347 1348 1349 1350 1351 1352 1353 1354 1355 1356 1357 1358 1359 1360 1361 1362 Next


