


 Arguments


Recent Comments
Prev 1349 1350 1351 1352 1353 1354 1355 1356 1357 1358 1359 1360 1361 1362 1363 1364 Next
Comments 67801 to 67850:
-
Bob Lacatena at 03:55 AM on 20 December 20112011: World’s 10th warmest year, warmest year with La Niña event, lowest Arctic sea ice volume
44, mace, This isn't the one I was looking for, but this post at Real Climate is a good introduction. -
Bob Lacatena at 03:50 AM on 20 December 20112011: World’s 10th warmest year, warmest year with La Niña event, lowest Arctic sea ice volume
44, mace, There's a lot to be learned about ENSO events to be able to answer your own question. I suggest you start with the National Weather Service Climate Prediction Center, although it's a bit "thick." I recently saw a simpler tutorial (there are a few around), but I can't remember where. If I dig it up, I'll add the link. -
mace at 03:35 AM on 20 December 20112011: World’s 10th warmest year, warmest year with La Niña event, lowest Arctic sea ice volume
What's causing this La Nina effect? Is the effect intermittent in some way. The dates in the article don't seem right. Looking at the records, it doesn't look like she kicked in until December 2010 and finished her merry dance in March 2011:- August 2010 3rd warmest September 2010 8th warmest October 2010 8th warmest November 2010 2nd warmest December 2010 17th warmest January 2011 17th warmest February 2011 17th warmest March 2011 13th warmest April 2011 7th warmest May 2011 10th warmest June 2011 7th warmest -
Tom Curtis at 02:59 AM on 20 December 2011Sea level fell in 2010
mace @16, the inland area of Eastern Australia, approximately the entire area of Queenland, New South Wales and Victoria inland of the Great Dividing Range, consists of three very large flood plains. The largest is the Murray Darling Basin, with an area of just over a million square kilometers. The Darling and tributaries drains nearly all of inland NSW, and a large section of southern Queensland, with a river system that drains into the Murray, and then into the sea in South Australia. Next largest is the Cooper Creek Catchment, with an area of 297,000 km^2. The Cooper Creek Catchement reaches as far north as my birth place, Mount Isa and drains into Lake Eyre, a normally dry salt pan below sea level. The area in Queensland drained by Cooper's Creek and the Diamantina (a tribuatary) is called the channel country because of the very large number of normally dry river beds that cross it.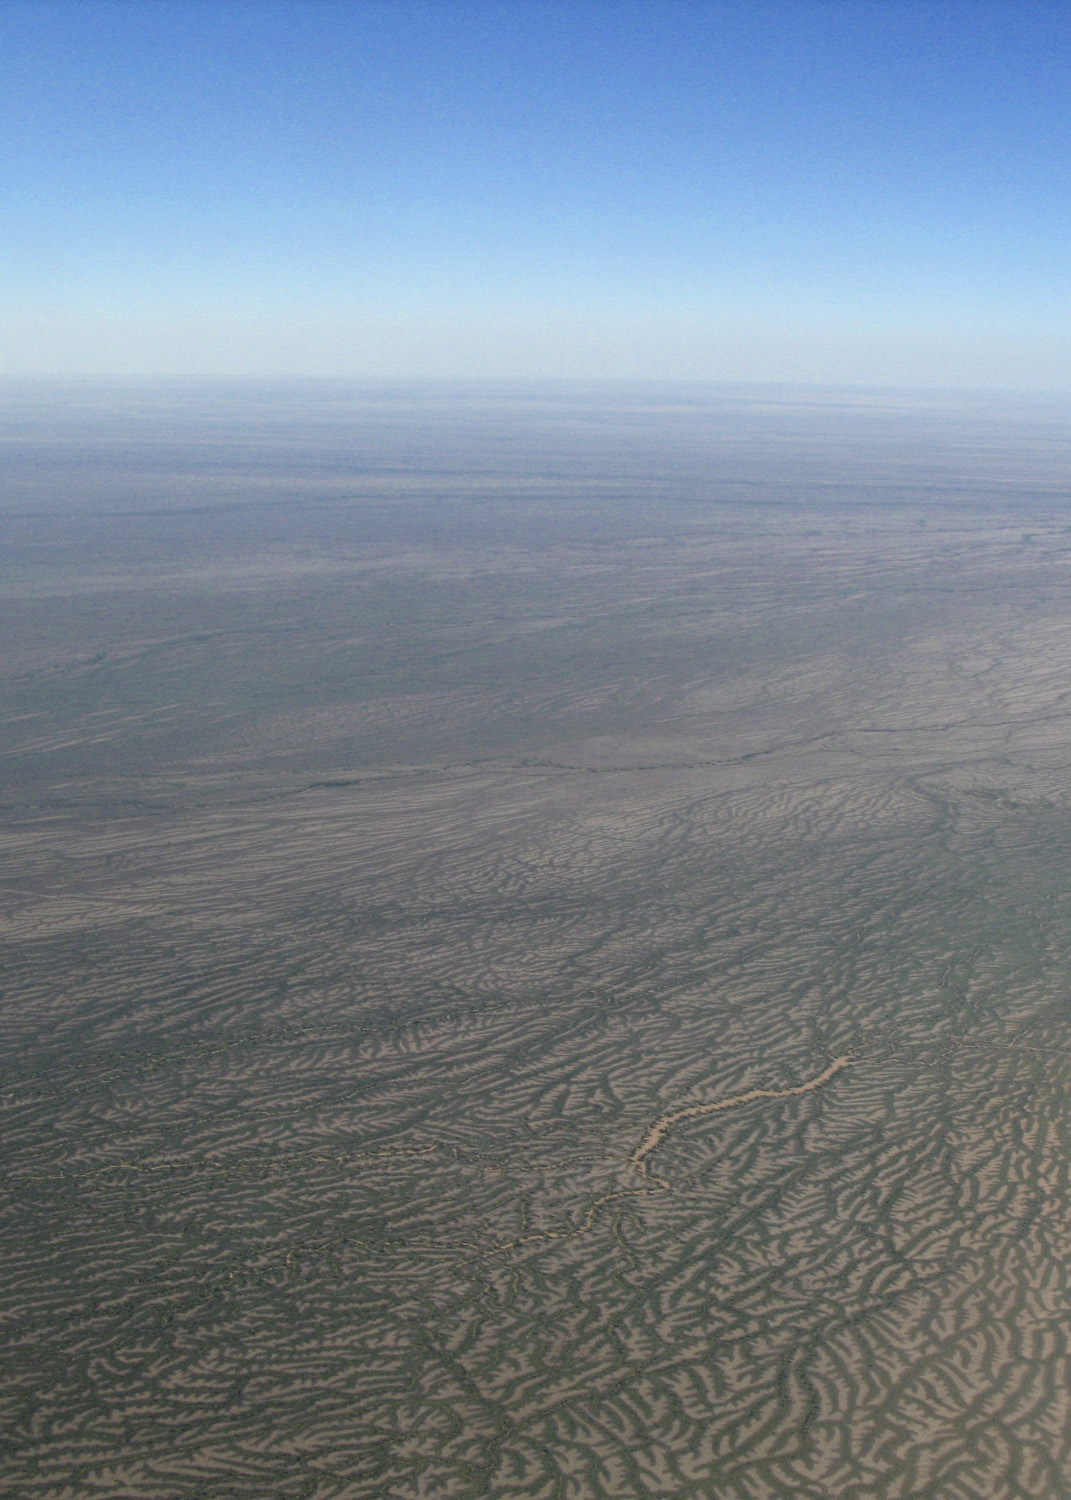 (Click on picture for full sized photo, which is well worth the look.)
North of the Cooper Creek Catchment is the Gulf Country, a wide area drained by a number of intermittently flowing rivers into the Gulf of Carpentaria. The area of the gulf country is about 186,000 km^2.
Combined, all three flood plains have an area approximately half of the Mississipi Basin, but unlike the Missisipi basin, most of the area is arid with only intermittently flowing rivers. It is also exceptionally flat. Floods in the Cooper Creek in Queensland take 9-10 months to travel its 1,300 km length to Lake Eyre. The land is so flat that raging floods travel at the glacial pace of 0.2 km/hour. Water traveling to the Murray down the Darling takes a similarly long time. Consequently much of the 2010 Queensland flood is either just now reaching the mouth of the Murray, or reached Lake Eyre a month or so ago, where it will now sit until it evaporates away. The land was so wet that the rivers in the channel country still have water in them.
In addition to this natural storage, many of Australia's dams where at very low capacity before the floods, but are now very full. Wivenhoe Dam near Brisbane, for example, would have captured a volume of water close to that of Sydney Harbour (mostly during 2010). Combined that means a truly staggering quantity of water is being stored in Australia's river systems and dams which was not there 2 years ago.
Dikran Marsupial is correct. The amount of water involved is not enough to account for the dip in sea level in 2010 by itself (and Australia was certainly not the only area flooded in 2010). Never-the-less, that water which is stored in Australia's rivers will not return to the sea as quickly as it was taken from it. It will be five or more years before Australia dries out (assuming we do not have ongoing rainfall, which we currently have). I suspect similar stories can be told in many other regions of the world, so while I expect sea levels to resume their inexorable rise, it will not be an immediate turn around.
(Click on picture for full sized photo, which is well worth the look.)
North of the Cooper Creek Catchment is the Gulf Country, a wide area drained by a number of intermittently flowing rivers into the Gulf of Carpentaria. The area of the gulf country is about 186,000 km^2.
Combined, all three flood plains have an area approximately half of the Mississipi Basin, but unlike the Missisipi basin, most of the area is arid with only intermittently flowing rivers. It is also exceptionally flat. Floods in the Cooper Creek in Queensland take 9-10 months to travel its 1,300 km length to Lake Eyre. The land is so flat that raging floods travel at the glacial pace of 0.2 km/hour. Water traveling to the Murray down the Darling takes a similarly long time. Consequently much of the 2010 Queensland flood is either just now reaching the mouth of the Murray, or reached Lake Eyre a month or so ago, where it will now sit until it evaporates away. The land was so wet that the rivers in the channel country still have water in them.
In addition to this natural storage, many of Australia's dams where at very low capacity before the floods, but are now very full. Wivenhoe Dam near Brisbane, for example, would have captured a volume of water close to that of Sydney Harbour (mostly during 2010). Combined that means a truly staggering quantity of water is being stored in Australia's river systems and dams which was not there 2 years ago.
Dikran Marsupial is correct. The amount of water involved is not enough to account for the dip in sea level in 2010 by itself (and Australia was certainly not the only area flooded in 2010). Never-the-less, that water which is stored in Australia's rivers will not return to the sea as quickly as it was taken from it. It will be five or more years before Australia dries out (assuming we do not have ongoing rainfall, which we currently have). I suspect similar stories can be told in many other regions of the world, so while I expect sea levels to resume their inexorable rise, it will not be an immediate turn around.
-
mace at 01:28 AM on 20 December 2011Sea level fell in 2010
Hi Daniel Bailey, thanks for letting me post on more threads but I think I'll stick to just this one as I need to internalize my thoughts. The topic's about sea level falling, and the articles saying that this is because of more rain falling on the land than is normal. Obviously, rain would normally run off the land in to the rivers and oceans pretty quick, so I'm trying to think up why this hasn't happened in 2010. It dawned no me that it might be that it's being sucked in to the land, so I looked at the countries in figure 2 of the GRACE diagram, and Australia looked a likely candidate for this sponge effect. There definitely seems to be slightly more dark blue than dark orange in that picture, and the two can't be convoluted because the dark blue indicates higher quantities of surface lying water but it doesn't factor in how much has been absorbed in to the earth. The direct link is here:- http://grace.jpl.nasa.gov/news/index.cfm?FuseAction=ShowNews&NewsID=53 A Nasa climate scientist, Josh Willis, has put it more eloquently than I can, but I reckon he's saying the same thing. I guess we'll have to wait until next year for an update of the sea level data. Even if it doesn't show a bounceback, I think this could be due to a lagging effect as the water has to penetrate through the rock to get back to the sea. -
Daniel Bailey at 00:51 AM on 20 December 2011Sea level fell in 2010
mace, you are welcome to post comments to as many threads as you feel capable of carrying on a dialogue on with any who participate with you, provided you are on-topic for that particular thread and that your comments comply with the Comments Policy (here). That being said (per Dikran above), for better internalization of things learned, fewer is probably best. Also note that this is a science-based website, so any hypothesis one wishes to float would need be accompanied by supportive references to the peer-reviewed literature. -
Daniel Bailey at 00:04 AM on 20 December 2011Arctic settles into new phase – warmer, greener, and less ice
CBD, I believe you refer to the Tietsche et al 2011 paper. Note that a limitation of Tietsche is that the presumption is that stable CO2 concentrations have been achieved and equilibria with temps then reached. We are far, far from those conditions. Tietsche thus remains an academic construct. -
mace at 00:00 AM on 20 December 2011Sea level fell in 2010
Sorry about that Dikran. I kind of see your point now about Australia but I read the article and previous posts so just wanted to launch a hypothesis out there to see if any fellows felt it was plausible. The article also identifies Columbia, the US, Brazil and Pakistan as having some heavy flooding. I don't think it's quite so dry in those places, though, so I agree my hypothesis is probably falling down. I think I've only posted to 2 threads, so far but apologies again. I will confine my posts to just 1 thread in the future. -
Dikran Marsupial at 23:40 PM on 19 December 2011Sea level fell in 2010
mace@12 Please try to use some self-skepticism when putting forward a new hypothesis and at least apply a sanity check before posting. The surface area of the worlds oceans is ~3.6×10^8 km2, the surface area of Australia is only 7,617,930 km2, 1/47th of the surface area of the oceans. So for Australia as a sponge absorbing a 6mm rise in seal levels would be equivalent to absorbing 282mm of rainfall over its entire surface (most of which doesn't get much rainfall). Do you think that is at all plausible? If mean sea level were that sensitive to local flooding, it would bounce up and down like a yo-yo. Also I would suggest that you should confine yourself to discussion on a smaller number of threads. Your posts rather suggest a lack of basic knowledge on a number of basic topics, and posting wild theories like this gives the impression of trolling/spamming, especially when posted to multiple threads. This is intended as friendly advice, there is plenty of time to discuss these topics, and science is better served by depth of discussion rather than breadth. -
CBDunkerson at 23:24 PM on 19 December 2011Models are unreliable
mace wrote: "Can we conclude, that if the ice melts in Greenland, rather than the sea level increasing as many may expect, the global warming will cause seawater to evaporate and hang in the atmosphere." No. A warmer Earth does mean more water vapor, but the increased atmospheric water vapor content is much smaller than the increase in liquid water due to ice melt. The planet would have to get very hot (c.f. Venus) in order for that to stop being true. As to cloud feedbacks... there has been alot of research on the positive and negative feedback effects of clouds which you elude to. The exact net value is still uncertain, but it has been narrowed down to 'small'. That is, whatever the exact value it isn't going to have a major impact on the climate compared to the more prominent factors; CO2 forcing, water vapor feedback, and ice albedo feedback. -
CBDunkerson at 23:16 PM on 19 December 2011Arctic settles into new phase – warmer, greener, and less ice
I don't think there is any chance of the Arctic 'stabilizing' to a 'new normal' any time soon. Even if greenhouse gas levels magically leveled off we'd continue to see continued ice loss and related changes for decades, if not centuries, to come. I recall a study a year or two ago which concluded that if Arctic temperatures/conditions returned to 'normal' the sea ice could recover and therefor there was no 'death spiral'... which never made much sense to me because it should be obvious by now that there isn't going to be any 'return to normal'. That 'normal' is gone. The conditions which allowed it no longer exist. -
mace at 23:05 PM on 19 December 2011Models are unreliable
Hansen has said in this paper that water vapour is the dominant greenhouse gas, rather than CO2 or methane. Can we conclude, that if the ice melts in Greenland, rather than the sea level increasing as many may expect, the global warming will cause seawater to evaporate and hang in the atmosphere. Not sure if more cloudy conditions would cause the earth to cool due to sunlight being unable to penetrate or to warm, as it acts like a blanket keeping the land warm. Any thoughts on this? -
Eric (skeptic) at 22:55 PM on 19 December 2011Models are unreliable
scaddenp, Hansen et al 1992 predicted a 0.5C drop and the observed drop was 0.3 (see http://paos.colorado.edu/~dcn/ATOC6020/papers/Soden_etal_727.pdf) The difference is usually attributed to El Nino in 1992 (see fig 2a in Soden). I am not so sure since that figure shows the model preceding the observed-ENSO drop by about 6 months and that is not explained. -
mace at 22:31 PM on 19 December 2011Sea level fell in 2010
6mm drop in sea level may sound like a lot when you consider all of the world's oceans, but Australia was bone dry prior to the recent floods, so rather than the rain run off the land in to the rivers/oceans as you'd expect, it soaked it up like a sponge. -
jyyh at 17:49 PM on 19 December 2011Arctic settles into new phase – warmer, greener, and less ice
As the average winter max is somewhere at 13-14 Mkm2, extrapolating the running average graph to somewhere between 6.5-7 Mkm2 would mean the earliest year of ice free summer (at least in sept) up there. Just guessing here, of course, a major volcano would likely delay that for a couple of years, and an enormous eruption somewhat longer still. http://www.wunderground.com/blog/JeffMasters/comment.html?entrynum=2003# discusses of the meteorological effects of ice free arctic. -
jyyh at 16:16 PM on 19 December 2011Arctic settles into new phase – warmer, greener, and less ice
that's the running average of Ice up north. don't know where that part of the text went. -
jyyh at 16:14 PM on 19 December 2011Arctic settles into new phase – warmer, greener, and less ice
Let's see if that shows:
The X-axis is the fraction of the year. It looks like the Arctic Ice amount is affected little by ENSO events, if at all, so Atlantic heat transport and general atmospheric warming would be the largest melters of the Arctic Ice.
-
scaddenp at 14:31 PM on 19 December 2011There is no consensus
I dont think Hansen 2000 establishes a crack in the consensus. The uncertainties were quickly resolved and in Hansen et al, 2002: "Climate forcings in Goddard Institute for Space Studies SI2000 simulations" Hansen was able to conclude: "The greenhouse gas forcings are known with reasonably good accuracy. CO2 (1.4 W/m2) has the largest forcing, but the CH4 forcing is half as large when its indirect effects on stratospheric H2O and tropospheric O3 are included, and the sum of non-CO2 greenhouse gas forcings exceeds the CO2 forcing." AR4 papers improve on that. The current knowledge on greenhouse attribution can be found in Schmidt et al 2010. Got anything that challenges that paper? -
muoncounter at 13:03 PM on 19 December 2011Arctic settles into new phase – warmer, greener, and less ice
TomC: That's something we discussed on prior Arctic ice threads - summer minimum extent is dropping like a rock, winter maximum extent less so. That has to translate to a more rapid or an extended melt season. Consistent with the results described by Jeff Masters here. As Earth's climate has warmed over the past 30 years, the Northern Hemisphere has seen a dramatic drop in the amount of snow cover in spring (April, May, and June.) Spring is coming earlier by an average of three days per decade, and the earlier arrival of spring has significantly reduced the amount of snow on the ground in May. Less snow on the ground means the land surface can heat up more readily, and May temperatures in Arctic have increased significantly over the past 30 years. Consistent, too, with Arctic amplification and feedback due to the increased area of exposed sea water for more of the year. BTW, my questions in #2 were rhetorical. -
scaddenp at 12:42 PM on 19 December 2011Models are unreliable
Further on volcano predictions - in fact climate modeller did make very accurate predictions about the effects of the Pinatuba eruption as it happened. See Potential climate impact of Mount Pinatubo eruption Hansen et al 1992. -
skywatcher at 12:42 PM on 19 December 2011There is no consensus
Jdey #497 It's hard to forecast the weather more than a few days ahead, yet amazingly we can have (in the NH) real confidence that June will be warmer than December, and that June's temperature will lie within a particular range. GHGs play the role of the height of the Sun in the climate version of this analogy - the strong longer-term forcing that does not immediately dominate the vagaries of day-to-day weather, but inevitably wins in the end. Scientific theories are the best we have (read up on what a theory is). What are scientific 'facts'? -
DSL at 12:40 PM on 19 December 2011There is no consensus
Jdey123, what do you make of that paper from Hansen et al. 11 years ago? Did you read the whole thing, and do you think that Hansen currently thinks that CO2 is not the dominant forcing where recent warming is concerned? It's easy to point to abstracts and say, "see! see!," but perhaps you can tell us what you think the paper says. I do note that it does say that CO2 and CH4 are the principal GHGs. -
scaddenp at 12:20 PM on 19 December 2011Models are unreliable
Let's be clear about what happens in the modelling process. There is the famous George Box statement. "Essentially, all models are wrong, but some are useful". When you hindcast, you find models capture some observations but all. So what do you do to improve the model? In a physics model, you add more physics. Beyond bugs in the code, a failure in the model is physics not working. A lot of that has to with simplifications necessary for hardware of the time, so it's choose the important stuff. In 1975, "Broecker, W.S. 1975. "Are We on the Brink of a Pronounced Global Warming?" used Manabe's model to make a very good fist of predicting the 2010 temperature. However, the Manabe model was so primitive, that it had little to say of use about a great many other parameters. Improving computer power allows better spatial and temporal resolutions; more direct physics calculations rather than parameterisations etc. You will have no trouble finding things that the models still dont capture well - ask the modellers - but more and more of the important stuff go in. What doesnt happen in the process is tweaking numbers to fit a line. There are parametrizations made from empirical data - eg evaporation as function of temperature,humidity and wind speed - but the fitting is done in terms of data on evaporation, temperature and windspeed, not fiddling the function to make achieve say a particular global temperature curve. -
Tom Curtis at 12:16 PM on 19 December 2011Arctic settles into new phase – warmer, greener, and less ice
Muoncounter @2, the fluctuations are largely due to seasonal variations. However, between 1997 and 2007 the difference between the winter and summer anomalies was around 1 million square kilometers. Post 2007, it is closer to 1.75 million square kilometers. That is partly because the winter anomaly has not declined since 2007, while the summer anomaly continues its death spiral. However, contrary to DeWitt Payne, I think 5 years is two short an interval to suggest that this is a new seasonal pattern rather than just noise. On the other hand, at some stage in a continuing death spiral of summer ice, we would expect this pattern to emerge. In the near term limit, winter ice will still form extensively, while the summer ice will shrink to near zero. In the medium term we would then expect the winter ice to gradually shrink in area as the summer water temperatures start to climb in the absence of ice. Consequently the pattern over the last few years may be this pattern (continuing winter ice, and low or no summer ice) starting to assert itself. It is just too early to say IMO. -
muoncounter at 11:49 AM on 19 December 2011Arctic settles into new phase – warmer, greener, and less ice
If you are talking about this Cryosphere Today graph, aren't the 'big spikes upward and downward' the seasonal variation? And isn't the very-well defined trend down?
-
DeWitt Payne at 11:41 AM on 19 December 2011Arctic settles into new phase – warmer, greener, and less ice
There has certainly been a shift in the seasonal behavior of NH sea ice area. The new seasonal pattern that appears to have been established in 2007 is significantly different from that observed by satellite from 1979-2006 and appears to be reasonably stable, at least through 2011. That's why the anomaly data for NH sea ice area at Cryosphere Today calculated using the 1979-2008 average, for example, shows big spikes upward and downward starting in 2007. -
Bob Lacatena at 11:14 AM on 19 December 2011Models are unreliable
431, mace, Not based on, but tested with. The models are physics based, but may be run over past periods so that the outcomes of the model can be compared to what we know already happened. And GHG's are a significantly stronger forcing agent on climate scales, but not simple monthly to inter-annual variability. The swings from one year to the next or over several years are still large. Consider the monthly and annual changes in temperatures here, versus the trend, using the BEST data:
-
Dikran Marsupial at 10:44 AM on 19 December 2011Models are unreliable
mace@431, GHG may be the dominant forcing, but that doesn't mean that their effect on climate dominates unforced variability on short timescales (e.g. 15 years). GCMs are just approaching the point where decadal predictions are beginning to be interesting. There was a good article at RealClimate on this recently. -
mace at 08:49 AM on 19 December 2011Models are unreliable
Stephen Baines, the article to which these comments are attached says that the model is based on hindcasting. I thought GHGs were already large enough to be a significantly stronger forcing agent than natural sources. It's only deniers who claim otherwise. -
Stephen Baines at 08:02 AM on 19 December 2011Models are unreliable
Jdey, The reason we observed climate change is thought to be manmade is because it is consistent with the physics, not due to extrapolation from statistical correlations. The models are not statistical -- they cannot behave differently than dictated by the physics of radiation, heat transfer, mass flow, etc. That physics is based on an enormous amount of experimental, observational and theoretical work that has built up over the years, and must be acknowledged. Given this physics and observed forcings (GHG, aerosols, solar), the only way to explain the recent global warming is via greenhouse gasses. Morever, given good input on forcings, the models do very well at predicting their consequences for climate past and present. It's that simple. It's crazy to compare climate models to the stock market models; they are apples and oranges. The rules governing the stock market are poorly understood and possibly maleable through time depending on human behavior and perceptions. We can use complex statistical time series analysis to analyse these patterns, but we cannot say for sure whether the rules governing the patterns we see now will not change in the future. It's a real and difficult challenge for that field - hats off to them for trying. In physics, by contrast, the factors do not change through time. As long as you capture the key variables, your will do OK. And there are many, many well established constraints that limit the range of possible solutions. In that sense, climate scientists have it easy! That's why Arhenius 100 years ago was able to estimate pretty well the CO2 climate sensitivity, and why models haven't really deviated far from that number much in the intervening century. Also, it isn't so hard to understand the inability to predict changes due to greenhouse changes for periods less than 15 years. The signal from GHGs accumulating increases over time while variation from natural sources does not. So naturally the effect of GHG will be more obvious over longer time scales, when it is larger relative to background natural variation. -
Bibliovermis at 07:51 AM on 19 December 2011Models are unreliable
Are you extrapolating past history based on curve-fitting or physical basis? Conflating "beliefs" with independently validated scientific research leads me to conclude curve-fitting. -
Jdey123 at 07:45 AM on 19 December 2011Models are unreliable
Bibliovermis, the thread is about whether the climate change model is reliable or not. Given that we have to wait until 2100 to prove whether it is or not, we have to examine the beliefs that this model is based upon. One of which is that you can extrapolate past history.Response:[DB] Let the reader note that Jdey123 found compliance with the Comments Policy too onerous a burden.
-
Bibliovermis at 07:41 AM on 19 December 2011Models are unreliable
Statistics with no physical basis describing a matter of physics is a perfect example of "lies, damned lies, and statistics." This would be why your comments conflating stock market analysis with climatology are being deleted, at least in my non-moderator opinion. -
Jdey123 at 07:41 AM on 19 December 2011Models are unreliable
(- off topic snipped -]Moderator Response:[muon] This isn't about the weather, its about the climate; you apparently do not know the difference. Anyone investing in the market must have a reasonable expectation that his or her investment will increase in value over a long enough term; that's climate. Day-to-day, week-to-week fluctuations: weather.
[DB] See the previous moderated comment. -
scaddenp at 07:35 AM on 19 December 2011Models are unreliable
Re Dow. Well actually I expect that stock market does in fact respond to forcings but there isnt a quantitative model to test. Climate IS different. There is a quantitative model based on known physics not a deduction based on observation of a trend. The models are not one dimensional. They make a huge no. of predictions on wide variety of parameters with spatial and vertical structures. These predictions vary in robustness but all amount to tests of the model. The evolving climate is a continuous test of these predictions. Please learn how to do hyperlinks (see tips below comment box). -
Jdey123 at 07:20 AM on 19 December 2011Models are unreliable
Ok, so my example including hyperlinks showing why stock market prediction is analogous to climate prediction and showing why extrapolating historical trends has been deleted. The post was on topic and scientific, so why has this been deleted?Moderator Response:[muon] This is not about the stock market. There are several threads dealing with the overall accuracy of past climate predictions - as well as the overall inaccuracy of predictions made by those in denial.
You've been counseled multiple times on other threads to read, learn and follow the Comments Policy. As you were already told, posting on this forum is a privilege, not a right.
[DB] Ok, you have now had 3 4 comments deleted since this one was posted, all of which amount to moderation complaints, trolling and taunting. No more warnings. Zero.
Either adhere to the Comments Policy, a rule the vast majority of participants here have no difficulties whatsoever in adhering to, or you "choose to recuse yourself from this venue".
Your call.
-
funglestrumpet at 07:16 AM on 19 December 2011NASA: Climate Change May Bring Big Ecosystem Changes
Has there been any attempt to fit the data to catastrophe theory? It has often occurred to me that if the ‘y’ axis showed rate of food production, ‘x’ axis showed the temperature and the ‘z’ axis the rate of temperature increase, there would be a fold in the resulting plot that would eventually show a catastrophic fall in food production. This would be when the surviveable environment for a species moved quicker than the speed at which it could migrate. Clearly this would vary with location and species etc. but I think we should not let it creep up on us by surprise. -
scaddenp at 07:09 AM on 19 December 2011Models are unreliable
Jdey123 - the reasons why models have little skill with decadal-level prediction are well understood. It may improve, but this has little to do with the skill of models designed to predict climate not weather. You do understand the difference between a climate model and a weather model? I would note that models are very successful at predictions within their domain. eg look here (Noting the papers cited both in making the prediction and observing it). As to volcanoes - models respond to specific aerosol loadings at given altitudes and locations. Until a volcano erupts, you dont know what these will be. Instead models use scenarios to put in volcanoes at the rate they are normally observed. If you look at any of the climate models predictions beyond the present you will see downturn spikes in places (and they will be different for different models and for different runs of the same model). These are simulated volcanoes. They are not saying that there will be a volcano at this time and place, but if they didnt put periodic volcanoes into the scenario, then the temperatures would be too high. (A long span of very quiet volcano activity is in effect a natural forcing). If you think that code is "fitted" to reproduce volcano change, then you could take code from before eruption, put the volcano into the scenario, and rerun. Glory awaits you if this doesnt match the published outputs from scientists doing the very same thing. -
Jdey123 at 07:00 AM on 19 December 2011There is no consensus
http://www.ncbi.nlm.nih.gov/pmc/articles/PMC27611/?tool=pmcentrez "A common view is that the current global warming rate will continue or accelerate. But we argue that rapid warming in recent decades has been driven mainly by non-CO2 greenhouse gases (GHGs), such as chlorofluorocarbons, CH4, and N2O, not by the products of fossil fuel burning, CO2 and aerosols, the positive and negative climate forcings of which are partially offsetting. The growth rate of non-CO2 GHGs has declined in the past decade. If sources of CH4 and O3 precursors were reduced in the future, the change in climate forcing by non-CO2 GHGs in the next 50 years could be near zero. Combined with a reduction of black carbon emissions and plausible success in slowing CO2 emissions, this reduction of non-CO2 GHGs could lead to a decline in the rate of global warming, reducing the danger of dramatic climate change. Such a focus on air pollution has practical benefits that unite the interests of developed and developing countries. However, assessment of ongoing and future climate change requires composition-specific long-term global monitoring of aerosol properties." Global warming in the twenty-first century: An alternative scenario James Hansen,*† Makiko Sato,*‡ Reto Ruedy,* Andrew Lacis,* and Valdar Oinas*§ June 16, 2000 -
scaddenp at 06:53 AM on 19 December 2011There is no consensus
Jdey123 - I think you find that this site is happy to argue about different viewpoints - provided the person does so in the correct place, in keeping with the comment policy. Everyone except John is a guest here. it is far more constructive to arguments about models on a models thread. Also, arguments about science need to proceed from discussion of data and publications, not misinformed opinion. So, in keeping with topic of this thread, perhaps you could tell us on basis you make this statement? "There is still no concensus amongst warmists as to which greenhouse gas is the main culprit.". As far as I know, this is flat out wrong. Show me otherwise. -
Jdey123 at 06:46 AM on 19 December 2011Models are unreliable
"Where models have been running for sufficient time, they have also been proved to make accurate predictions. For example, the eruption of Mt. Pinatubo allowed modellers to test the accuracy of models by feeding in the data about the eruption. The models successfully predicted the climatic response after the eruption." I note that there is no hyperlink to any report which actually proves that a model was produced prior to an eruption taking place, that the prediction was proved correct in terms of the volcanic eruption's effect on the global mean temperature. -
Jdey123 at 06:42 AM on 19 December 2011Models are unreliable
"If a model can correctly predict trends from a starting point somewhere in the past, we could expect it to predict with reasonable certainty what might happen in the future." Interesting point of view. See my Nikkei example which demolishes that thought. -
Jdey123 at 06:34 AM on 19 December 2011Models are unreliable
skywatcher. The weather varies from day to day because of atmospheric pressure and wind blowing either hot or cold air from other areas of the planet on to the location that you're observing the weather from. Now, if manmade pollution is the main factor that governs climate change, and natural forcing agents are a much lesser factor, then why can't you predict the global mean temperature next year, 5 years, 10 years, 15 years etc. with a reasonable degree of confidence? -
Jdey123 at 06:02 AM on 19 December 2011There is no consensus
(-Snip-)Response:[DB] Moderation complaints snipped.
Please note that posting comments here at SkS is a privilege, not a right. This privilege can and will be rescinded if the posting individual continues to treat adherence to the Comments Policy as optional, rather than the mandatory condition of participating in this online forum.
Moderating this site is a tiresome chore, particularly when commentators repeatedly submit offensive or off-topic posts. We really appreciate people's cooperation in abiding by the Comments Policy, which is largely responsible for the quality of this site.
Finally, please understand that moderation policies are not open for discussion. If you find yourself incapable of abiding by these common set of rules that everyone else observes, then a change of venues is in the offing.Please take the time to review the policy and ensure future comments are in full compliance with it. Thanks for your understanding and compliance in this matter.
-
Jdey123 at 05:59 AM on 19 December 2011There is no consensus
Eric, when you produce a model that can predict the future global mean temperature, then it becomes science. In the mean time, it's theory. Weather forecasters are at least correct most of the time for a 1 day forecast. They may not be 100% correct, but they're correct often enough that most people have confidence in 1 day forecasts. Most people also have little confidence in forecasts greater than a few days. At 1 point, forecasters rather ambitiously used to issue seasonal forecasts but were wrong so often, they lost complete credibility. With climate change, we're told that the model can't be accurate either in the short or long term due to too many complicating factors. (-inflammatory snipped-). It will no doubt take a supercomputer bigger than what we have today and years of research, but humanity will eventually be able to crack this. As I've mentioned in my last post, I'm fine with the demand that mankind reducing pollution but I'm not ok with calling a theory, scientific fact.What exactly is my supposed political agenda here?Response:[DB] Please refrain from introducing politics into the discussion. This is not a thread devoted to politics & climate science (others do exist that cover that).
Also, your discussion of models is off-topic on this thread. Please use the Models are unreliable thread for that. Thanks!
-
kampmannpeine at 05:57 AM on 19 December 2011NASA: Climate Change May Bring Big Ecosystem Changes
I am mostly afraid about Earth becoming like Venus some day - I just read about the findings of CH4 in a German newspaper -
Daniel Bailey at 05:43 AM on 19 December 20112nd law of thermodynamics contradicts greenhouse theory
@ Bob Loblaw It was about a year ago that I counseled RW1 that, in order to better be able to combat & overturn climate science with the ideas learned at the knee of George White, he must first start with a clean slate & learn climate science from the basics up. Then and only then would he be able to apply himself to overturning it. -
Philippe Chantreau at 05:18 AM on 19 December 20112nd law of thermodynamics contradicts greenhouse theory
"no chance for the 2nd law naysayers to squawk" Thing is, real scientists do not give a hoot about 2nd law naysayers. They really don't. 2nd law naysayers are either so hopelessely confused as to be irrelevant, or, in the case of G&T, trying to have fun by exploiting the hopelessely confused. All of it has no bearing whatsoever on the real science. Has G&T led to proclamation of a revolution in atmospheric physics by AGU, NSF, the major publications? No, it met complete indifference. Only a few involved in fighting climate disinformation have taken up the task of disentagnling the sad confusion generated by this useless piece. -
Bob Loblaw at 04:43 AM on 19 December 20112nd law of thermodynamics contradicts greenhouse theory
I've been hesitant to add to the fray, but here goes... Trenberth's diagram (just a recent variant of similar diagrams that have been around for decades) represents global mean net fluxes, and any any interpretation that treats them as absolute fluxes is doomed to failure. All the associated energy fluxes vary in magnitude in space and time, and for a full understanding of global climate you have to look at the fluxes in three dimensions. That's why people make 3-D climate models. As Tom, Sphaerica, and other regulars have pointed out repeatedly: all the simple models (be they descriptive or numerical) while useful for helping explain parts of the system are very limited in looking at the details. Unfortunately, the discussion by people such as TOP and RW1 falls into a couple of unproductive patterns: 1) misunderstandings of the simple models (Trenberth's diagram is one such example of a simple, descriptive model with some numbers attached), in particular what the simplifications are and why they are made. For example, TOP's statement in #1252 about the diagram only showing "radiating energy in one direction", when it is only intended to express the average net result (e.g., amount of IR absorbed at the surface, from the atmosphere, in the case of the 333 W/m^2 back radiation). 2) basic misunderstandings of physics, such as the difference between radiative energy transfer and convective heat transfer, or how energy is transferred as "latent heat". In particular, both of them seem to be missing the concept of absorption of radiation as the driver for atmospheric temperature change, rather than the flux of radiation. Thus, the difference between absorption and emission drives the energy balance (with the added requirement that convective fluxes be considered, too). At any single point, it is the flux divergence that controls heating/cooling rates, not the absolute fluxes themselves. Tom, Sphaerica, other regulars: I strongly disagree with you that TOP and RW1 have a lot to learn. Unfortunately, I think the major problem is that they have a lot of just plain wrong stuff in their heads that they have to unlearn first. Their obstinate view that they have some unrecognized gift to knowledge is a major hurdle. Unless they are willing to sit back and say to themselves "let's start from scratch" and begin to learn physics and climatology from a blank slate, then pointing out their wrongheadedness is futile (except in the goal of making sure that the casual reader sees their foolishness). RW1:, TOP: in comments 1143 and 1145 I challenged Fred Staples to explain some modelling results that relate to how radiation transfer really works. Fred seems to have gone missing completely - do either of you wish to take up the challenge? -
muoncounter at 04:31 AM on 19 December 20112011: World’s 10th warmest year, warmest year with La Niña event, lowest Arctic sea ice volume
Jeff Masters strikes again: Our extreme weather: Arctic changes to blame? dated Dec 16, 2011 Report and analysis of an AGU talk by Dr. Jennifer Francis of Rutgers University: "Does Arctic Amplification Fuel Extreme Weather in Mid-Latitudes?" Arctic sea ice loss may significantly affect the upper-level atmospheric circulation, slowing its winds and increasing its tendency to make contorted high-amplitude loops. High-amplitude loops in the upper level wind pattern (and associated jet stream) increases the probability of persistent weather patterns in the Northern Hemisphere, potentially leading to extreme weather due to longer-duration cold spells, snow events, heat waves, flooding events, and drought conditions. ... Dr. Francis found that the upper-level wave amplitude has increased by over 100 miles (161 km) in summer over the past decade, and this change appears to be connected to the decline in May snow cover. Very well worth the read for all the 'warming doesn't cause extreme weather' loyalists in the room.
Prev 1349 1350 1351 1352 1353 1354 1355 1356 1357 1358 1359 1360 1361 1362 1363 1364 Next


