


 Arguments


Recent Comments
Prev 1361 1362 1363 1364 1365 1366 1367 1368 1369 1370 1371 1372 1373 1374 1375 1376 Next
Comments 68401 to 68450:
-
Bob Lacatena at 04:51 AM on 12 December 2011(Fahrenheit) 451 ppm
15, skept.fr, I don't disagree that in the long run the planet may well be much greener. When a few thousand years have passed and new layers of topsoil are generated in the far north, and plants have shuffled around enough to find the ecosystems in which they do best, then the increase in overall atmopsheric moisture and plant-habitable regions at northern latitudes may well make the planet qualify as "greener." From a human perspective, however, places that are green now are going to brown. I'm scared to death of the expansion of the deserts, the loss of the Amazon, and most importantly serious agricultural difficulties in the US Southwest/Midwest and just as importantly Mediterranean Europe. I'll stick with the "Fire Age" analogy simply because it's too easy for people to fall into a too simplistic "CO2 is plant food, it must be good, yay, the planet will get greener" mentality. -
Bob Loblaw at 04:44 AM on 12 December 2011Greenland has only lost a tiny fraction of its ice mass
John: The same paper I linked to earlier, on page 7 has another diagram that shows some modeled sea level curves since the last deglaciation. Glacial rebound from the last deglaciation is still occurring slowly - from a sudden deglaciation, you can think of the response as roughly exponential. My recollection from study and field work in northern Canada (in a past life) is that after the Laurentide Ice Sheet disappeared, the land west of Hudson Bay was flooded to something in the order of 150m above current sea level. As the land slowly rebounded, local sea level dropped. The abstract of the following paper talks about some of the dates involved: Dyke and Prest (1987) and says that the deglaciation took from roughly 18k to 8k years BP (lots of local variations). So using a period of 10,000 years for rebound (too short, because it's still recovering) and 100m of rebound (just to get a ballpark figure), we get average rates of rebound of 1m in 100 years. This definitely seems fast, and would be clearly noticeable. Rebound does take longer than ice melt, though. ...but in the context of Greenland and current sea level, the depressed area around Greenland is quite small compared to total ocean area, and we're talking about much less ice than the last glacial maximum. A Google search gets me areas of 22 million km2 for Greenland, and 361 million km2 for the worlds oceans, so Greenland is about 6% of the total ocean area. So this reduces the global effect on sea level associated with Greenland rising. Then you have to account for the fact that most of Greenland is not currently covered by ocean, so the uplift doesn't affect other areas because water isn't being displaced. Then add in the area around Greenland that sinks, and effects get smaller again... My largely unsubstantiated gut feeling is that the effect is small. My hopefully-somewhat-educated guesses as to the answers to your specific questions are: 1) short term (next 100 years) sea level rise cause by water displaced by sea bed rising is likely negligible. 2) people that study sea level and glacial mass balances have probably figured this out in much greater detail than I can, and if it is significant they have probably accounted for it. This whole question of crustal movement and apparent local sea level changes is one that has been extensively considered in the tidal gauge interpretations. In addition to glacial isostatic rebound, local tide gauges are affected by regional uplift or subsidence associated with plate tectonics and other geological factors. This sort of things was taught at the undergraduate level in the 1970s (at least, to me... and I don't think I got any special treatment), so it can't possibly come as a surprise to people working in the area... -
DrTsk at 04:26 AM on 12 December 2011Galactic cosmic rays: Backing the wrong horse
Eric (Sceptic). {- snip -}Galactic Cosmic Rays?? Maybe alien death rays. Really any more conjectures for the warming? This is as good as the neutron star in the center of the Sun theory!!! Maybe the back hole at the center of the Galaxy is causing all these. Then again all the hot air coming from {- snip -}. I am sick of the crazy (-snip-) theories.Moderator Response: [mc] Easy there, Tsk; watch the ad homs. Keep it civil. -
Zen69 at 04:06 AM on 12 December 2011Antarctica is gaining ice
Very useful feedback. Thanks -
Zen69 at 04:01 AM on 12 December 2011Part Two: How do we measure Antarctic ice changes?
Very useful feedback, thanks -
skept.fr at 03:55 AM on 12 December 2011(Fahrenheit) 451 ppm
Sphaerica : your metaphor of 'Fire Age' with mention of Amazonian drought and deserts' extension suggests that a warmer world will not favour vegetation on a global scale. But if vegetation models coupled to AOGCMs do simulate a regression of tropical rainforests, they also obtain an overall increase in net vegetal biomass with increasing CO2 and T, at least in some recent works like for example Notaro et el 2007 , O'ishi et Abe-Ouchi 2010 , Jiang et al 2011 . Or they detail many regional differences in vegetation response as in Levis et 2010 . For Amazonian drought, I mention this special issue of the New Phytologist. Its "whole or part turn into savanna" is at least an uncertain pathway, see Ramming et al on the risk of Amazonian forest dieback. -
muoncounter at 03:30 AM on 12 December 2011Antarctica is gaining ice
peacetracker#110: "based upon sea ice extent and subjective guesses" Can anyone seriously contemplate circumstances in which areal extent is decreasing, but volume is increasing? That's patently ridiculous. See the Arctic ice threads. -
John Hartz at 03:24 AM on 12 December 20112011: World’s 10th warmest year, warmest year with La Niña event, lowest Arctic sea ice volume
Changes to the Arctic are chronicled annually in the Arctic Report Card issued by the US National Oceanic and Atmospheric Administration (NOAA) The 2011 report, prepared by an international team of scientists from 14 different countries, was reseased by NOAA on Dec 1. Among the 2011 report highlights are: • Atmosphere: In 2011, the average annual near-surface air temperatures over much of the Arctic Ocean were approximately 2.5° F (1.5° C) greater than the 1981-2010 baseline period. • Sea ice: Minimum Arctic sea ice area in September 2011 was the second lowest recorded by satellite since 1979. • Ocean: Arctic Ocean temperature and salinity may be stabilizing after a period of warming and freshening. Acidification of sea water (“ocean acidification”) as a result of carbon dioxide absorption has also been documented in the Beaufort and Chukchi seas. • Land: Arctic tundra vegetation continues to increase and is associated with higher air temperatures over most of the Arctic land mass To access this informative document, click here. -
muoncounter at 03:21 AM on 12 December 2011Galactic cosmic rays: Backing the wrong horse
Eric#38: "even though there are likely some weather effects." That still is mere conjecture. #40: "But there is still the medium range evidence of a GCR control knob (Mercurio link above)" Mercurio is a summary article written for the 'Encyclopedia of Human Ecology,' whatever that is. His 'evidence' consists largely of rehashed Svensmark with some Willie Soon graphs thrown in. A hodge-podge of other concepts shows up as well: In my hypothesis for the control of climatic cycles by geomagnetically modulated GCR levels, greater inclination of the earth with relation to external gravitational attraction results in stronger geomagnetism and therefore lower GCR levels which, in turn, result in less condensation and low cloud cover and generally warmer conditions. External gravitational attraction results in stronger geomagnetism? Did I miss when that relationship was established? But at least he's up-front about his 'hypothesis': I do not know whether the values of geomagnetic intensity on my curves indicating glacial-interglacial chronology are what would be necessary to modulate GCRs to develop the climates predicted for them. In other words, it's pure correlation without a mechanism. But let's call it evidence anyway. Much of the remainder is good old climastrology: The next ~80 year cycle maximum is likely to be around the year 2013 and this is one of the reasons it has been getting warmer over the last several decades since the last minimum around 1975 And here's a prediction (circa 2002): Dust Bowl type droughts on the North American western Great Plains and Southwest as occurred on and off for several years following the last solar minimum around 1997 should not occur in the years following the next solar minimum around 2007. Dust Bowl type droughts could be expected around and after the minimum of the following antiparallel solar cycle around 2020 or a little over 22 years from 1997. So 2011 droughts should not have happened until 2020. That merits an "Oops." -
John Russell at 03:20 AM on 12 December 2011Greenland has only lost a tiny fraction of its ice mass
Thanks for the info, Bob. So it seems that as the Greenland bedrock rises due to loss of ice sitting on it (currently 6mm/year), the surrounding sea bed also rises; but in a more complex way than I first envisaged. So to come back to the questions I first raised; 1) ...is there enough additional seawater being displaced by a net rising of the sea bed to influence observed sea level rise? 2) ... is this effect being factored in to long term sea level projections? I guess there's also the issue that both altimeter and gravity readings of the Greenland ice cap will need to take into account the rising land, which will tend to make it appear like there's less ice being lost than is actually the case. My word, this is complicated! I guess the people working on this area will need to keep their wits about them. I sure take my hat off to them. -
skept.fr at 03:17 AM on 12 December 2011(Fahrenheit) 451 ppm
Bill : An abrupt increase in the atmospheric CH4 concentration from the region of 350 to 400 ppb to the region of 700 to 800 ppb seems to slightly precede the steep temperature rise on the exit from a deep ice age (glacial period). I used to read that, contrary to this assertion from Byalko 2010, there was a lag too between temperature rise and CH4 rise, for example Delmotte et al 2004 or discussion in Konijnendij et al 2011 . Does Byalko refer to other paleoclimatic works for justifying that CH4 rise precede the temperature change or is synchronous with it ? I do not read Russian but there are probably some publications on this subject referred in his article. -
John Hartz at 02:38 AM on 12 December 2011Antarctica is gaining ice
@peacetracker #110: A recent example of direct measurement of central Arctic sea ice volume is described in detail in “Changes in Arctic Sea Ice: Young and thin instead of old and bulky.” To access this informative article, click here. -
DSL at 02:31 AM on 12 December 2011Antarctica is gaining ice
Peacetracker, if you want to find out the validity of someone's argument, ask them for evidence of their claims. Ask this WUWT joker for evidence of guesswork at PIOMAS. Essentially, the commenter is saying that PIOMAS scientists are faking each month's data point to make sure that volume is dropping like a rock. If you don't understand how sea ice volume is measured, then ask yourself what is the more likely claim: A) the dozens of scientists at several scientific organizations are knowingly committing fraud to make it look like sea ice volume is dropping. They come to work every day knowing that they're doing the exact opposite of what they're trained to do, the exact opposite of what they went through 6-10 years of college to do. B) sea ice volume is dropping, consistent with a warming ocean and atmosphere. Volume drop is also corroborated by evidence from people who live and work around the Arctic circle. -
Daniel Bailey at 02:22 AM on 12 December 2011Antarctica is gaining ice
@ peacetracker"Currently, there are no objectively quantitative ice volume measurements with anthing remotely close to the necessary temporal and spatial coverages. Consequently, Morano and anyone else can only make objective observations about sea ice extent."
That is simply untrue. It is widely known that multiple physical measurements of ice thickness are taken at regular intervals. These range from ice thickness measuring buoys to US Navy submarines to aerial ice thickness measuring instrumentation packages to ships measuring the thicknesses on their recon cruises to orbiting satellites (IceSat & CryoSat2). Anyone who would maintain otherwise is simply talking about things about which they know nothing...or simply lying with the intent to mislead. http://neven1.typepad.com/blog/2011/08/polarstern-reaches-north-pole.html http://neven1.typepad.com/blog/2011/09/more-on-ice-thickness-from-awi.html http://imb.crrel.usace.army.mil/ http://amap.no/swipa/ http://www.osi-saf.org/index.php PIOMAS is a useful tool to incorporate all of these metrics into a validated model using known ocean/atmospheric/ice dynamics to compare past observations to current ones: and
and
 Moderator Response: [JH] Perhaps this comment should be transformed into a rebuttal article?
 -
Eric (skeptic) at 02:20 AM on 12 December 2011Galactic cosmic rays: Backing the wrong horse
Thanks Sphaerica, those links address Shaviv fairly effectively. After those posts there was this paper directly addressing the spiral arm transit: http://www-zeuthen.desy.de/~pohlmadq/publications/apjl_705_2_101.pdf and effectively rebutting Shaviv. But there is still the medium range evidence of a GCR control knob (Mercurio link above). But the GCR knob is ganged with the solar TSI knob, as solar activity increases, TSI increases and GCR decreases. Both the TSI increases and the coincidental GCR decreases will warm the climate. The GCR will also depend on galactic flux variations which is independent of the solar effects. Suffice to say, solar-modulated GCR is a control knob, solar itself is another, and GHGs are another. -
DrTsk at 01:47 AM on 12 December 2011Antarctica is gaining ice
Look at the gravity probes measurements over Antarctica. They clearly and unequivocally show a loss of mass at an accelerated rate. No models no fitting, just good old empirical unadulterated data. And if somebody thinks that the rocks have been vaporizing, then think again. Mass loss -> Ice mass loss -> Ice volume loss. No need for models to tell us that. -
Daniel Bailey at 01:33 AM on 12 December 2011(Fahrenheit) 451 ppm
@ Lloyd Flack @ 8"Is there any evidence of large methane releases at the end of glacials? And if so what is their source?"
I would refer you to Davy et al 2010:"Comparison of the history of oxygen isotope variation (Figure 2) with the amplitude variations observed on the “Parasound” sub‐bottom profiler data enables matching of climate cycles over at least the last 0.6 My. We interpret the high‐amplitude reflection horizons to correspond to peak glacial stages and subsequent glacial‐interglacial transitions prior to the resumption of higher carbonate sedimentation in interglacial periods."
-
Zen69 at 01:28 AM on 12 December 2011Antarctica is gaining ice
I have come across this comment on a thread at WUWT. "Although the Alarmist arguments sometimes include claims about ice volume, such claims are based upon sea ice extent and subjective guesses about what they beleive a model parameterization adjustment should be to produce a desired result. Currently, there are no objectively quantitative ice volume measurements with anthing remotely close to the necessary temporal and spatial coverages. Consequently, Morano and anyone else can only make objective observations about sea ice extent." Is there any validity to this guys argument? Thanks -
angliss at 01:25 AM on 12 December 2011(Fahrenheit) 451 ppm
Bill, the fact that the cross correlations are so broad means that, as a function of lead and lag in a control system, the effects of CO2 cannot be treated as a simple lag. Whether that qualifies as "inaccurate" or not may fairly be considered a matter of opinion, but it certainly supports Sphaerica's contention that it's "simplistic" and "indiscriminate." Running a simple cross-correlation with existing modern CO2 and temperature records and then sweeping it across +/- 20 years or so (using the annual record) produces a similar result - CO2 is leading temperature, but the cross-correlation is high (greater than what could be expected from random noise) across the entire period. -
Jsquared at 01:03 AM on 12 December 2011(Fahrenheit) 451 ppm
BillEverett@10: the Antarctic methane correlates nicely with D-O events. It's been hypothesized that D-O events might have modified the thermohaline circulation, which would have led to Antarctic warming. There's some indication that Caribbean waters warmed too. So it could well be benthic methane. It sounds like Byalko is suggesting that oxidation of methane is what causes the CO2 to increase later - explaining the time lag between temp and CO2 (in other words, I read what he says as saying that the methane causes the temp rise, and produces CO2 when it oxidizes, raising the temp still more). That's an interesting idea that I've not seen before. Am I interpreting him correctly? -
BillEverett at 23:45 PM on 11 December 2011(Fahrenheit) 451 ppm
"CO2 does not 'lag' temperature. That's a simplistic, inaccurate and indiscriminate view of a complex interaction." Analysis of time series data for the last 800,000 years from Antarctic ice cores indicates that the temperature at time t, T(t), is most highly correlated with the atmospheric carbon dioxide concentration at time t+2000 years, [CO2](t+2000). We than therefore say that CO2 does in fact lag temperature for those time series. Certainly, any statistic is "simplistic" in the sense that it is some kind of reduction of data. But you can call it inaccurate only if you can show an error in calculating the statistic. For many purposes, we need "simplistic" information such as "average global temperature" or "mean sea level." How discriminating a person should be depends on the purpose. Statistical relations between variables can only suggest what might be and what probably cannot be. In other words, an adequate model of a complex dynamical system with many variables, with nonlinear interactions, and with variable time lags in feedbacks should produce outcomes with statistics similar to the statistics of the system being modeled. If increased CO2 did not initiate historical temperature rises to an interglacial period, then what GHG, if any, was involved? An abrupt increase in the atmospheric CH4 concentration from the region of 350 to 400 ppb to the region of 700 to 800 ppb seems to slightly precede the steep temperature rise on the exit from a deep ice age (glacial period). Here is Fig.3 in a paper by Alexey V. Byalko on the paleoclimate published in the journal Priroda [in Russian] (No.12, 2009, pp.18-28). The entire issue is downloadable as a pdf file (5 Mb). Cross-correlations (covariances): The blue curve is temperature and CO2, the red curve is temperature and CH4, and the green curve is CO2 and CH4.
Here is an English translation of Byalko's discussion of that figure in the paper referenced above: "The cross-correlations (covariances) of these variables give even more information. They are presented with a higher time resolution because the shift of the maxima of these functions forward or backward from zero indicates which variable is leading, which is lagging, and with what characteristic time. As Fig. 3 shows, temperature and [CO2] are closely coupled at small times with a maximum covariance equal to 0.88 reached with the temperature leading by about 2 ky relative to [CO2](t). The accuracy of calculating lags and leads, regrettably, is not yet good, being around 0.5 ky. The temperature and methane concentration turned out to be almost synchronous, but their maximum covariance is lower, equal to 0.82. Finally, CO2 concentration lags behind [CН4] with a 1.5 ky average lag; their maximum covariance is equal to 0.74. The logic of this time lag can be explained by the process of oxidizing methane into carbon dioxide."
Methane release from Arctic permafrost was probably not involved in past major warming episodes, at least not until the Arctic ice sheet had receded. It seems likely to me the significant increase in atmospheric CH4 preceding those warming episodes involved releases from the benthic methane hydrate stores. So now I have the question (which can only be answered speculatively at the present): What if the CO2-induced warming leads to release of CH4 from both benthic and permafrost stores? Would this lead to a major warming episode, of which several have occurred in the past 800,000 years, but starting this time from a warm interglacial plateau and not from the depths of a deep ice age?
One research project has been involved in trying to find related answers. I quote a couple passges, one long and one short, from their webpage. The long passage: "This effort will develop, for the first time, a tool for the systematic quantification of the potential impact of dissociating marine hydrates on the global climate. The results of this study will be important in testing the validity of the Clathrate Gun hypothesis, and the corollary hypothesis that rapid hydrate dissociation can have a cascading effect resulting in enhanced hydrate dissociation and accelerating global warming, with potentially catastrophic physical and economic consequences."
The short passage: "Current Status (November 2011): All project research has been placed on hold due to ongoing funding issues."
Cross-correlations (covariances): The blue curve is temperature and CO2, the red curve is temperature and CH4, and the green curve is CO2 and CH4.
Here is an English translation of Byalko's discussion of that figure in the paper referenced above: "The cross-correlations (covariances) of these variables give even more information. They are presented with a higher time resolution because the shift of the maxima of these functions forward or backward from zero indicates which variable is leading, which is lagging, and with what characteristic time. As Fig. 3 shows, temperature and [CO2] are closely coupled at small times with a maximum covariance equal to 0.88 reached with the temperature leading by about 2 ky relative to [CO2](t). The accuracy of calculating lags and leads, regrettably, is not yet good, being around 0.5 ky. The temperature and methane concentration turned out to be almost synchronous, but their maximum covariance is lower, equal to 0.82. Finally, CO2 concentration lags behind [CН4] with a 1.5 ky average lag; their maximum covariance is equal to 0.74. The logic of this time lag can be explained by the process of oxidizing methane into carbon dioxide."
Methane release from Arctic permafrost was probably not involved in past major warming episodes, at least not until the Arctic ice sheet had receded. It seems likely to me the significant increase in atmospheric CH4 preceding those warming episodes involved releases from the benthic methane hydrate stores. So now I have the question (which can only be answered speculatively at the present): What if the CO2-induced warming leads to release of CH4 from both benthic and permafrost stores? Would this lead to a major warming episode, of which several have occurred in the past 800,000 years, but starting this time from a warm interglacial plateau and not from the depths of a deep ice age?
One research project has been involved in trying to find related answers. I quote a couple passges, one long and one short, from their webpage. The long passage: "This effort will develop, for the first time, a tool for the systematic quantification of the potential impact of dissociating marine hydrates on the global climate. The results of this study will be important in testing the validity of the Clathrate Gun hypothesis, and the corollary hypothesis that rapid hydrate dissociation can have a cascading effect resulting in enhanced hydrate dissociation and accelerating global warming, with potentially catastrophic physical and economic consequences."
The short passage: "Current Status (November 2011): All project research has been placed on hold due to ongoing funding issues."
-
Jsquared at 23:21 PM on 11 December 2011(Fahrenheit) 451 ppm
Lloyd Flack @8: Yes - methane record in EPICA Dome C ice cores. See http://www.ncdc.noaa.gov/paleo/pubs/spahni2005/ for measurements. It's thought that the methane is released from northern hemisphere tundra during Dansgaard-Oescher warming events at the end of glacials, then propagates to the Antarctic. Methane levels in the ice cores vary from 400-700ppb. Today they are at 1850 ppb. -
Lloyd Flack at 21:52 PM on 11 December 2011(Fahrenheit) 451 ppm
Is there any evidence of large methane releases at the end of glacials? And if so what is their source? -
newcrusader at 21:13 PM on 11 December 2011(Fahrenheit) 451 ppm
451 in 2042? with C02 rising at 2.1ppm a year for the next 22 years, I come up with 443ppm- in 2035 now that's with 2.1ppm- what if that increases to an average of 2.5ppm a year-? That brings us to 450 ppm in 2035. -
Steve L at 18:05 PM on 11 December 2011(Fahrenheit) 451 ppm
Very interesting, Sphaerica. I think you've over-anthropomorphized nature ("carefully and predictably"; "trying to tell us something"). This is all in the interpretation, I might argue. But you make good points in support of your other interpretations, so I shant complain too much. I'm left wondering, though, is it better that we're emitting all this CO2 when solar irradiance of high latitudes is declining, or does that make things worse? -
DrTsk at 16:30 PM on 11 December 2011(Fahrenheit) 451 ppm
Chris, Do not forget diseases. In the grand experiment of ours, we are going to be shifting the ranges of various tropical and rather scary diseases. Also we will expand the range of many others and allow for the intermixing / genetic enhacement of many virus strains in a way similar to what has happened to the recent swine flu. Nature has a way of self-correcting. Does not mean we will be in the plan. Hate to be pesimistic too, but I cannot see how we will be able to change our course with the kind of collective burying of heads in the sand. -
Bob Lacatena at 16:15 PM on 11 December 2011Galactic cosmic rays: Backing the wrong horse
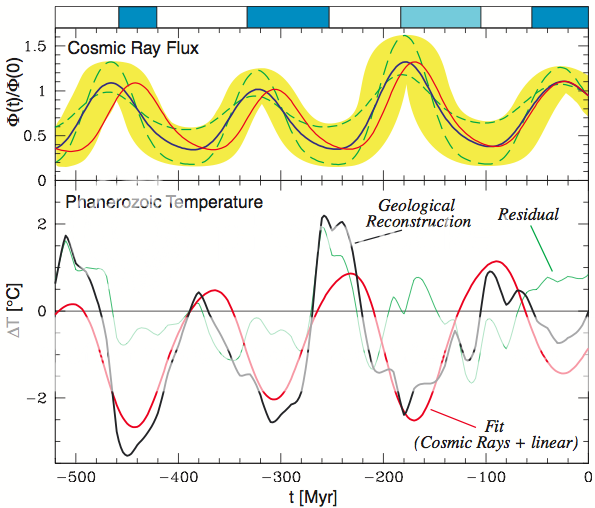
38, Eric, You need to look up the criticisms of Shaviv 2003. In particular, the graph you just posted looks sort of good... until you realize that each little hash mark represents a span of 20 million years. Given how very fuzzy the correlation is (it lags by tens of millions of years at 400 million years and 300 million years) and the questionable nature of how values were arrived at in the graph... I don't put any weight in it whatsoever. Even the paper's own conclusion says:“...our conclusion about the dominance of the CRF over climate variability is valid only on multimillion-year time scales”
You need to be a lot more skeptical about papers like that, and it doesn't take a lot of research to find out that the paper, while published, did not stand up to scrutiny. Real Climate on Shaviv Peer Review: A Necessary But Not Sufficient Condition From that last link:...an international team of scientists and geologists (including some of us here at RealClimate), who suggested that Shaviv and Veizer’s analyses were based on unreliable and poorly replicated estimates, selective adjustments of the data (shifting the data, in one case by 40 million years) and drew untenable conclusions, particularly with regard to the influence of anthropogenic greenhouse gas concentrations on recent warming...
-
Eric (skeptic) at 15:43 PM on 11 December 2011Galactic cosmic rays: Backing the wrong horse
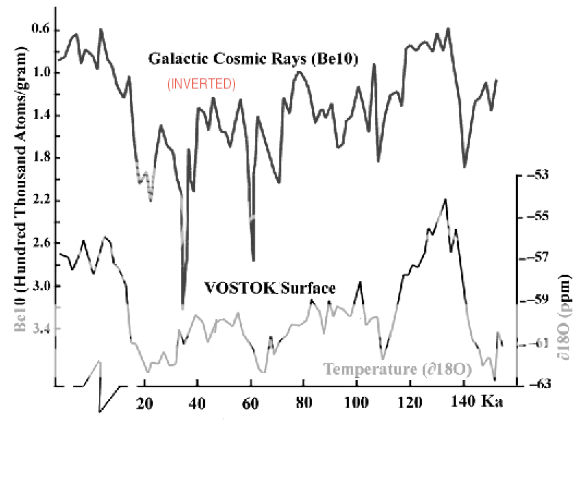
In the short run cosmic rays are clearly not a primary driver of climate (i.e. global average temperature) even though there are likely some weather effects. Here are two longer term views however, that show GCR to be a primary long term "control knob". (Note GCR is not "the" control knob and it doesn't preclude other control knobs). First from https://www.hartnell.edu/faculty/mercurio/gcr2.pdf
Here is the GCR over 100's of millions of years from Shaviv http://www.blc.arizona.edu/courses/schaffer/182h/Climate/CelestialDriver.pdf:
-
Chris G at 14:29 PM on 11 December 2011(Fahrenheit) 451 ppm
Thanks Sphaerica. It dismays me that BAU continues unabated when it is so clear that we are off the map, in the sense that we have no record of having been here before. What we are heading into could be as different from what has happened in the past as the difference between receiving a push, and getting hit with a club. The same amount of force is applied, but over a much shorter time frame. I've been looking around for a chart/graph of world food production. I'm trying to see what impact recent droughts, floods, and heat waves have had on our ability to feed the world's population. In particular, I'd like to see if the 3-sigma heat waves that Hansen so clearly described show up as some sort of signature when overlaid. If they do, then you could almost project forward a range for population and a range for food production, accounting for the expected increase in extreme heat waves (and droughts, and floods, if the data are available). When the population intersects production, the cull starts in earnest. I don't agree with everything that Lovelock says by a long shot, but I am beginning to think he might have gotten the major point correct. (I thought it was almost comical that professors asked him where they should buy land; as though refugees would leave you and your belongings alone because you had a printed title.) It will not happen all at once and everywhere. Rich nations or those with a strong military will gather resources to themselves, and be able to preserve their populations for longer than poor nations. But I don't see that lasting indefinitely. Although, it may be that food shortages tend to produce internal wars more than external ones. Forgive me; I hate to be a pessimist, but I'm starting to wonder if the survivors would be better off if the cull starts sooner rather than later, in the sense that, whatever environment is left will be more habitable. The damage that, say, 8 billion people can do is surely less than the damage that 9 or 10 can. Also, in non-human populations, there seems to be less over-correction when a sustainability threshold is crossed by less than it is when is crossed by more. -
Tom Curtis at 14:29 PM on 11 December 2011(Fahrenheit) 451 ppm
Eric (skeptic) @2, CO2 was the primary control knob at least twice coming out of snowball earth conditions, and again at the PETM, and probably the largest mass extinction the Earth has yet seen, the Permian-Triassic Extinction, in which 96% of marine species went extinct. As can be seen from the following figure, it has also been the control knob for warm periods in the Cambrian (C), Silurian(S), Devonian (D), Triassic (Tr), Jurassic (J), and Cretaceous (K). It's low abundance has been the dominant control knob in glacial periods in the Carboniferous (C) and Neogene (Ng). It is true that within the neogene, and in particular over the last 5 million years CO2 concentrations have been driven temperatures, and have been only the second major driver of temperatures (after the albedo changes due to extensive ice sheets and sea ice). It is, of course, that last period which Sphaerica discusses.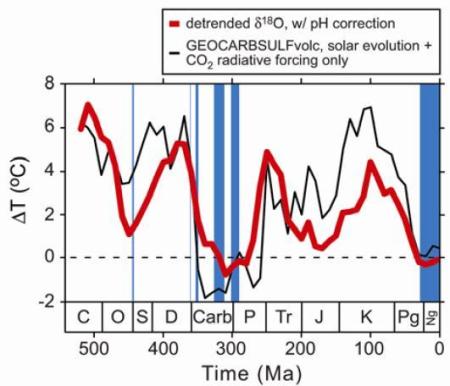 Richard Alley has a very informative lecture on the subject, and while he is certain that the level of CO2 in the atmosphere has been primarily driven by different rates of volcanism (emitting CO2) and weathering (absorbing it), over the last 5 million years those two factors have been approximately balanced. The Earth has not fiddled with its control knob in the entire time of human existence, until we decided to give it a yank and see what happens.
-
Eric (skeptic) at 14:00 PM on 11 December 2011(Fahrenheit) 451 ppm
"It took an increase of 105 ppm, or a factor of 1.6, to get us from an "ice age" into the world in which we currently not only live, but thrive" It took a solar forcing change of roughly 1% (more at higher latitude, less at lower) plus a decrease in albedo from melted ice (and other non GHG feedbacks) and the GHG feedbacks that we have now turned into forcings. Unlike solar and GCR, CO2 was never* a control knob before but it always was an amplifier of other forcings during the glacial periods. *It was a control knob rule once or twice. -
DrTsk at 12:34 PM on 11 December 2011(Fahrenheit) 451 ppm
Scary! -
JoeTheScientist at 12:17 PM on 11 December 2011It's Not About The Hockey Stick!
Climate Change Skepticism - It's not about the science. It's political. Like the tobacco companies who came before them, "[their] product is doubt"! If you're trying to create doubt, you make it sound simple. You only have to beat on one thing. You imply "this thing is wrong so it's ALL wrong". It is propaganda, the essence of which is: --- addressed exclusively to the "masses", not to scientists; --- call their attention to your "facts"; --- persuade the audience your fact is "real"; --- don't give them a chance to think about any other facts, keep them focused on yours; --- engage their emotions, NOT their intellect. There are tens of millions of people out there ripe for such an approach. -
adelady at 09:35 AM on 11 December 2011It's Not About The Hockey Stick!
One thing SirNubwub's high school students might be able to relate to - because it's not high powered science - is the Japanese cherry blossom festivals. http://arnoldia.arboretum.harvard.edu/pdf/articles/1893.pdf This item needs a bit of 'teachering' to condense for initial introduction to students. But it shows them, and us, that scientific analysis and conclusions are based on meticulous record-keeping. In this case, records maintained for an entirely unrelated purpose can provide evidence of something we were expecting from theory - namely physics. And this fantastic historical record is perfect for scientists to work on. The 'teachering' I'd do would be to separate the historical aspect out, then show how scientists can extract the statistics lying there, waiting for compilation. -
Alexandre at 05:02 AM on 11 December 20112011 AGU Conference Day One
I'd like to suggest an SkS article about the COP17 negotiations as well. I hope there will be some positive news on that front, which is turning out to be a surprise for my low expectations. -
BillEverett at 04:25 AM on 11 December 2011Plimer vs Plimer: a one man contradiction
In Fig. 3 in the paper referenced in #13 above, the time-lagged cross-correlations of CH4-T, CO2-T, and CH4-CO2 are plotted as a function of the time lag. The highest value of the CH4-T correlation is about 0.88 with CH4 slightly leading the temperature (T) in time. The highest CO2-T correlation value is about 0.82 with CO2 concentration following T with a time lag of about 2000 years (plus or minus 500 years). -
Bob Loblaw at 03:58 AM on 11 December 2011Greenland has only lost a tiny fraction of its ice mass
Tom, John: Although the crust is flexible, isostatic effects are not completely localized. One of the earlier forms of evidence for isostatic effects relates to the past glacial periods: geological beach deposits as land rebounded after the ice disappeared. Dating of fossils (e.g. radiocarbon dating) gives the time the beaches were active at (or just below) sea level, and provides rates of rebound. Standard glacial geology stuff. More importantly to the current discussion, such beach deposits and other similar forms of evidence also show that the crust was depressed for quite some distance beyond the maximum ice coverage (I have vague memories of hundreds to thousands of kilometres). In addition, there is a zone beyond the depressed area where the flexion of the crust causes an area of uplifted ground. I did a quick search in Google Scholar, and the following paper has a nice diagram showing the effects: Lambeck (1990) Glacial Rebound Sea-Level Change and Mantle Viscosity The link points to page 3, where the diagram is. Nothing particularly special about the paper that I wanted to point out, other than it was the first one I found with the kind of diagram I was thinking of. I haven't read the rest of it. It seems to cover stuff generally about glacial rebound.Response:[DB] Per the linked reference:

(Click to enlarge)
-
dana1981 at 03:46 AM on 11 December 2011Huber and Knutti Quantify Man-Made Global Warming
dagold - as Tom Curtis said, the global surface temperature record extends back to about 1880. HadCRUT goes back to 1850, but it's biased lower than the other two main data sets, and its measurements from 1850 to 1880 are based on fewer measurements. These three groups include sea surface temperatures, while BEST only has land temperature measurements, which is why it's higher. The GHG emissions ramp-up also really began starting right around 1880 or so, conveniently. The global surface temperature increase since then is right around 0.8C. -
Johnny Vector at 03:06 AM on 11 December 2011Plimer vs Plimer: a one man contradiction
Ross at #16, the quote about a 4 degree rise due to CO2 is referenced as on p. 121 of A Short History of Planet Earth. The reference is unclear in this post, but the Plimer vs. Plimer page shows it clearly. Amazon won't show me all of p. 278, but you are even wrong that "Temperature and CO2 are not connected" is said to follow from the 180 ppmv numbers. After the CO2 numbers, there is a full stop, and a new sentence, the entirety of which is "Temperature and CO2 are not connected." No attempt is made to show that these two points in time prove the general statement; it is just given as given. (But see the graph in #13 above to see just how correlated T and CO2 actually are, and how wrong Plimer is.) Of course the point is not what evidence he uses, but that in the same book he says that temperature and CO2 both are and are not connected. -
tmac57 at 03:05 AM on 11 December 2011Newcomers, Start Here
I am curious if anyone has had the time to evaluate Natalie Mahowald's Science magazine paper 'Aerosol Indirect Effect on Biogeochemical Cycles and Climate'? She proposes an additional aerosol cooling effect that current climate models are generally not taking into account.Her conclusion is that it may be more costly to abate CO2 levels than previously thought. http://decadal.gsfc.nasa.gov/pace-2011sdt/Science-2011-Mahowald-794-6.pdf -
Ger at 02:41 AM on 11 December 2011Plimer vs Plimer: a one man contradiction
In agreement with #16, that it depends on the speed if we humans can adapt. I doubt that current biosphere can adapt at the same speed, so the humans left will run short on almost everything for the next couple of millions year. -
skept.fr at 02:31 AM on 11 December 2011Huber and Knutti Quantify Man-Made Global Warming
#8 Tom : thank you for this nice introduction. I’m pretty sure that we cannot explain the observed temperature trends without forcings, and mainly anthropogenic forcings, because it would be physically impossible (‘foolish’ as you say) to do so by ignoring their radiative and convective properties. But as we come to more precise estimates (the sense of the Huber et Knutti 2011 paper, but also Santer et al 2011 previously discussed on SkS ), the methodology underlying theses estimates becomes of interest in its details. The relaxation time of atmosphere being very short, the question of unforced / intrinsic variability concerns more probably the oceanic circulation, particularly ist long term change known as thermohaline circulation (THC) and connected to (more or less) low frequency oscillations in large basins (eg AMO, PDO, etc.). So, in order to calculate the temperature distribution histogram you reproduce from HK2011, I suppose the GCM models (or EBM) are obliged to begin by a kind of long term (centennial to millenial) simulation of oceanic heat distribution, so as to constrain the desequilibrium state at the beginning of the modern period of the simulation (that is, in the year 1956 in your figure). The AR3 (2001) had some mentions of this kind of reflexion among modellers, for example 14.2.2.1 (sorry, I can't link to the precise page of AR3 because the undefined url of the report don't allow this) : Another important (and related) challenge is the initialisation of the models so that the entire system is in balance, i.e., in statistical equilibrium with respect to the fluxes of heat, water, and momentum between the various components of the system. The problem of determining appropriate initial conditions in which fluxes are dynamically and thermodynamically balanced throughout a coupled stiff system, such as the ocean-atmosphere system, is particularly difficult because of the wide range of adjustment times ranging from days to thousands of years. This can lead to a "climate drift", making interpretation of transient climate calculations difficult Or in the same report, 8.4.1 : This "climate drift" can make interpretation of transient climate change simulations difficult, so models are generally allowed to adjust to a state where such drifts have become acceptably slow, before starting climate change simulations. A number of techniques have been used to achieve this (see Stouffer and Dixon, 1998), but it is not possible, in general, to say which of these procedures gives "better" initial conditions for a climate change projection run. In the IPCC AR4 (2007), we can see in 9.4.1.2 and fig 9.5 an exercise very comparable to HK2011, with a forced and unforced simulation of the 20th century. As you can read, the legend of the figure stipulates : The simulated global mean temperature anomalies in (b) are from 19 simulations produced by five models with natural forcings only. The multi-model ensemble mean is shown as a thick blue curve and individual simulations are shown as thin blue curves. Simulations are selected that do not exhibit excessive drift in their control simulations (no more than 0.2°C per century). Each simulation was sampled so that coverage corresponds to that of the observations. So, we find again this concept of 'drift' in control (no forcing) simulations, with a selection of thoses simulations that do not exhibit more than 0,2 K drift. But why this limit value of 0,2K ? Does it come from a physical non-sense (beyond this value) or an empirical adjustment and, if the second solution is correct, adjustment to which set of observations constraining the signature of an unforced variability ? If there is such a secular drift, why temperature change from unforced variability on six decades would be centered on zero (your figure) rather than a positive or negative value ? The appendix of AR4 chapter 9 gives some information about methods (optimal fingerprinting and methods of inference), but beside the technical complexity (or because of it and my consequent poor level of understanding), it seems circular in my mind : Fitting the regression model requires an estimate of the covariance matrix C (i.e., the internal variability), which is usually obtained from unforced variation simulated by AOGCMs (e.g., from long control simulations) because the instrumental record is too short to provide a reliable estimate and may be affected by external forcing. Atmosphere-Ocean General Circulation Models may not simulate natural internal climate variability accurately, particularly at small spatial scales, and thus a residual consistency test (Allen and Tett, 1999) is typically used to assess the model-simulated variability at the scales that are retained in the analysis. To avoid bias (Hegerl et al., 1996, 1997), uncertainty in the estimate of the vector of scaling factors a is usually assessed with a second, statistically independent estimate of the covariance matrix C which is ordinarily obtained from an additional, independent sample of simulated unforced variation. I basically read this as : AOGCMs constrains the realism of unforced variability from… AOGCMs simulations of unforced variability ! That is : there is no reference to empirical (observation-based or proxy-based) assessment of the long term change in oceanic circulation, the best candidate for unforced variability. Of course, when you deal with a huge temperature change (eg 2, 3, 4 K), these questions are probably of minor importance. And if unforced variability could help us to restrain the climate sensitivity range, it is very unlikely it will change this range (it could even drive to higher values). But when you try to adress precisely the different contributions to an observed trend of a 0,79 K in one century or 0,55 K in six decades (HK2011), maybe theses questions of ‘drift’ and ‘control runs’ are to be adressed more precisely in the explanations of the results. -
Steve L at 02:08 AM on 11 December 2011It's Not About The Hockey Stick!
SirNubwub and his students may benefit from a review of fingerprints. There are many, many independent lines of evidence for AGW. The hockeystick, which has been replicated many times, relies on modeling and proxy analysis which might not be very engaging for your class. Instead, show this video. Then compare the AGW hypothesis for observed climate changes to an alternative (e.g., it's the sun) with reference to facts like the stratosphere is cooling, nights warm faster than days, there's less infrared escaping to space, etc. Ask them: Which provides a better explanation? -
Yvan Dutil at 00:20 AM on 11 December 2011Huber and Knutti Quantify Man-Made Global Warming
The scary thing in these graphs sis that aerosol and ozone are strongly negative. If we clean the air as we would like to do, temperature increase will be 1/3 larger. I think others authors got a similar result. -
Tom Curtis at 21:12 PM on 10 December 2011Greenland has only lost a tiny fraction of its ice mass
John Russell @13, not how my mind works, but yes (I think). -
John Russell at 21:06 PM on 10 December 2011Greenland has only lost a tiny fraction of its ice mass
Thanks for the answer, Tom. I was imagining the Earth's crust as more elastic and linked, like the skin on a sloppy custard with a small weight sitting on the top in one spot, so, if that weight was reduced, not only the skin beneath the weight rises but so does the skin around it. What you describe seems to be more like contiguous sugar lumps floating on a pond of treacle, (the lumps representing the Earth's crust and the treacle below, the magma) so that a localised weight only pushes down the lumps it sits on. Then when the weight is reduced only the lumps immediately below the weight rise. I think what you're saying is that the lumps with the weight lifted off them pull down their neighbouring lumps, because they suck out the viscous treacle from beneath them? [Sorry to paint such peculiar pictures -- it's the way my mind works!] -
Tom Curtis at 18:47 PM on 10 December 2011Huber and Knutti Quantify Man-Made Global Warming
dagold @12, the BEST project currently only has a land temperature index. Land has warmed faster than the sea, so full global indices have a lower temperature rise over the century. The three data bases you need to consult for an accurate temperature are: GISSTemp (The column headed J-D is the annual mean) HadCRUT3v (the last column is the annual mean) NOAA. Of these, NOAA and GISS are the best, IMO, with HadCRU running cooler than the others because of flaws in their methodology. However, both NOAA and GISS only extend back to 1880, while HadCRU extends back to 1880 with dubious reliability due to limited land station data. The preindustrial era is generally taken as being prior to 1750. No global temperature record exists to that period, and reconstructions differ significantly. Temperatures where probably lower than in 1900-1910 (which was exceptionally cool), but not by much.Moderator Response: [John Hartz] Typo in the third paragraph re the start dates shown? -
Ross Handsaker at 18:45 PM on 10 December 2011Plimer vs Plimer: a one man contradiction
John, page 121 of Plimer's book makes no mention of a 4 degree temperature rise due to CO2 - that page concerns mainly the Suns energy output. On page 186 Plimer comments that "The global warmth of the Cretaceous has been attributed to elevated levels of CO2 in the atmosphere". But, he follows on with the comment "However, there are some suggestions that the Cretaceous climate was decoupled from the CO2 content of the atmosphere". On page 278 when he states "Temperature and CO2 are not connected" this followed from the observation that "At 800,000 and 600,000 years ago, CO2 dropped below 180 ppmv yet temperature was unchanged". Plimer agrees CO2 in the atmosphere has a warming effect so his remark that it warms the planet does not seem contradictory. The logarithmic effect of adding more CO2 to the atmosphere coupled with the feedbacks (positive or negative) seem to be the contentious issues. -
dagold at 18:31 PM on 10 December 2011Huber and Knutti Quantify Man-Made Global Warming
Please excuse these basic questions, but 1)many sources I come across list the rise in land-surface temps in the 'last century' as O.8 or 0.9 C...but the BEST graph, for example, seems to show a rise of about 1.2 C when taking 1900-1910 as a start point. Is 1.2 more accurate? 2) What is the generally accepted figure of total warming from start of industrial age (i.e. Fossil Fuel Era)and what approximate date is used as the 'start date' of ramp up due to GHGs? I have found these basic questions a bit challenging to get a solid fix on and I am writing a book using my avoidance/denial to acceptance journey with major disease as a metaphor to how humans are facing (or not) climate change Thanks! -
Tom Curtis at 16:57 PM on 10 December 2011The Monckton Maneuver
Tsumetai @30, I agree. Monckton's method can give a ball park figure at best. Never-the-less, pointing that out is a far weaker response than pointing out that he was using the completely wrong figure for his method. I suspect any genuine climate scientists Monckton ran this past would have made several points: 1) That he should use the well mixed GHG forcing, not the total forcing including water vapour and clouds; 2) That the 100 W/m^2 figure was far to high for the well mixed GHG forcing, and too low for the total forcing; 3) That the climate sensitivity varies based on temperature, ice distribution, continental distribution and other factors, and so his method would give a rough estimate only; 4) That a proper application of his method would employ the change in temperature from a no well mixed GHG state to the current state, and that because of changes in sea ice, clouds, and water vapour content, that is probably not 33 degrees C (see this page); 5) If land ice is allowed to vary under (4) so that the Earth Sytem Sensitivity instead of the Charney Sensitivity is measured, the change in temperature probably involves a change from snowball earth to current conditions, so issues of hysteresis are involved; and 6) That because of the calculations needed in (4) and (5), the proper application of his method must employ the output of models. There may well be more points they could make, but I believe the first two are the most immediately fatal to his conclusions.
Prev 1361 1362 1363 1364 1365 1366 1367 1368 1369 1370 1371 1372 1373 1374 1375 1376 Next


