


 Arguments


Recent Comments
Prev 1362 1363 1364 1365 1366 1367 1368 1369 1370 1371 1372 1373 1374 1375 1376 1377 Next
Comments 68451 to 68500:
-
dagold at 18:31 PM on 10 December 2011Huber and Knutti Quantify Man-Made Global Warming
Please excuse these basic questions, but 1)many sources I come across list the rise in land-surface temps in the 'last century' as O.8 or 0.9 C...but the BEST graph, for example, seems to show a rise of about 1.2 C when taking 1900-1910 as a start point. Is 1.2 more accurate? 2) What is the generally accepted figure of total warming from start of industrial age (i.e. Fossil Fuel Era)and what approximate date is used as the 'start date' of ramp up due to GHGs? I have found these basic questions a bit challenging to get a solid fix on and I am writing a book using my avoidance/denial to acceptance journey with major disease as a metaphor to how humans are facing (or not) climate change Thanks! -
Tom Curtis at 16:57 PM on 10 December 2011The Monckton Maneuver
Tsumetai @30, I agree. Monckton's method can give a ball park figure at best. Never-the-less, pointing that out is a far weaker response than pointing out that he was using the completely wrong figure for his method. I suspect any genuine climate scientists Monckton ran this past would have made several points: 1) That he should use the well mixed GHG forcing, not the total forcing including water vapour and clouds; 2) That the 100 W/m^2 figure was far to high for the well mixed GHG forcing, and too low for the total forcing; 3) That the climate sensitivity varies based on temperature, ice distribution, continental distribution and other factors, and so his method would give a rough estimate only; 4) That a proper application of his method would employ the change in temperature from a no well mixed GHG state to the current state, and that because of changes in sea ice, clouds, and water vapour content, that is probably not 33 degrees C (see this page); 5) If land ice is allowed to vary under (4) so that the Earth Sytem Sensitivity instead of the Charney Sensitivity is measured, the change in temperature probably involves a change from snowball earth to current conditions, so issues of hysteresis are involved; and 6) That because of the calculations needed in (4) and (5), the proper application of his method must employ the output of models. There may well be more points they could make, but I believe the first two are the most immediately fatal to his conclusions. -
Daniel Bailey at 16:19 PM on 10 December 2011CO2 is not increasing
Stop the presses! The Mauna Loa November CO2 data is in:
 [Click to enlarge]
6 more months of increases before the next peak in May 2012.
My WAG (Wild-A**-Guess) for then: 396+
[Click to enlarge]
6 more months of increases before the next peak in May 2012.
My WAG (Wild-A**-Guess) for then: 396+
-
Tsumetai at 15:48 PM on 10 December 2011The Monckton Maneuver
Well, yes, I'm sure unnamed scientists whose response cannot be independently checked would make so weak a response.
It's not particularly weak. Attempting to infer current climate sensitivity from the total greenhouse effect is rather risky. -
Bob Lacatena at 15:03 PM on 10 December 2011Separating signal and noise in climate warming
39, peacetracker, A quick note... you can find sources on the Internet which will show you that the USA has a lot more coal plants than China. This is true, because USA plants are much, much smaller in GW output, and what matters isn't how many plants you have, but how much coal you are burning. -
Eric (skeptic) at 14:33 PM on 10 December 2011Huber and Knutti Quantify Man-Made Global Warming
I downloaded the thesis and it has the proper caveat:"Therefore, we emphasize that the distributions of climate sensitivity estimates derived here cannot be regarded as proper probability distribution functions since the prerequisite of independence of both the climate models and the indices is not fulfilled in the framework of this study." on page 26. That applies to the picture Tom posted: not a probability distribution, but a model run distribution assuming particular models and model parameters. -
Eric (skeptic) at 14:01 PM on 10 December 2011Huber and Knutti Quantify Man-Made Global Warming
Thanks Tom. I zoomed fig. 1a and the solar there looks fairly representative. The flatlining of the data from 2000 on makes sense, since that is the date of those papers. It looks like ref 17 will help explain this paper, it is Huber's thesis (too big to download ATTM, but the abstract looks promising). -
Tom Curtis at 13:30 PM on 10 December 2011Huber and Knutti Quantify Man-Made Global Warming
Eric (skeptic) @7, if you look at figure 1 a, the solar cycle shows up in the solar forcing until 2000. Thereafter it is smooth. The fluctuations due to the solar cycle appear small due to the scale, not because they are ignored. Presumably in the chart of cumulative contribution the small fluctuations due to the solar cycle make so little difference to the cumulative change as to be indiscernible. Alternatively, that chart has an 11 year plus smooth that would effectively eliminate the solar cycle from the data. Please note that by flat lining the solar contribution at the average value from 2000 forward, Huber and Knutti over estimate the solar contribution on average over the last eleven years in that the most recent solar cycle was much smaller than the one that preceded it. -
Tom Curtis at 13:17 PM on 10 December 2011Huber and Knutti Quantify Man-Made Global Warming
skept.fr @6, unfortunately I cannot find any succinct discussion of the issue, so I'll have to do the best I can myself. The CMIP3 is a collection of model runs from 25 different models under different configurations. Some of the models are different versions of the same underlying architecture. For example, there are three GISS models, differing in ocean configuration and resolution. Each model did multiple runs. When set up for 1956 conditions and run for 50 years with no forcings, they show the following distribution of 50 year temperature trends (fig 4 a from Huber and Knutti, 2011):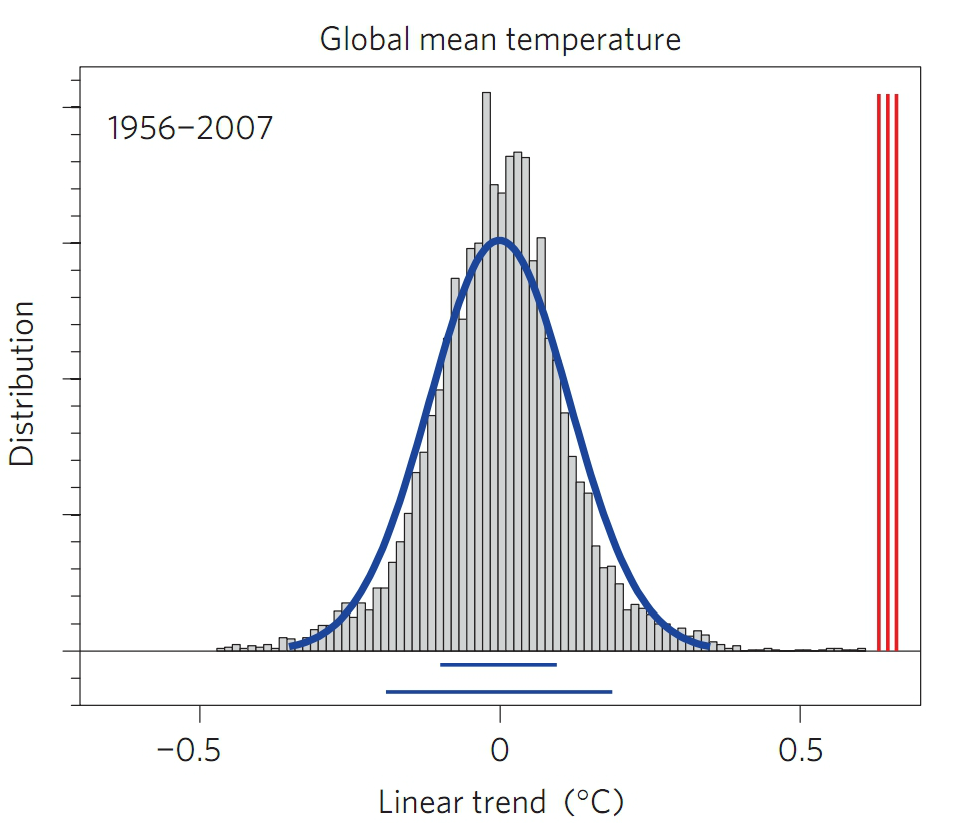 This is a histogram of the 50 year trends obtained by the CMIP3 constant forcing experiment. As you can see the mean of the trends is zero, and the 1, and 2 standard deviations being shown be blue bars below the graph. A quick measurement shows that the surface temperature record (red bars on the right) with the lowest trend is (rounded down) 6.8 standard deviations above the mean, which means that there is less than a 1 in 100 billion chance that the temperature trend over that period arose by unforced variability if the climate models fairly represent internal variability in the climate.
I think the assumption of fair representation is a good approximation (though unlikely to be exactly true). More importantly, we definitely know that there have been forcings over that period, so attributing the trend to unforced variability while ignoring the known forcings is foolish.
Turning directly to your question @1, assuming the models fairly represent internal variability, then we know that there are no significant natural internal variable cycles of greater of 30 - 100 year length because if there were the distribution of the histogram would not be so tightly constrained.
Of course, many of the models had very simple oceans, so a long term internal cycle may exist but not be reflected in most of the models. However, as seen in the residual of the CMIP3 21 model mean from HadCRUT3, there is no apparent cycle in the residual. That means there is little statistical evidence to suspect a cycle. Indeed, to attribute the large scale temperature variations over the century to internal variability, you would need to find a reason as to why the known forcings did not apply.
This is a histogram of the 50 year trends obtained by the CMIP3 constant forcing experiment. As you can see the mean of the trends is zero, and the 1, and 2 standard deviations being shown be blue bars below the graph. A quick measurement shows that the surface temperature record (red bars on the right) with the lowest trend is (rounded down) 6.8 standard deviations above the mean, which means that there is less than a 1 in 100 billion chance that the temperature trend over that period arose by unforced variability if the climate models fairly represent internal variability in the climate.
I think the assumption of fair representation is a good approximation (though unlikely to be exactly true). More importantly, we definitely know that there have been forcings over that period, so attributing the trend to unforced variability while ignoring the known forcings is foolish.
Turning directly to your question @1, assuming the models fairly represent internal variability, then we know that there are no significant natural internal variable cycles of greater of 30 - 100 year length because if there were the distribution of the histogram would not be so tightly constrained.
Of course, many of the models had very simple oceans, so a long term internal cycle may exist but not be reflected in most of the models. However, as seen in the residual of the CMIP3 21 model mean from HadCRUT3, there is no apparent cycle in the residual. That means there is little statistical evidence to suspect a cycle. Indeed, to attribute the large scale temperature variations over the century to internal variability, you would need to find a reason as to why the known forcings did not apply.
 (Source PDF)
Further, there are good physical reasons to doubt the existence of such long term cycles of internal variability. Specifically, such a cycle would mean the Earth must maintain a net energy imbalance for sustained periods. That is highly unlikely.
Finally, the internal variability that exists in the climate can be analogized to a pendulum, and under forcing may well be analogical to a forced pendulum. That means the internal variability under an unforced state may well not match that under a forced condition, ie, the conditions that actually exist. In that case, we would expect an increase in natural variability with time as the forcing becomes stronger. Following the pendulum analogy, that increase would not be consistent over time, and may well include periods of reduced variability. But statistically, over time there would be an increase.
There is in fact some evidence of that, but the increase in variability is uncertain with regard to ENSO and precipitation, and relatively small with regard to temperature. Therefore this possibility is unlikely to significantly alter Huber and Knutti's result.
(Source PDF)
Further, there are good physical reasons to doubt the existence of such long term cycles of internal variability. Specifically, such a cycle would mean the Earth must maintain a net energy imbalance for sustained periods. That is highly unlikely.
Finally, the internal variability that exists in the climate can be analogized to a pendulum, and under forcing may well be analogical to a forced pendulum. That means the internal variability under an unforced state may well not match that under a forced condition, ie, the conditions that actually exist. In that case, we would expect an increase in natural variability with time as the forcing becomes stronger. Following the pendulum analogy, that increase would not be consistent over time, and may well include periods of reduced variability. But statistically, over time there would be an increase.
There is in fact some evidence of that, but the increase in variability is uncertain with regard to ENSO and precipitation, and relatively small with regard to temperature. Therefore this possibility is unlikely to significantly alter Huber and Knutti's result.
-
actually thoughtful at 12:25 PM on 10 December 2011The Monckton Maneuver
I think Monckton scored a TKO on Monckton. The above is, I believe, what journalism is supposed to be. I don't see that happening very often (regardless of the issue, or the politics). I love this type of work - it makes it really easy to see how wrong these people are. Thank you Mr. Hadfield -
Eric (skeptic) at 12:13 PM on 10 December 2011Huber and Knutti Quantify Man-Made Global Warming
I'm not sure how the forcings in this study were determined. The text says "Although the estimates for most forcing agents are similar, we infer a larger energy flux from variations in solar irradiance as a result of the particular forcing reconstruction used. If anything our estimate of the solar contribution is likely to be overestimated (see Methods)." In methods they point to [15] Joos 2001 which has nothing on solar forcings and [16] Crowley 2000 which shows solar forcing quite variable (e.g. Crowley fig 2B) nothing like the smooth rise in the current paper fig 2c. Nor do other depictions of TSI (e.g. "It's the sun" thread) match the smooth rise in fig 2c. It looks to me like fig 2c is a model output in the current study. If that is the case, what is the model input, specifically for solar forcing, or is it simply an output (essentially what the simulation came up with to match observed temperature rises and other constraints). -
Tom Curtis at 11:58 AM on 10 December 2011Not so Permanent Permafrost
For the record, I want to note that Agnostic has corrected the caption on figure 2. He has also advised me privately that he is consulting with John Cook about how, and in what way it is appropriate to upgrade the caption. That consultation is necessary because of recent (and ludicrous) criticism of SkS for updating posts with more recent information. -
skept.fr at 11:19 AM on 10 December 2011Huber and Knutti Quantify Man-Made Global Warming
Dana : maybe one of the author will come here for comments, as Nathan Urban and Andreas Schmittner did in a previous discussion, so I’ll wait before disturbing Dr Knutti. (And it would be more informative for SkS readers than a private exchange.) But thanks for the information. Tom : unfortunately, I’m a layman and I cannot interpret the terabytes of data from CMIP3, I’m not even sure I could read them on my computer ! I hope my point refers to some published and free articles in the literature, where climate scientists discuss the challenges and methods for dealing with unforced change in the system. I did find some documents (like this Shukla 2010 presentation , but this is a bit elliptic and complex for my level of understanding, I'd prefer a more introductive paper. -
Tom Curtis at 11:13 AM on 10 December 2011Economic Growth and Climate Change Part 2 - Sustainable Growth - An Economic Oxymoron?
adamski @56, as skept.fr indicates, my 55 is sufficient response to your 56. If you require further comment, skept.fr @57 states it very eloquently. Beyond that I note that the comments policy states: No politics. Rants about politics, ideology or one world governments will be deleted Personally I believe that your 56 violates this policy, but presume you have been given leeway in light of the topic of the main post. Regardless, I do not believe that I can respond without violating the comment policy restriction against political discussions. In another context I would happily debate with you the virtues of market socialism (or at least my version of it), industrial democracy and my more idiosyncratic ideas (such that advertising should be true and informative). But this is not the time or place, and making such ideas a means to the end of reduced emissions (as opposed to pursuing them on their own merits independently) merely delays action on emissions.Response:[DB] Fixed html tag.
-
Tom Curtis at 10:52 AM on 10 December 2011Huber and Knutti Quantify Man-Made Global Warming
skept.fr @1, information about the CMIP 3 model runs can be found . The data can be downloaded here (requires registration, and may require non-commercial institutional affiliation). The data listed is probably from experiment 1 or experiment 2. -
A_Gang_of_Loners at 10:50 AM on 10 December 2011Empirically observed fingerprints of anthropogenic global warming
gnbatt @6 There is something you and all commentators on science and epistemology are going to have to learn about computer simulations and math modeling. And that is that it is ONLY abstract models that can determine cause and effect - NOT experience. And this is a fact for ALL phenomena, not just climate change. Whether those models are written explicitly in a computer simulation or we merely keep them in our heads, ALL experience requires an interpretation for us to be able to say "this caused that". If we were discussing, for example, the hypothesis of whether non-human aliens are the best explanation for many UFOs and USOs, or whether Bigfoot is the best CAUSE for the observed effects of large footprints found in forests and loud screams heard and for many spontaneous sightings by hunters and motorists, you can sure bet there'd be those who totally ignore the value of direct experimental observed evidence. They'd steer the entire conversation off into the direction of debating the abstract interpretation of these events. It is not, and never has been, "direct experimental or experiential" evidence that proves anything, especially cause and effect. Because the entire concept of PROOF, itself, is abstract. Direct experience is merely sets of atoms. The difference between lazy mindless speculation about cause-and-effect versus the difficult task of writing down one's model mathematically and encoding it into a computer is that the computer simulations and mathematical modeling actually require hard work and discipline, and are INFINITELY better at coming up with theories of cause-and-effect that are LOGICALLY CONSISTENT, not just internally, with themselves, but with all other cause-and-effect theories on events outside climate theory. Example: One CAN say that a human, dressed up in a gorilla suit and placed herself in the middle of a forest in the dead of winter so that a random traveller or hunter would catch sight of them, is the cause of a Bigfoot sighting. For this theory of cause-and-effect to be true, one would have to be consistent accept the theory that every event caught on security surveillance camera is just a staged event, because it is "too outrageous" to believe that anyone could commit a crime and risk arrest. To be completely objective on interpreting events, we would need artificial-intelligent robots, with vision and hearing capabilities, interpret events. We all know how difficult and expensive THAT is. It has taken YEARS of research and BILLIONS of dollars to get robots to categorize all those millions of pixels as separate objects. Since we don't have the money and means to pay robots with AI to interpret outside reality for us, we will have to rely on humans as the interface. In the case of the climate, that means climate scientists. But, just like it would be the robot brain that does the abstract work of turning all those pixels it sees and soundwaves it senses into a theory of cause and effect (if I walk here, that will cause me to bump into this object), the climate scientists and programmers HAVE to do the next best thing by mathematicallly modeling events and fitting it to data in a manner that is logically consistent with the way we model all other events we observe. Deniers are simply too <-snipped-> even to acknowledge that they are doing abstract modeling whenever they hypothesize an alternative cause for current global warming.Moderator Response: Please refrain from overt insults. And please do not use all caps for emphasis. Use italic or bold. -
John Hartz at 10:47 AM on 10 December 20112011 AGU Conference Day One
As documented below, at least one Argentine scientist is attending the climate talks in Durban with the objective of educating policy-makers. However, it’s still not a well-explored concept outside the scientific community. At the COP climate talks in Durban, for example, there is endless talk about atmospheric carbon and about how to control terrestrial carbon emissions through deforestation programs like REDD+. But there are still very few mentions of oceanic carbon. “Hopefully, by exposing the science to higher level decision makers, we will bridge a gap of communication for that necessary understanding” of the role that oceans play in climate change, said Alberto Piola, an oceanographer with the Naval Hydrographic Service in Argentina, speaking at a side event on Blue Carbon at COP 17 this week. The above two paragraphs are excerpted from "Blue Carbon: the role of the oceans in climate change" posted today on Climate Progress. To access this informative article, click here. -
Tom Curtis at 10:45 AM on 10 December 2011Schmittner et al. (2011) on Climate Sensitivity - the Good, the Bad, and the Ugly
skept.fr @73, they can be estimating either Charney Sensitivity or Earth System Sensitivity, depending on which forcings they consider. If they consider changes in albedo as a forcing, they measure Charney Sensitivity. If they consider changes in Albedo as a feedback, they measure Earth Sytem Sensitivity. Thus Hansen and Sato give CS as 3 degrees per doubling, but ESS as 6 degrees per doubling. I consider the latter a very suspect number for prediction of future events. With the retreat of ice towards the poles, albedo effects and hence ESS will become weaker. That is partly compensated for by an increased strength in the WV feedback with increased temperature, but none-the-less, a higher ESS in glaciated conditions than non-glaciated conditions is a persistent feature of the Earth's climate system according to Park and Royer, 2011. They find a best estimate ESS of 3-6 degrees per doubling of CO2 for non-glaciated conditions, but 6-8 degrees C for glaciated conditions. I should not that WV is a fast feedback, so technically this would indicate that CS increases with increasing temperature, while ESS decreases with decreasing temperature until the Earth reaches a non-glaciated state. -
Tom Curtis at 10:25 AM on 10 December 2011Greenland has only lost a tiny fraction of its ice mass
John Russell @11, your account of the situation is too simple. The land in many polar regions is rising because a loss of glacial ice has increased its increased buoyancy. Like a boat, because it has a reduced load above the water line, it floats higher in the water and occupies a reduced space below the water line. Of course, in the case of continents (and Greenland) they do not float on water, but on the magma beneath the Earth's crust. But they are rising not by thickening, but by floating higher in the magma. Because they float higher in the magma, the space they previously occupied must be filled by magma drawn from somewhere else. That somewhere else is beneath the oceanic crust, which is very thin and conforms to the magma beneath it. Consequently, where the land rises, the local ocean floor sinks due to the magma beneath the ocean floor moving from beneath the ocean floor and under the rising land. Hence the need for the Global Isostatic Adjustment. -
John Hartz at 10:24 AM on 10 December 2011Huber and Knutti Quantify Man-Made Global Warming
Dana: Excellent post. I especailly like the introductory paragprah that captures the essence of the article. You've set a good example for other SkS authors to follow. -
Pete Dunkelberg at 10:06 AM on 10 December 2011Huber and Knutti Quantify Man-Made Global Warming
Link to liberated pdf. This result really just confirms common sense. There has been too much warming in too little time for it to be only coincidentally connected to the known drivers. As Gavin previously noted at RC about the fraction of warming likely due to human forcing:Over the last 40 or so years, natural drivers would have caused cooling, and so the warming there has been (and some) is caused by a combination of human drivers and some degree of internal variability. I would judge the maximum amplitude of the internal variability to be roughly 0.1 deg C over that time period, and so given the warming of ~0.5 deg C, I'd say somewhere between 80 to 120% of the warming. Slightly larger range if you want a large range for the internal stuff. - gavin]
-
Fran Barlow2 at 09:30 AM on 10 December 2011Plimer vs Plimer: a one man contradiction
I'm very much in agreement with the thrust of your remarks Agnostic but I don't think we should become too wedded to the 4-5m mean SLR/4-6°C rise in average global temperature by 2100 scenario. On the best data we have about likely human responses over the next decade, this scenario is plausible, and perhaps as likely as not. The broader point you make is that human interest doesn't stop at 2100 and whether humanity gets there by 2100 or 2200 is neither here nor there. Unless we can turn the rend around, sooner or later there will be a very much diminished biosphere for the probably more than 9 billion people living on Earth. In an inequitable world, we know how that narrative goes. To wink at this and talk of the possibility that over geological timescales, the biosphere will recover, is to take a reckless and sociopathic attitude to the welfare of billions of human beings and human progress itself. It's astonishing that people who speak this way are not condemned as the the scary radicals in this conflict. -
John Russell at 08:51 AM on 10 December 2011It's Not About The Hockey Stick!
@SirNubwub I would recommend using the information on NASA's site. All your students will of course know and respect the work of NASA and will therefore accept what their scientists say as the true facts about global warming. NASA has some very good educational material on their site which I use all the time to convince people that AGW is real, man-made and potentially dangerous. Best of luck with your important work. -
skept.fr at 08:44 AM on 10 December 2011Economic Growth and Climate Change Part 2 - Sustainable Growth - An Economic Oxymoron?
#54, 56 Adamski – As Tom in #55, and pragmatically, I’d say ‘the best is the enemy of the good’, whatever your definition of the ‘best’. (-snip-)Response:[DB] Please see my caution to adamski above, RE: Adherence to the Comments Policy. Thanks!
-
dana1981 at 08:01 AM on 10 December 2011Huber and Knutti Quantify Man-Made Global Warming
skept - I can't answer your question, but you could try to contact Dr. Knutti, if you really want an answer. His email is listed in the paper, which is linked at the top of the post. -
Zen69 at 07:44 AM on 10 December 2011Separating signal and noise in climate warming
Thanks to everyone for your help. You have provided me with some very useful information. Cheers -
Riduna at 07:24 AM on 10 December 2011Plimer vs Plimer: a one man contradiction
Mercury Scientist @ 11 writes – “I do agree that as a species, we will adapt and survive.” That depends on the speed with which change occurs. According to Hansen and others, what we can expect by 2100 is 4-5 metres rise in mean sea level and an increase of 4-6°C in average global temperature. And no one should think that this will be an equilibrium position. Sea level and temperature will continue rising long after 2100. We may well be able to adapt and survive such outcomes but in vastly reduced numbers and certainly not in our present socio-economic condition - but for how much longer beyond 2100? I for one do not share the optimism of Mercury Scientist. Unless we rapidly curb greenhouse gas emissions and do it now our ability to survive at all beyond 200 years or so is highly questionable. -
Philippe Chantreau at 06:35 AM on 10 December 2011Nils-Axel Mörner is Wrong About Sea Level Rise
"If you asked me to use the data from 1993 to 1997 to predict following years I would say there is a serious up trend." That would be so grossly incompetent that even someone with a limited knowledge of statistics like me would call you on it. No trend can be identified from such a short period of time. If anyone asked you to do a prediction based on so few years, you should respond that it can not be done. -
kampmannpeine at 06:23 AM on 10 December 2011The Monckton Maneuver
very nice videos ... I am getting flooded here in GErmany with some EIKE claims (in German) which I would like to post here, some of them are PDFs. Will this be possible? -
ahaynes at 06:20 AM on 10 December 2011Plimer vs Plimer: a one man contradiction
I believe the term is kettle logic. -
skept.fr at 06:17 AM on 10 December 2011Huber and Knutti Quantify Man-Made Global Warming
Huber and Knutti write in their paper : "The basis for our energy balance model and a crucial step in determining the contributions of anthropogenic and natural (solar and volcanic) forcings to the observed changes is the magnitude of the internal unforced variability of global temperature and energy content. Figure 4 compares the observed trends in global average temperature and energy content over the past 50 years with the distribution of 50-year linear trends derived from unforced control runs in the World Climate Research Programme's (WCRP) phase 3 Climate Model Intercomparison Project." Where can we find informations about this "crucial step"? It is unclear for me how the EBMs / AOGCMs deal with unforced or intrinsic variability, either at low or high frequency, but particularly for hypothetical low frequency modes (> 30 yrs). If such a variability exists, what do we know about its physical mechanisms and how are they implemented in models? What are the methods used by modellers for assessing the quality (realism) of the "unforced control runs" from which they can deduce the forced variability? Thank you for any recent link centered on these questions. -
skept.fr at 06:02 AM on 10 December 2011Schmittner et al. (2011) on Climate Sensitivity - the Good, the Bad, and the Ugly
#72 ranyl : Thank you for the references. I didn’t find Schneider’s paper for free, any link ? The distinction by Lunt et al 2010 between what they called Charney sensitivity (CS), fast feedbacks, and Earth System sensitivty (ESS), slow feedbacks, is interesting. The robustness of the application to mid-Pliocene warm period depends ultimately on the robustness of the estimation of boundary conditions they considered (CO2 orography, vegetation, icesheet) and of the reconstructed temperature change (for checking model fiability), all derived from PRISM data. So, to be continued ( here the page for selected publications around PRISM). Anyway, this leave me with a question : when models compare LGM and Holocene, should we consider they estimate CS or ESS ? As far as I undestand, climate of the mid-Holocene is considered as stable, so I guess it is ESS. -
scaddenp at 05:44 AM on 10 December 2011It's waste heat
"Your link to 2011 world energy outlook states in the second line that it's about the energy market, so I prosume it only takes into account metered power or power that is taken from the grid. " Ah no. It is about the energy generated and measured at source. Much easier to measure. -
arch stanton at 05:38 AM on 10 December 2011Plimer vs Plimer: a one man contradiction
Thank you for the post John. Nice of you to remind Plimer since he seems to have a memory deficiency… If it’s any consolation; he has not made the impact with us yanks as he has down under. BTW, I hope you and the others that made it had a nice time up here on the left coast this week. -
BillEverett at 05:36 AM on 10 December 2011Plimer vs Plimer: a one man contradiction
With regard to past atmospheric CO2 concentrations and temperatures, a graph of the time series data over the past 800,000 years from Antarctic ice cores may be interesting. Below is a version (reduced from 609 pixels to 450 pixels wide) of Fig.1 in a paper by Alexey V. Byalko on the paleoclimate published in the journal Priroda [in Russian] (No.12, 2009, pp.18-28). The entire issue is downloadable as a pdf file (5 Mb). The x axis in the graph is time in thousands of years ago. In other words, "now" is zero on the left and the oldest data is on the far right. This is backwards to most graphs, which show "real" time (or "calendar" date) increasing from left to right. The green curve is a plot of methane (CH4) concentration in ppb, the blue curve is carbon dioxide (CO2) concentration in ppm, and the red curve is a plot temperature deviation from the current average global temperature in degrees C. These plots may suggest how often atmospheric CO2 concentration exceeded 300 ppm during the past 800,000 years, how often and for how long the average global temperature was higher than it is now, and so on. I suppose the temperature decrease from about current temperature to -2 at the exit from the most recent deep ice age was associated with the Younger Dryas. This event seems clearest in the CH4 data, where a decrease from about 700 to about 550 ppb is seen. Moderator Response:
[Albatross] Fixed image width.
[DB] As an FYI, the highest CO2 excursions in the ice core records is 298.7 ppm.
-
John Russell at 05:32 AM on 10 December 2011Greenland has only lost a tiny fraction of its ice mass
I've just read an article on the 'Physorg' site about research that shows that as Greenland loses ice, the bedrock is rising -- by 6mm last year. It occurred to me that if the land is rising, so must the sea bed around Greenland -- and if that's the case, then won't the rising sea bed displace water? So if that's correct, does anyone know whether this is being factored into sea level rise; and how much might global sea level rise as a result? It's, as journalists like to say, a 'double whammy'. I hope I put this post in the right thread -- I did consider one on sea level rise.Response:[DB] "does anyone know whether this is being factored into sea level rise"
Yes; GIA corrections are made to the sea level analysys performed, as shown here:

-
Chris G at 05:26 AM on 10 December 2011Plimer vs Plimer: a one man contradiction
Bernard (#3), I took a look at that posting, and it caused me pain. "Irreversible"? Well, yes, over thousands to millions of years. Over the course of a human lifetime or two, umm, no. But, the readers there jump all over the first 'yes', and conveniently ignore the fact that a reversal will not come soon enough for the great-great-...-great-grandchildren of anyone alive today. Sites like that are gathering places where people are free to make up their own facts, disregard others, overlook logical inconsistencies, and call well-established science "mantra". In that environment, there is no convincing someone to change their mind, because there is nothing tying them down to reality. People that get along there could come to sites like this one, but would quickly get frustrated by being restricted to claims that are relevant and can be substantiated. People from here could go there, but when they put out information that can readily be verified, and contradicts the information provided there, they are mocked, and the mockers receive applause. So, there are these fortresses that occasionally lob shots at one another, but for the most part, people in one don't communicate much with people in the other. And, meanwhile, the uncaring, unknowing masses proceed with BAU. -
Mercury Scientist at 04:54 AM on 10 December 2011Plimer vs Plimer: a one man contradiction
A promotional flyer (http://www.iaq.com.au/images/Event%20Flyers/2009/IAQ%2023%20june%202009%20Flyer.pdf) states that Plimer "rejects the unscientific idea that the explanation of climate change can be reduced to one variable (CO2)..." Gee, last time I checked, scientists' consensus in the IPCC Fourth Assessment Report was that [anthropogenic???] radiative forcing was attributed to CO2, CH4 (methane), nitrous oxide, and CFC's. CO2's radiative forcing is ~1.5 W/m2. Sum of all the others is ~0.9 W/m2, so not insignficant at all. CO2 is a big one, but clearly it is wrong to suggest that the scientific community is reducing climate change to "one variable (CO2)." The flyer further states that "He [Plimer] rightly assumes that humans will be able to adapt to any future coolings or warmings." Funny how they have verified this assumption already, when we're just getting started with the warmup. I do agree that as a species, we will adapt and survive. However, I also believe it is wrong to assume that profligate dumping of greenhouse gases into the global atmosphere will be without serious consequences and costs to society. I believe it would me much more cost-effective, prudent, and conservative to be proactive on this issue: reduce energy demand, and adjust our energy portfolio by increasing non-polluting sources, and decreasing polluting sources. -
Mercury Scientist at 04:33 AM on 10 December 2011Plimer vs Plimer: a one man contradiction
I wasn't familiar with this Plimer dude, so I did a google scholar search on him (plimer i r). Looks like his background is in hard rock geology and mineralogy. In the first 5 or so pages of google scholar hits, I did not see a single peer reviewed paper that appeared to have anything to do with paleoclimate. His papers have titles like "Tourmalinites from the Golden Dyke dome, northern Australia;" "Exhalative Sn and W deposits associated with mafic volcanism as precursors to Sn and W deposits associated with granites;" "The origin of the albite-rich rocks enclosing the cobaltian pyrite deposit at Thackaringa, NSW, Australia;" etc. If there's a climate connection in any of them, I hope someone will point it out. Google scholar does, of course, include his "Heaven and Earth--Global Warming: the Missing Science." I would bet that this book was not subject to rigorous peer review. I will concede that he must be quite knowledgeable on geology - particularly minerals & rocks - but his specific area of expertise seems quite disconnected from what he writes about in his popular book. I contend that "the Missing Science" is the fact that nothing on his own CV suggests any stature or relevant research experience in the paleoclimate field. -
John Hartz at 04:04 AM on 10 December 2011Separating signal and noise in climate warming
@peacetracker #31: I totally agree with you. "fingerprints" are the most convincing proof that manmade climate change is real and is happening now. It would behoove SkS to ratchet-up its coverage of the climate changes that scientists and people througouht the world are documenting and witnessing. -
dorlomin at 03:29 AM on 10 December 2011Plimer vs Plimer: a one man contradiction
@Robert Murphy 6 I think he is talking about Dansgaard Oeschger events http://en.wikipedia.org/wiki/Dansgaard%E2%80%93Oeschger_event But I think the 8C warming is local to Greenland. -
tmac57 at 03:11 AM on 10 December 2011Plimer vs Plimer: a one man contradiction
Composer99-I absolutely agree that we are all capable of confirmation bias.It is a human trait to try and avoid cognitive dissonance as much as possible.What I observe in these pseudo-skeptics though,is willful disregard for objective facts,that is indistinguishable from outright lying.Maybe that's just my own bias talking. -
Composer99 at 02:52 AM on 10 December 2011Plimer vs Plimer: a one man contradiction
tmac57: I suspect there is a great deal of compartmentalized thinking going on. Everyone is capable of, and indeed I am sure everyone engages in it once in a while. The problem here is that climate contrarians let themselves get carried away. -
Riccardo at 02:51 AM on 10 December 2011It's waste heat
jmorpuss I see a lot of effort to move energy minimizing losses. And clearly I do not by the idea that the less energy is absorbed the more the air will warm. I belive in energy conservation, call me crazy. -
muoncounter at 02:37 AM on 10 December 2011It's waste heat
jmorpuss: What about all the energy radiated by high tension power lines? They are 'hot,' carrying many megawatts, 24/7. Why else would power lines be called 'hot'? To do a complete accounting of all this warming potential, you must add that to the count of cell phone towers and microwave ovens. The microwave heating fellow's credentials are stated on his about page: I was studying the Microsoft MCSE Exam 70-058 that I discovered, what I considered, a possible explanation for the Polar Ice caps melting. In the networking essentials book, they said that the connection on a wireless network was a microwave frequency. When I learned that, I was immediately struck with the notion that wireless frequencies could cause warming. I figured if the wireless connections were microwave connections, then with an enormous use of these connections there could be a significant environmental effect over a long period of time. I wish I had such clarity of insight. I'm doing my part by shutting off my wireless router and canceling my dish network subscription. -
Daniel Bailey at 02:37 AM on 10 December 2011It's Not About The Hockey Stick!
You're quite welcome. I would encourage you to take the recommendations that the others have made above to heart. You are the steward of a precious cargo: young minds. It is a trust given you, one that entails a great responsibility. Given the extreme levels of disinformation in the media about climate science and the massive amounts of dissembling websites in the blog-o-sphere, it's extremely difficult to know whom to trust for reliable information about the science. This website is created precisely for those just like you: people who have an interest in learning, but have been exposed to much that is simply incorrect about the science. There is an immense amount of reference material discussed here (4,700+ threads, all replete with links to original peer-reviewed sources) and it can be a bit difficult at first to find an answer to your questions. That's why we recommend that Newcomers, Start Here and then learn The Big Picture. I also recommend watching this video on why CO2 is the biggest climate control knob in Earth's history, per Rob Honeycutt's sage advice above. Further general questions can usually be be answered by first using the Search function in the upper left of every Skeptical Science page to see if there is already a post on it (odds are, there is). If you still have questions, use the Search function located in the upper left of every page here at Skeptical Science and post your question on the most pertinent thread. Remember to frame your questions in compliance with the Comments Policy and lastly, to use the Preview function below the comment box to ensure that any html tags you're using work properly. -
Robert Murphy at 02:35 AM on 10 December 2011Plimer vs Plimer: a one man contradiction
Bernhard, look at Rinehart's #5: "Over the last 120,000 years, there have been 25 periods of warming where temperature rose by up to 8 deg C. These were not driven by human emissions, were natural and were neither irreversible nor catastrophic." What the????!! 25 times of 8*C change during the last 120,000 years, which was mostly a glacial period? Where do they get this nonsense? I remember seeing a similar thing on a Neil Boortz thread a few years ago. I think it may have come from Plimer ultimately. -
les at 02:34 AM on 10 December 2011It's waste heat
123 - jmorpuss What do you see? And, assuming it's something to do with your claims, how many kw do you estimate based on what input? Numbers are what counts; all else is just waffle. Well, OK, numbers and physics - but the rest is waffle. -
tmac57 at 02:28 AM on 10 December 2011Plimer vs Plimer: a one man contradiction
The thing that stands out most starkly to me,is that deniers will mercilessly mock and nitpick Al Gore,despite the fact that he got most of his facts right,but never ever,ever,ever,examine criticize,or retract obvious mistakes and contradictions that come from their spokespersons.How can they reconcile such gross hypocrisy?Moderator Response: [John Hartz] Because most deniers are ideologues. Their ideology blinds them to reality.] -
SirNubwub at 02:17 AM on 10 December 2011It's Not About The Hockey Stick!
[DB] Thank you for your consideration.
Prev 1362 1363 1364 1365 1366 1367 1368 1369 1370 1371 1372 1373 1374 1375 1376 1377 Next


