


 Arguments


Recent Comments
Prev 1364 1365 1366 1367 1368 1369 1370 1371 1372 1373 1374 1375 1376 1377 1378 1379 Next
Comments 68551 to 68600:
-
John Hartz at 07:54 AM on 9 December 20112011 AGU Conference Day One
“The latest research shows that climate talks must lead to more aggressive action to avoid the catastrophic effects of global warming.” Source: “Climate Negotiations Fail to Keep Pace with Science” by David Biello, Scientific American, Dec 7, 2011 To access this timely article, click here. PS – Tell me again why the world’s leading climate scientists should not be present en masse in Durban. -
muoncounter at 07:30 AM on 9 December 20112011 AGU Conference Day One
John H: Articles in national media about a geophysical conference? Not gonna happen. See this piece from an SF TV station, which is about the extent of 'coverage.' -
John Hartz at 06:46 AM on 9 December 20112011 AGU Conference Day One
I have yet to see any articles in the national media about what transpired at the AGU. Have I missed some? -
Lazarus at 06:39 AM on 9 December 20112011 AGU Conference Day One
"If you are not already aware, Monckton and his cronies dropped into Durban -- quite literally dropped in." Yep, the cheap stunt was worth a comment on my own blog; http://lazarus-on.blogspot.com/ -
les at 05:07 AM on 9 December 20112nd law of thermodynamics contradicts greenhouse theory
1144 - Fred... "I do understand the Carnot cycle," If that was obvious from your text I wouldn't have posted the right answer... I think you missed the point. "I introduces "quality" much early in these posts to try to explain entropy." Do excuse me for missing that part of your personalized thermodynamics, but even so, I cannot make sense of your quality/deterioration terms. Maybe if you used the same physics as the rest of us learned and use professionally, it might help? Just a thought. -
clarkbeast at 04:59 AM on 9 December 20112011 AGU Conference Day One
I think the bigger scheduling error is holding the policy meetings every winter (Northern Hemisphere, that is). From a press coverage standpoint, that's a total disaster. -
Mercury Scientist at 04:32 AM on 9 December 20112011 AGU Conference Day One
AGU is the same week every year in San Francisco. 20,000 earth scientists. Tough to just re-schedule it so a few of them can go to Durban. Plus, I think they have all the science they need. The tough part is crafting any kind of solution that anyone--particularly the U.S.--will agree to. -
Tom Dayton at 03:45 AM on 9 December 20112011 AGU Conference Day One
I attended John's Tuesday morning panel. He did a great job, and the panel discussion with the audience was excellent. -
John Hartz at 01:24 AM on 9 December 20112011 AGU Conference Day One
MarkR: I would not expect policymakers to attend the AGU Annual Meeting for the reasons that you cited. I would, however, expect prominent climate scientists to attend COP17 in Durban. -
MarkR at 01:20 AM on 9 December 20112011 AGU Conference Day One
Not really a surprise John. They don't have anything to present at AGU, and they're not interested in being forced to sit through proper science. Much easier to just pick out of context bits that you can spin later on... -
skept.fr at 23:53 PM on 8 December 2011Schmittner et al. (2011) on Climate Sensitivity - the Good, the Bad, and the Ugly
#69 ranyl In this recent discussion , Koenig et al 2011 suggest that "the mean annual global temperature for the Pliocene is 15.5 °C compared to 13.3°C for pre-industrial." And the IPCC AR4 states : The Mid-Pliocene (about 3.3 to 3.0 Ma) is the most recent time in Earth’s history when mean global temperatures were substantially warmer for a sustained period (estimated by GCMs to be about 2°C to 3°C above pre-industrial temperatures; Chandler et al., 1994; Sloan et al., 1996; Haywood et al., 2000; Jiang et al., 2005), providing an accessible example of a world that is similar in many respects to what models estimate could be the Earth of the late 21st century. The Pliocene is also recent enough that the continents and ocean basins had nearly reached their present geographic configuration. Taken together, the average of the warmest times during the middle Pliocene presents a view of the equilibrium state of a globally warmer world, in which atmospheric CO2 concentrations (estimated to be between 360 to 400 ppm) were likely higher than pre-industrial values (Raymo and Rau, 1992; Raymo et al., 1996), and in which geologic evidence and isotopes agree that sea level was at least 15 to 25 m above modern levels (Dowsett and Cronin, 1990; Shackleton et al., 1995), with correspondingly reduced ice sheets and lower continental aridity (Guo et al., 2004). So, a 2-3 K (rather than your 3-5K) equilibrium warming for a 360-400 ppm (rather than your 350 ppm) seems in the range of modelled climate sensitivity. But initial conditions of Pliocene were probably different for ice, vegetation, oceanic circulation, etc. and as it has been discussed above, we're not sure that climate sensitivity for 2xCO2 should be a constant value for different climates. -
Daniel Bailey at 22:21 PM on 8 December 2011Schmittner et al. (2011) on Climate Sensitivity - the Good, the Bad, and the Ugly
Ranyl, it's my understanding that temps in the Pliocene had time enough to equilibrate with forcings/feedbacks (such as CO2). Thus the use of the Pliocene as the nearest comp for today's CO2 levels, as the conditions of that world point to what is in store for this world, once temps again equilibrate. Assuming we freeze emissions at zero and hold them there, the warming "in the pipeline" will eventually reach that of the Pliocene. However, a zero-emissions state is something which we show no sign of doing. As such, a few more decades of BAU will lock-in a level of change unseen in this world for eons. With only the mythical CCS existing to save us from this petard of our own devising (powered by cold fusion, no doubt). -
ranyl at 20:18 PM on 8 December 2011Schmittner et al. (2011) on Climate Sensitivity - the Good, the Bad, and the Ugly
Can someone explain how the Pliocene was 3-5C hotter with a CO2 conc. of 350ppm and a cooler sun if CS isn't higher than 3oC? -
Tom Curtis at 17:37 PM on 8 December 20112nd law of thermodynamics contradicts greenhouse theory
Fred Staples @1146, here is an example of the simple multilayer slab model you keep referring to. Note once again that it is not the model of the greenhouse effect used by climate scientists in making their predictions. It is only an instructional model used to teach basic concepts. SW-down LW-up LW-down Net up Temp TOA (1) 240 240 240 240 255 2 240 480 480 240 303 3 240 720 720 240 335 Surf(4) xxx 960 xxx 240 360 The model shows incoming Short wave (SW) radiation of 240 W/m^2, and has three layers of atmosphere plus the surface. Emissivity of 1 is assumed for all layers and the surface. Temperature is given in degrees Kelvin. The first and most important thing to note is that the net upwelling radiation at each level equals the SW radiation going down at that level. Therefore energy is conserved. The second important thing to notice is that at each level the net energy flow is from a hotter to a colder zone. The initial flow is from the sun, while subsequent flows are from the hotter surface to cooler layers of the atmosphere. That means that entropy increases with each energy flow. Consequently there is no violation of the second law of thermodynamics in this model. Further, and very importantly, we know that there is no violation of the second law of thermodynamics in this theory from every day experience. Anybody who cooks knows that by putting a cold lid on a hot pot, the contents of the pot will gain more heat. Most people will now know that if you put a low emissivity film on the outside of your glass windows on a snowy winter, the house will become warmer even though the glass is colder than the room. Examples are common place. It is only be carefully not thinking about the physics of everyday phenomenon that you can make the confused claims you are making. -
Tom Curtis at 17:02 PM on 8 December 2011Not so Permanent Permafrost
Charlie A @37, you have been doing far more than inquiring about a possible error in the description of the graph. I have been ignoring this series of comments as more or less irrelevant, until I saw your claim at 28 that:"1. I could not find any graph in that paper that has the same data as shown in your Figure 2. Your/WWF's figure 2 does have some similarity to the upper bound of the ensemble of models, but it doesn't really match even that."
On investigation I found that to be a direct falsehood, as was easily shown by publishing figure 1 d of Lawrence and Slater, 2005. Earlier you had purported that the data was from the WWF, ignoring their direct reference to the source of the data. Had you in your initial post merely followed the data trail back (to mouse clicks and a google search), then pointed out that in the original source, the 20th century data is reconstructed from a model, the error would have been corrected quickly and without fuss. Instead you have made the primary issue the source of the data, requiring an inquiry to the WWF and a delay for the response. On being advised of that delay, you made further fuss about the lack of information about the source, even though you knew inquiries where being made. All in all, your responses have given every appearance of an attempt to inflate the significance of this issue rather than to correct the error. What you are missing in your attempt to blow up the issue is that inquiries take time, and that the author of the post is not online at SkS everyday. Indeed, to my knowledge his last comment was over a week ago. Some people have lives outside of SkS. I have no doubt that when Agnostic is next online at SkS for more than a brief moment, he will correct the sole error in question, by substituting the word "modeled" for the word "actual". He may even have time to update the graph to that from Lawrence et al, 2011. In the meantime some patience from you would not be out of order. Unless, of course, you want us to apply your standard to you and interpret the direct falsehood quoted earlier in this post, not as an error, but as a deliberate lie. -
skywatcher at 16:31 PM on 8 December 2011Not so Permanent Permafrost
Charlie A, why don't you spend your time looking for the provenance of the great many more egregious errors in data and interpretation that can be found in articles on climate science from the supposedly "skeptical" community? Not only are these errors easy to spot, they are also all-too-regularly significant enough to demolish the arguments made by the so-called 'skeptics'. Nothing you have written here alters the point or the outcome of the above post (Tom Curtis' 5th note in #36). Try a similarly skeptical approach with some of the fare served up elsewhere on the Intertubes... -
Charlie A at 16:10 PM on 8 December 2011Not so Permanent Permafrost
@Tom Curtis #36. I agree with your analysis on the provenance of the data for Figure 2, although it appears the WWF introduced some errors/interpretations when taking the data from Lawrence 2008. Indeed, if you look back at comments #12 and #20 you will see that I long ago came to the conclusion that the original basis of the graph was Lawrence 2008. (-Snip-) The more substantive question, considering the wide variances between modeled permafrost areas in both the 20th century hindcasts and the 21st century projections is "How accurate are the models". I have looked at some length for historical data on permafrost, and unfortunately have not found any more than a couple of decades.Response:[DB] "How accurate are the models"
Off-topic on this thread. See Most Popular Skeptic Argument #6 on the left, Models are unreliable.
You have been warned previously about complaints about moderation and being off-topic. Please note that posting comments here at SkS is a privilege, not a right. This privilege can and will be rescinded if the posting individual continues to treat adherence to the Comments Policy as optional, rather than the mandatory condition of participating in this online forum.
Moderating this site is a tiresome chore, particularly when commentators repeatedly submit offensive, off-topic posts or intentionally misleading comments and graphics or simply make things up. We really appreciate people's cooperation in abiding by the Comments Policy, which is largely responsible for the quality of this site.
Finally, please understand that moderation policies are not open for discussion. If you find yourself incapable of abiding by these common set of rules that everyone else observes, then a change of venues is in the offing.Please take the time to review the policy and ensure future comments are in full compliance with it. Thanks for your understanding and compliance in this matter, as no further warnings shall be given.
-
muoncounter at 15:30 PM on 8 December 2011It's Not About The Hockey Stick!
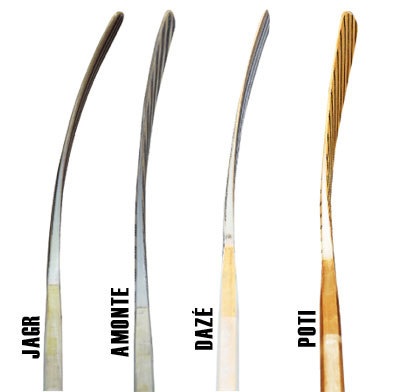
DB: If you turn these hockey sticks 90 degrees, there's an amazing resemblance to those PIOMAS curves. -
Daniel Bailey at 15:17 PM on 8 December 2011It's Not About The Hockey Stick!
@ Glenn Tamblyn Like this recent PIOMAS trend update from Wipneus: (click to enlarge)
-
muoncounter at 15:16 PM on 8 December 2011Separating signal and noise in climate warming
Philippe#27: "short term "trends"" Foster and Rahmstorf 2011 (pdf here) make the case for separating the signal from the noise in a stunningly clear presentation.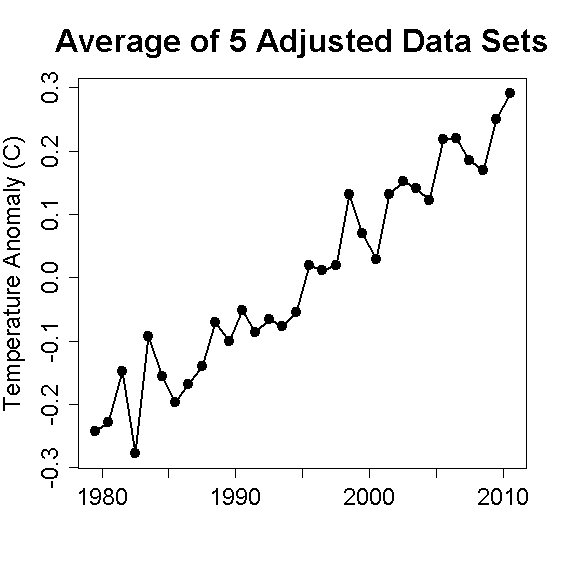 -- Foster and Rahmstorf 2011, Figure 8
More to your comment, the warming rates F and R show stabilize when the start year for calculating the trend gets back to 1990 or so (their Figure 6). That says very clearly:
-- The warming signal is present - and has low uncertainty - with 20 or more years of data.
-- Any 'change in trend' (or 'hiatus' for that matter) based solely on a short time period (like a decade) is a statement with low certainty, as it is based on a time interval too short to eliminate the noise.
-- There is thus no basis for saying that warming has stopped, slowed or changed course.
All five data sets show statistically significant warming even for the time span from 2000 to the present.
-- Foster and Rahmstorf 2011, Figure 8
More to your comment, the warming rates F and R show stabilize when the start year for calculating the trend gets back to 1990 or so (their Figure 6). That says very clearly:
-- The warming signal is present - and has low uncertainty - with 20 or more years of data.
-- Any 'change in trend' (or 'hiatus' for that matter) based solely on a short time period (like a decade) is a statement with low certainty, as it is based on a time interval too short to eliminate the noise.
-- There is thus no basis for saying that warming has stopped, slowed or changed course.
All five data sets show statistically significant warming even for the time span from 2000 to the present.
-
Glenn Tamblyn at 15:05 PM on 8 December 2011It's Not About The Hockey Stick!
DSL @6 One thing that might tip the balance little - it doesn't hit right at home or the economy but it sure might be visual and compelling. An aerial shot of a group of cruise liners, side by side on Sept 15th. At the North Pole. With no ice in sight. If we are lucky - and this is a terrible thing to have to say - the current trends from PIOMass mean we should be there around 2015/16. -
Tom Curtis at 14:43 PM on 8 December 2011Not so Permanent Permafrost
Charlie A @35, on reviewing the information and discussion, I can point out that: 1) The original source for the data in the figure is Lawrence et al, 2008 as indicated by DB inline at 5. 2) Contrary to my 29, the original source of the data shows only one projection for the 21st century, and that projection is for the SRES A1B emissions scenario, so that the original labeling of the graph is correct. That means that the WWF librarian made an error in their advise to agnostic. As a side note, in that WHO reproduced the graph from original data, the very slight differences between the their graph and that of Lawrence et al. are probably due to the in vertical and horizontal scale, and possibly also to smoothing. 3) If you had followed the link in the graphic to the version used by Agnostic, you would have found a link to the WWF report, from which you would have found an endnote (17) detailing the source of the graph. Ergo, all the information above was available for two clicks of a mouse and a google search, or for three clicks of a mouse after DB made his inline comment. 4) All of the information above plus relevant analysis was available from post 13 by Albatross. Your unwillingness to do a simple trace back on the data; and your unwillingness to accept the correct the correct information is noteworthy, and unsurprisingly has led to some frustration with your post from other commentators. Note, that is frustration, not controversy. There is nothing controversial about the fact that graphics should be labelled correctly, or that where possible the best (which often means the most recent) data should be used. 5) The primary use of the figure 2 was in support of the statement:"Lawrence et al (2005) estimate that permafrost covering ~9.5m km2 will have thawed to a depth of 3 meters by 2100. This thawing will make sediments wet, plastic and unstable producing change to the land surface through formation of wetlands, gullies and sinks."
Nothing you have adduced shows this statement to be in anyway inaccurate or misleading. The most that can be said is that the figure should now be revised to ~6.5 km^2 based on an accepted (in Sept 2011), but not yet published paper. 6) As you have obviously looked up and read these papers, comments suggesting that the WWF did not base their graph on a peer reviewed source (despite the clear footnote), or that certain papers did not contain equivalent graphs (when clearly they did), not to mention the inability to follow three mouse clicks, shows a certain obtuseness on your part which is hard to credit. Searching for knowledge is a cooperative endeavour. Perhaps you ought to try that sometime, instead of wasting your time and ours in a desperate search for "gotcha" moments in a futile attempt to ignore the clear implications of available evidence. -
Charlie A at 13:44 PM on 8 December 2011Not so Permanent Permafrost
#33 inline moderator comment by DB "Eyecrometers lack scientific accuracy. FYI." My eyecrometer is sufficiently accurate that I am able to see the difference between "SRES A1b" on the WWF/SkS Figure 2, and the SRES A2 and B2 labels on Lawrence and Slater 2005 (see graph posted by Tom Curtis in comment #29. OTOH, Lawrence 2008 ran simulations using A1B, and the WWF/SkS Figure 2 is similar to (although differing in detail) Figure 5. I did not realize that asking for the source of data for Figure 2 would cause such controversy.Response:[DB] "I did not realize that asking for the source of data for Figure 2 would cause such controversy."
You asked a fair question and were given a fair answer. No controversy at all.
-
Steve L at 13:38 PM on 8 December 2011It's Not About The Hockey Stick!
I love Richard Alley videos! He kind of squeaks in a way that superbly expresses an exasperation with which I identify. But I'm a scientist. For people who aren't scientists, maybe there are other voices that might be able to sell the message more effectively. I'd like to see an experiment done -- get James Earl Jones or, uh, I dunno ... a variety of great speaking voices and see if this has an effect on how the message is received. There's a reason commercial interests use spokespeople rather than company directors (who should know more about whatever topic it is) to sell goods. Results of this experiment could be appended to the next edition of the Debunking Handbook. -
Charlie A at 13:23 PM on 8 December 2011Not so Permanent Permafrost
@Daniel Bailey #31 - a figure that might be even more relevant is Figure 13. There is a known warm bias of about 3 degrees Celsius in the ground temps generated by the CCSM4 20th century simulation. Figure 13 shows one model run of the CCSM4 model both with and without bias adjustment. Caption: "Figure 13: Time series of Northern Hemisphere near-surface permafrost extent for a single CCSM4 20th century and RCP8.5 (solid lines) and RCP2.6 (dashed lines) ensemble member and for offline CLM4 simulations forced with climate bias corrected data from the same CCSM4 simulation (see text for details)."
Note that either with or without the bias correction, these latest simulations are both significantly different than the 20th century permafrost areas of Figure 2. The projections are also significantly different, even for the RCP8.5, which corresponds to
It would be interesting to compare these various simulations with the best guess on actual permafrost area. Unfortunately, although I have found some ALT data for Russia from 1930-1990 I have been unable to find any time series for permafrost area.
It is unclear to me how the models have been validated. As noted above, a comparison of simulated vs actual borehole temperatures for one specific decade shows a warm bias of about 3 C by the latest model.
Caption: "Figure 13: Time series of Northern Hemisphere near-surface permafrost extent for a single CCSM4 20th century and RCP8.5 (solid lines) and RCP2.6 (dashed lines) ensemble member and for offline CLM4 simulations forced with climate bias corrected data from the same CCSM4 simulation (see text for details)."
Note that either with or without the bias correction, these latest simulations are both significantly different than the 20th century permafrost areas of Figure 2. The projections are also significantly different, even for the RCP8.5, which corresponds to
It would be interesting to compare these various simulations with the best guess on actual permafrost area. Unfortunately, although I have found some ALT data for Russia from 1930-1990 I have been unable to find any time series for permafrost area.
It is unclear to me how the models have been validated. As noted above, a comparison of simulated vs actual borehole temperatures for one specific decade shows a warm bias of about 3 C by the latest model.
-
Charlie A at 12:47 PM on 8 December 2011Not so Permanent Permafrost
#30 Albatross says "Charlie A has been told several times on this thread that the data are based on model data." Other commenters have agreed with me that Figure 2 appears to be the output of a simulation, but the author does not appear to agree, since Figure 2 caption still claims that it shows actual observed permafrost areas for the 20th century. The author now agrees that FIgure 2 of this article was generated by WWF, but unfortunately it is still not clear what data WWF used. Although Agnostic reports that WWF told him that WWF generated the graphic based upon Lawrence and Slater 2005, even a cursory comparison shows that this is incorrect. ------------- As I said back in comment #20 "My initial interest was caught by the strange variations in the "actual" near-surface permafrost graph of Figure 2 in the early 20th century, and my initial comment, #5, was about this oddity. This has become a moot point since it has become clear that the data is not what the SkS article claims it is -- "actual"." (-snip-)Response:[DB] "unfortunately it is still not clear what data WWF used"
What part of
“we used the data from Lawrence & Slater, 2005, but created our own figures directly from the data, rather than reproducing the figures from the paper.”
did you not read or understand?
"even a cursory comparison shows that this is incorrect"
Eyecrometers lack scientific accuracy. FYI.
"This has become a moot point since it has become clear that the data is not what the SkS article claims it is"
Actually, it has become moot due to being superceded by the graph from Lawrence et al 2011, which you appear to have not yet read either.
Tedious moderator trolling snipped.
-
Brian Purdue at 12:33 PM on 8 December 2011The Monckton Maneuver
It bets the Monty Python Flying Circus denialism http://www.youtube.com/watch?v=KO1T7b07I7E -
John Hartz at 11:04 AM on 8 December 20112011 AGU Conference Day One
If you are not already aware, Monckton and his cronies dropped into Durban -- quite literally dropped in. See for yourself by going to "The Sky Is Falling! Climate Deniers Parachute Into COP17" posted today on DeSmog Blog. Click here to access. -
John Hartz at 11:02 AM on 8 December 20112011 AGU Conference Day One
Te scientific community had better wake up and smell the roses then. It's not wise to let policymakers deal with climate issues on their own. -
John Hartz at 10:10 AM on 8 December 2011The Monckton Maneuver
The Monckton Maneuver has now become the Monckton Flying Circus -- literally! See for yourself by going to "The Sky Is Falling! Climate Deniers Parachute Into COP17" posted today on DeSmog Blog. Click here to access. -
funglestrumpet at 09:21 AM on 8 December 2011The Monckton Maneuver
The problem is that short of a sudden ‘seeing of the light’, the next time Monckton dons his top hat and tails for yet another dance of deception two-step (first you say one thing, then you say the opposite), he will regurgitate the same old tripe that is the hallmark of his presentations, no matter how smart the bow tie (pity it doesn't rotate). Mention was made above of imposing some punishment. That will surely come for Monckton and those like him. There can be no excuse for not knowing the risks we face by not taking the actions that the scientific community are advocating, and the ‘precautionary principle’ is also so well established that people in their position can hardly be unaware of it. Many deniers can be excused (A single visit to WUWT should be enough to convince any decent court that leniency for the majority posting there is sadly wholly appropriate). However, I rather fear that the Moncktons of this world – the leaders of the pack – will be held culpable by the world population at some time in the not too distant future and leniency is the last thing they should get or deserve. Whether that time, and the urgent actions it will spark, will be too late to counter the harm they have already done remains to be seen. One thing I can say is that I would not like to be in their shoes, or the shoes of their descendants, when that time comes. It won’t stop at the level of the individual; whole nations will be judged and video clips, such as the above excellent example will be shown as evidence, especially the one where Monckton is introduced as a leading expert on climate change by an American congressman to fellow members of congress. Whether that judgement will be in some formal court will be decided by who's running the show at the time, and, of course, their behaviour now. One court that will definitely hand down a judgement is the court of public opinion, which will hurt in the only place some of these people understand : their pockets. How ironic that the main motivation for many deniers is the notion that action to combat climate change will hit them in their pockets. -
dana1981 at 08:34 AM on 8 December 20112011 AGU Conference Day One
Not that I'm aware of, John. But one is policy (Durban) while the other is science (AGU). Scientists wouldn't generally attend the former, and policymakers wouldn't generally attend the latter. -
Tsumetai at 08:19 AM on 8 December 2011It's Not About The Hockey Stick!
John: try here. Comments are well worth a read, too. -
John Hartz at 08:11 AM on 8 December 2011It's Not About The Hockey Stick!
Where can I find a crtical review of "The Hockey Stick Illusion: Climategate and the Corruption of Science"? I entered "Montford" into the SkS seach engine and came up with zilch. DeSomg Blog does not have Monford in it's listing of individuals involved in the global warming denial industry. -
John Hartz at 07:41 AM on 8 December 2011It's Not About The Hockey Stick!
A serial climate denial blogger posted the following today about Mann’s graph on the comment thread to the NPR article, “Can 'Carbon Ranching' Offset Emissions In Calif.?” [To access this article/comment thread, click here.] “Some of you really ought to read Andrew W. Montford's "The Hockey Stick Illusion: Climategate and the Corruption of Science" to get a thorough understanding of how the science underlying the totally unproven hypothesis of catastrophic anthropogenic global warming has been manipulated. “The use of bristlecone pine tree rings as temperature proxies, questionable statistical methods and appending instrumental temperatures has been shown to be deliberately misleading.” Statements like the above should not go unchallenged. Unfortunately, it takes a lot of time and effort to patrol the comment threads of media websites like NPR's. In many respects, it is a thankless job, but one that has to be done in my opinion. -
Bob Lacatena at 07:06 AM on 8 December 2011Separating signal and noise in climate warming
26, Philippe, Agreed. Mervhob, Comments on models (but only if supported by references) should be made on this thread:How reliable are climate models?
Response:[DB] "Comments on models (but only if supported by references) should be made on this thread: How reliable are climate models?"
-
Philippe Chantreau at 07:00 AM on 8 December 2011Separating signal and noise in climate warming
On the subject of variability and short term "trends" (an abuse of the word, since short term with trend really makes an oxymoron): http://iopscience.iop.org/1748-9326/6/4/044022 Foster and Rahmstorf refine the statistical methodology to separate short term fluctuations from long term trends. -
Philippe Chantreau at 06:52 AM on 8 December 2011Separating signal and noise in climate warming
I see that mervhob continues to talk about something else than the subject of this thread and continues to throw unspported assertions. Considering the mathematical background he/she suggests having, it would be interesting to have an opinion on the subject of the thread. As for the rest, I am once again pleasantly surprised to see how tolerant SkS moderators are. A very quick search on "The Atlantic Conveyor has been weakening since the 1980s" returned these: http://www.nasa.gov/topics/earth/features/atlantic20100325.html By none other than the denier's favorite ocean guy, Josh Willis. Quote "Combining satellite and float measurements, he found no change in the strength of the circulation overturning from 2002 to 2009. Looking further back with satellite altimeter data alone before the float data were available, Willis found evidence that the circulation had sped up about 20 percent from 1993 to 2009." Not sure if this speeding up has been confirmed by other papers, as I said, this was a quick, straight Google search. There is also Zhang et al for longer term behavior: http://www.agu.org/pubs/crossref/2011/2010JC006812.shtml Meinen et al (2006) and Schott et al (2006) also failed to confirm the results of Bryden et al (2005). Doesn't mean that the slowing could not happen in the future but so far the evidence is not in the litterature. I am not sure what models forecast about that specific feature. I am sure that mervhob's statement was pulled out of you-know-where. I would like now to encourage all to discontinue the OT discussion (I know, I just added to it), as the subject of this thread is actually quite interesting, and should be even more so for someone with math background. -
Alexandre at 06:32 AM on 8 December 2011The Monckton Maneuver
meagain at 05:33 AM on 8 December, 2011 I agree about his influence, or at least about his potential influence. He speaks what a lot of people are eager to hear, and that just raises the importance of an effective commutication of proper information. I'm becoming a big fan of the Debunking Handbook... -
scaddenp at 06:29 AM on 8 December 2011Nils-Axel Mörner is Wrong About Sea Level Rise
TOP - exactly. So Morner rotating the viewpoint so that trendline is horizontal and claiming "no trend" is pure quackery. Why rotate the viewpoint if not to mislead? If you want trend then you use all the data and compute whether it is significant. Not all graphs show trend by that criteria at all (eg cosmic ray flux). I would like satellite going back 1000s of year too but science (and policy) has to be informed by what data is available. Proxy sealevel constructions of 1000 of years show very little sealevel rise till recent times. That has to be what we use. -
John Hartz at 06:29 AM on 8 December 20112011 AGU Conference Day One
Dana: I personally find it a tad disconcerting that the AGU Fall Meeting is being held att he same time as the COP17 meeting in Durban. Has this scheduling conflict been discussed? -
Alexandre at 06:27 AM on 8 December 2011The Monckton Maneuver
Now I've finished watching the second video. Both are highy informative and a thorough exposure of Monckton's empty rethoric. To reach a broader audience, though, I would limit the whole thing to the first 2 minutes or so of the second video. The juxtaposition of Monckton contradicting claims speaks for itself. -
scaddenp at 06:24 AM on 8 December 2011Separating signal and noise in climate warming
Look this site is about discussing the science of climate change. Mervhob should either put up (reference published science to support his/her assertions) or be shut up. -
Bob Lacatena at 06:00 AM on 8 December 20112nd law of thermodynamics contradicts greenhouse theory
1144, Fred Staples, You persistently insist on ignoring the problems in your model. This was pointed out to you in comment 1128, where you were directed to this explanation of how optical thickness, convection, evapotranspiration moderate the radiative effects of greenhouse gases, and result in a modeled outcome that very closely mirrors observations. Your own model is incomplete and therefore, while an important first step towards understanding how the real world operates, it is ultimately invalid. As far as this commentary of yours:anecdotal hand waving
Words of wisdom. -
Bob Loblaw at 05:43 AM on 8 December 20112nd law of thermodynamics contradicts greenhouse theory
Fred @ 1144: Something, as G and T say, must be wrong here. What is wrong is that the atmosphere is not opaque, so your multi-layer model has very little to do with reality. As it has very little to do with reality, the conclusions you draw from it also have very little to do with reality. Take a look at the figure I posted in #1143. Pick either side - it doesn't matter which. Left side is a pure radiative model; the right side includes convection. The figure shows two time-dependent progressions for each side. Each time series starts with an initial assumed temperature - one hot, one cold. In each case, over roughly one year of simulated time, the two simulations converge on the same equilibrium, showing that the model's final result does not depend on the initial assumed temperature. Now, think about the case where the initial temperature was hot. In these cases, the simulated energy balance leads to atmospheric cooling - until equilibrium is reached. In particular, note that the coldest section (at equilibrium) is in the middle section of the atmosphere - not the top; not the bottom. And here is the question that I would like you to attempt to answer: based on your understanding of the physics of energy transfer in the atmosphere, please explain how the middle section of the atmosphere is colder than the layers both above and below in the early part of the simulation, but continues to cool. How is is losing more energy than it gains? It may be easier to focus on the left side - the pure radiative transfer model - but the same answer applies to both panels. Alternatively, if you like looking at the two simulations that start "cold", and warm to equilibrium, ask yourself: why does the middle section stop warming before it reaches the temperature of the air below it or above it? Keep in mind that although the graphs are for a model simulation, not reality, the model is a good representation of what reality would do, and the final equilibrium result from the model is an excellent representation of the real global mean temperature profile. The reason why the model behaves this way is because that is also the way the real atmosphere works. I personally know the answer to the question that I am asking, but I'd like to see what you think it is before I explain it. Feel free to ask additional questions. -
meagain at 05:40 AM on 8 December 2011Climate Solutions by Daniel Bailey
My top tip on reducing your household heating bills... Hot water bottle. -
meagain at 05:33 AM on 8 December 2011The Monckton Maneuver
(This may be slightly political, please feel free to delete if it violates the policy, but...) Monckton may be a clown, but he may well be about to become an influential clown. Within the UK, some time before there was any climate sceptic lobby, we had a load of Euro-sceptics - nationalists on the right wing of the Conservative party. Some time ago, a fringe of these broke off to form the UK Independence Party (UKIP). Monckton does have influence within UKIP. AFAIK he claims to be their Head of Policy, which is slightly more credible than his claim to be member of the House of Lords. To judge by my reading of the right-wing UK press, this UKIP mob are currently gaining a lot of popularity due to the current Eurozone financial mess. -
TOP at 05:08 AM on 8 December 2011Nils-Axel Mörner is Wrong About Sea Level Rise
@scaddenp Almost all graphs show some kind of trend. That's a meaningless question. If you asked me to use the data in the graph from 1993 to 2006 to predict 2011 I would say it over predicted and therefore shows a downtrend. If you asked me to use the data from 1993 to 1997 to predict following years I would say there is a serious up trend. I would really like to see the satellite data going back a few thousand years or so.Moderator Response: [John Hartz] The satellite data going back a few thousand years ago remains classified and unaccessible to climate scientists. All FOIA requests for this data have been summarily rejected by the CIA. -
Bob Loblaw at 05:02 AM on 8 December 2011Nils-Axel Mörner is Wrong About Sea Level Rise
Thanks for the keyboard suggestions, gentlepeople. Alas, I usually post comments from a linux system, using KDE as the window management software. Haven't played around much with keyboard settings on it - just set up a new system a couple of months ago (although I've been using linux for about 15 years, now). -
Composer99 at 04:58 AM on 8 December 2011Separating signal and noise in climate warming
mervhob: You are entitled to your opinion regarding climate models. You are not entitled to have your opinion taken seriously if you are not going to substantiate it. Your posts on this thread thus far have consisted of a great many unsupported assertions and no small amount of contempt for the researchers working on climate models (including their continual improvement). Without your providing calculations or citations to support your claims, on what basis should interested laymen such as myself consider any of your criticisms valid?
Prev 1364 1365 1366 1367 1368 1369 1370 1371 1372 1373 1374 1375 1376 1377 1378 1379 Next


