


 Arguments


Recent Comments
Prev 1369 1370 1371 1372 1373 1374 1375 1376 1377 1378 1379 1380 1381 1382 1383 1384 Next
Comments 68801 to 68850:
-
dana1981 at 12:19 PM on 3 December 2011Temporarily Frozen Planet, Permanently Frozen Objectivity
Nicholas and DB - the final frame in the animated GIF shows global sea ice extent. -
Tom Curtis at 11:23 AM on 3 December 2011It's the sun
Sphaerica @944, and interesting if vague set of rainfall hindcasts/forcasts for Australia. As noted in the text, the hindcast of 1982 failed emphatically. What is more, the purported explanation of the failure (the intensity of the cycle) sits uncomfortably with predicted "minor cycle". How catastrophically the hindcast failed is seen below: Further, the 1991-1993 predictions also fail as a prediction for Australia (as opposed to Victoria), lining up as it does with the 1991 to 1995 drought:
"By late 1991/92, very dry conditions were developing over parts of eastern Australia, though the southeast had some very wet spells and flooding in the winter of 1991 and summer of 1991/92. The 1991/92 Wet season failed over most of northern Australia -it was the driest Wet season on record in the Northern Territory. Generally dry conditions persisted through the first half of 1992. But between late 1992 and late 1993, El Niño conditions waned, waxed, then waned again, with heavy rain and flooding over southeastern Australia during the two waning phases. Over Queensland, however, the drought continued unabated through this period, and extended south over eastern New South Wales, setting the scene for disastrous bushfires in January 1994."
Indeed, looking at a chart of Australian rainfall, it is very hard to see any evidence of Gaddes' cycles at all: In more detail, here are the years covered by the predictions:
1978 wet 525.6 mm
1979 dry 455.6 mm
1980 np 433.0 mm
1981 dry 535.1 mm
1982 wet 421.4 mm
1983 dry 499.2 mm
1984 wet 555.2 mm
1985 dry 398.8 mm
1986 wet 391.9 mm
1987 wet 453.4 mm
1988 dry 459.8 mm
1989 wet 483.7 mm
1991 wet 469.2 mm
1990 dry 417.6 mm
1992 dry 452.4 mm
1993 wet 499.3 mm
The mean over that period is 465.7. I have indicated wet years under the mean, and dry years over the mean by bolding. As can be seen, by this 1/3rd of predictions are false, and some by very large margins. (The probability is slightly worse if 1980 was supposed to be a wet year, as is likely.) Assuming all years where predictions, the probability of achieving that result by chance was 9.2%, so the results are not statistically significant. Given that at least half the results are retrodictions, the performance is singularly unimpressive.
In more detail, here are the years covered by the predictions:
1978 wet 525.6 mm
1979 dry 455.6 mm
1980 np 433.0 mm
1981 dry 535.1 mm
1982 wet 421.4 mm
1983 dry 499.2 mm
1984 wet 555.2 mm
1985 dry 398.8 mm
1986 wet 391.9 mm
1987 wet 453.4 mm
1988 dry 459.8 mm
1989 wet 483.7 mm
1991 wet 469.2 mm
1990 dry 417.6 mm
1992 dry 452.4 mm
1993 wet 499.3 mm
The mean over that period is 465.7. I have indicated wet years under the mean, and dry years over the mean by bolding. As can be seen, by this 1/3rd of predictions are false, and some by very large margins. (The probability is slightly worse if 1980 was supposed to be a wet year, as is likely.) Assuming all years where predictions, the probability of achieving that result by chance was 9.2%, so the results are not statistically significant. Given that at least half the results are retrodictions, the performance is singularly unimpressive.
-
nigelj at 11:05 AM on 3 December 2011Temporarily Frozen Planet, Permanently Frozen Objectivity
Cornelius Breadbasket #1 You inquire why are conservatives so sceptical about climate change? It may be business links or maybe its related to the fact that conservatism is by its very nature opposed to change. So climate change and society changing to deal with it are both resisted. -
Nicholas Berini at 10:44 AM on 3 December 2011Temporarily Frozen Planet, Permanently Frozen Objectivity
I think the changing graphics are great, but I would love to see an area chart of the sea ice extent gained in antarctica vs. that lost in the arctic (similar to the "where is the heat going - the oceans" figure). Maybe this is accomplished more simply as a bar graph of "net ice extent change since 1979" - antarctic (small positive), artcic (large negative), global (larger negative). Great Post! -
Tom Dayton at 10:32 AM on 3 December 2011SkS public talks in Canada and AGU, San Francisco
It's unlikely I'll be able to attend the AGU conference this year, but I'd like to at least meet John and other SkSers for a beer in San Fran. I suggest The Monk's Kettle, but I'm open to other suggestions. -
NewYorkJ at 10:08 AM on 3 December 2011SkS public talks in Canada and AGU, San Francisco
For those who aren't attending these events, useful would be SkS summary writeups for these and other climate science presentations. The webcasts help, but there don't seem to be many of these. These events go largely ignored among the media (some silly Heartland Institute "conference" gets more coverage despite being orders of magnitude smaller and less credible) so there's a great opportunity to communicate climate science findings to the public. -
shoyemore at 09:39 AM on 3 December 2011Temporarily Frozen Planet, Permanently Frozen Objectivity
Just saw the Grand Old Man of natural history broadcasting, David Attenborough, interviewed on the BBC 10 o'clock news. He was clearly concerned, said the evidence for climate change was "incontrovertible", and that the changes "could be catastrophic". When asked about the dangers of being alarmist, he answered in a pained sort of voice "I try not to be". Apparently, the show on BBC next Tuesday is the one not being shown in the US, and is very much a personal statement by Attenborough. Sad that American viewers will not see this because the network magnates are chickensh*t scared of losing advertising revenue - that is the only reason I can think of for not broadcasting what should be the crown jewel of the series. -
Don Gaddes at 09:34 AM on 3 December 2011It's the sun
For muoncounter(943) The daily Rotation Rate of the Earth is included in the Ratios Principle equation as No. 1 Constant (Earth Period) For DB [Response] Yes, the Seasons (Obliquity) are included in the Equation as No.2 Constant. If the Forecasts (Past and Future) are proven to have veracity, then I am obviously not 'Pushing Failure.' -
Dibble at 08:33 AM on 3 December 2011Temporarily Frozen Planet, Permanently Frozen Objectivity
@7"The GWPF have dubious and oft refuted people like Ross McKitrick, Plimer, Happer and Carter on their advisory council. Say no more...they are not interested in science at all but instead political and ideological spin." Not forgetting the politcal / sports scientist (and equally refuted), Benny Peiser -
Paul D at 07:53 AM on 3 December 2011Temporarily Frozen Planet, Permanently Frozen Objectivity
Attenborough interview about the Frozen Planet series and climate change. I think it should work outside the UK: http://www.bbc.co.uk/news/science-environment-15994284 -
John Hartz at 07:52 AM on 3 December 2011Congressional Climate Briefing - The End of Climate Skepticism?
Nearly two-thirds of moderate or liberal Republicans believe there is solid evidence for global warming, Pew poll finds Source: “Changing climate of Republican opinion doesn't agree with Tea Party” Th Guardian (UK), Dec 2, 2011 To access the article, click here. -
Composer99 at 07:46 AM on 3 December 20112011: World’s 10th warmest year, warmest year with La Niña event, lowest Arctic sea ice volume
One good way of looking at it is this, Tjall: As of the start of the industrial revolution, the global mean temperature was approximately 6°C higher than during the depths of the previous glacial period. 6°C isn't much (you might notice a temperature shift of that magnitude without it impinging on your comfort), but in terms of global mean temperature it's the difference between ice sheets covering large chunks of continental North America, Europe & Asia and not. Thus, even the <1°C shift since the Industrial Revolution can cause (and has already caused) large-scale changes & disruptions. Hence the reason why there is an attempt to get nation-states to agree to prevent global warming greater than 2°C since pre-industrial times. -
michael sweet at 07:21 AM on 3 December 2011Temporarily Frozen Planet, Permanently Frozen Objectivity
How can we work to gether to get the essay on climate ethics published in local mainstream media? -
Albatross at 07:03 AM on 3 December 2011Temporarily Frozen Planet, Permanently Frozen Objectivity
Actually Pete Dunkelberg has posted links to the Manabe paper's here. -
dana1981 at 07:01 AM on 3 December 2011Temporarily Frozen Planet, Permanently Frozen Objectivity
Yes, the GWPF is horrid. They appear to be the ones who originally made the 'hide the decline' accusation about BEST, later parroted by Curry. -
Albatross at 06:51 AM on 3 December 2011Temporarily Frozen Planet, Permanently Frozen Objectivity
Keith @3 and Dana @4, Indeed. Manabe's seminal modelling work in the early nineties predicted this asymmetrical response of the polar regions. Recently Richard Alley hinted that this may be about to change in the near future, but he was not more specific. Lawson works for the disinformation and lobby group GWPF. These charlatans are again playing the trick of accusing others of exactly what you are doing, in this case not being objective. This disingenuous trick of the "skeptics" and those in denial about AGW is getting very tired and old. The GWPF have dubious and oft refuted people like Ross McKitrick, Plimer, Happer and Carter on their advisory council. Say no more...they are not interested in science at all but instead political and ideological spin. -
Pete Dunkelberg at 06:27 AM on 3 December 2011Southern sea ice is increasing
Manabe et al. 1991, 1992 Transient responses of a coupled ocean-atmosphere model to gradual changes of atmospheric CO2. Part I: Annual mean response Transient responses of a coupled ocean-atmosphere model to gradual changes of atmospheric CO2 Part II: Seasonal response Want more? -
John Hartz at 06:12 AM on 3 December 2011Temporarily Frozen Planet, Permanently Frozen Objectivity
Riccardo #5: You're welcome. I highly recommend that SkS obtain permission to repost "An Ethical Analysis of the Climate Change Disinformation Campaign: Is This A New Kind of Assault on Humanity?”. Climate deniers such as Nigel Lawson are indeed skating on very thin moral and legal ice. -
Riccardo at 06:01 AM on 3 December 2011Temporarily Frozen Planet, Permanently Frozen Objectivity
John Hartz thank you for the link. I'd like to quote one more sentence:"We are here today to encourage greater reflection on the moral travesty of the climate change disinformation campaign. We will argue that this campaign is some kind of new assault on humanity."
Greater reflection, indeed. -
dana1981 at 05:56 AM on 3 December 2011Temporarily Frozen Planet, Permanently Frozen Objectivity
Good point keith. I recall a RealClimate post that pointed out that a delayed Antarctic ice response to global warming was predicted by climate models decades ago. I'm not sure why Lawson thinks one has to point out this expected Antarctic result when discussing the Arctic sea ice decline in order to be "objective." To paraphrase The Princess Bride, I do not think that word means what Lawson thinks it means. -
keithpickering at 05:48 AM on 3 December 2011Temporarily Frozen Planet, Permanently Frozen Objectivity
Another important point to make is that the slight rise in Antarctic sea ice is predicted by climate models and is an expected result of a warmer climate. That's because the Southern Ocean is at a lower absolute latitude that the Arctic Ocean, and is outside of the permanent polar high. This means that it's a wet area (a lot of precip) as opposed to a dry area. Increasing global heat drives a more rapid hydrological cycle, and the wet areas get more rain and snow, including the Southern Ocean. The temperature at which ice freezes is determined by the salinity of the sea water, and with more rain and snow the surface waters become fresher and freeze at higher temperatures. Thus more rain and snow makes the sea more likely to freeze, while the warmer temps make the sea less likely to freeze. In the Southern Ocean, these two factors nearly balance out, but not quite. The slight increase of sea ice we observe is the correctly predicted outcome of these opposing forces. It's expected to last another few decades, when increasing temps will win out. -
Bob Lacatena at 05:24 AM on 3 December 2011It's the sun
Don,...the current predilection for temperature fixation is just an attempt to 'prop up' AGW.
You must be kidding. Not only do you want to supplant all of climate science with your own vague, incomplete and unsupported hypothesis, but you even want to supplant the metric that global mean temperature is a good (the best) criterion on which to evaluate global climate, and to instead replace it with total precipitation? Except in your case you have only evaluated this based entirely on a simple binary wet/dry interpretation of rainfall in unspecified areas of Australia alone? Are you serious? I would very strongly suggest that if you want to supplant climate science with your own theories, you begin first by learning more about the theories that you believe are wrong but everyone else accepts, rather than focusing all of your energy on the one theory that you believe and everyone else rejects. Of course, sticking to what you know and blindly pushing it with complete and total dismissal of what other people say is the easy course. It's also unlikely to be remotely effective. You would like everyone (thousands and thousands of scientists) to abandon all of climate science based on hand waving about magnetic fields and pages and pages of this (which, again, simply ties magical cycles to yet-to-be-clarified "wet/dry" measurements of rainfall in Australia): Your paper has been "peer reviewed." Address the issues or accept that you have failed. Continuing to push failure is not advancing science, it's just being a PITA.
-
John Hartz at 05:15 AM on 3 December 2011Temporarily Frozen Planet, Permanently Frozen Objectivity
“An Ethical Analysis of the Climate Change Disinformation Campaign: Is This A New Kind of Assault on Humanity?” is an ethical and moral critique of the climate change disinformation campaign. The critique was presented an event at COP-17 in Durban, South Africa on November 29th 2011. In addition to Donald A. Brown, Associate Professor Environmental Ethics, Science, and Law at Penn State University, a number of philosophers, scientists, and lawyers who work on the ethical dimensions of climate change participated in this event. They included Stephen Gardiner from the University of Washington, Jon Rosales from St. Lawrence University, Katherine Kintzell from the Center for Humans and Nature and the IUCN Environmental Law Commission Ethics Working Group, Kenneth Shockley from the University of Buffalo, and Marilyn Averill from the University of Colorado at Boulder. To access this “must read” report, click here. -
muoncounter at 04:28 AM on 3 December 2011It's the sun
Don Gaddes#941: "I believe we are accompanied on this journey by our Magnetic Field." That is not what geomagnetism folks mean when they speak of 'drift.' Why not include the 'ratios' based on the earth's daily rotation: 360 degrees per day! "Does the Magnetic Field 'drift, undulate, waft or cavort?'" If you base your ideas on magnetic 'drift,' it would be wise to take a serious approach to that concept - beginning with using the word drift as it is understood. -
Rob Honeycutt at 04:17 AM on 3 December 20112011: World’s 10th warmest year, warmest year with La Niña event, lowest Arctic sea ice volume
Tjall... If you are new to climate science this is a very reasonable question. Common sense would tell you that, hey, the temperature can go up and down 5-10C over the course of a single day. What's the big deal if the temperature is 2C warmer? The answer goes a little against common sense and I think is best explained by this diagram: Here. Even 1 or 2C of rise in the global average temperature can have significant impact on extreme events. We are already starting to see these extreme events around the world in terms of 500 and 1000 year weather events, both floods and droughts. There's a lot to learn about this issue and SkS is a good place to find solid information. And remember, you don't even have to take any of the SkS authors word for anything. Every article on this site is fully cited with the relevant published literature. If you get that niggling feeling something doesn't sound right, follow the published science. Ask questions. Be genuinely skeptical. -
Cornelius Breadbasket at 03:42 AM on 3 December 2011Temporarily Frozen Planet, Permanently Frozen Objectivity
I'm a Limey/Pom and quite familiar with Nigel Lawson. Although he is not quite as absurd as Monckton, his attraction to myths is very similar and his politics are never far below the surface. What is it with (C)conservative politicians and climate change? Why is a political tradition linked with conservation and good business based on hard-nosed facts being so misdirected? Is it because they are linked to the businesses that will have to change the most to combat climate change? Excellent article by the way. I'm quite keen on seeing Attenboroughs final Frozen Planet episode distributed as widely as possible. So far the series has been wonderful. -
Riccardo at 02:15 AM on 3 December 2011Climategate 2.0 in Context - Solar Warming
cynicus I understand your point and you're right in the conclusions. Though, you're first graph is not correct. When you look for the trend in a cyclic signal and you have just a few cycles, you need to carefully consider the end-point effect. If you start and end at different phases of the cycle you may get almost anything you want. Here's is an example. -
les at 00:45 AM on 3 December 2011It's the sun
Modirator DB "Now you resort to trolling by argumentarium" regarding "Does the Magnetic Field 'drift, undulate, waft or cavort?' Probably all of the above." I think you are being unfair. This understanding of magnetic fields, along with the above statements regarding gravity, clearly belong in the comments section of the 2nd law thread - just based on the quality of the physics.Response:[DB] Point taken. ;)
-
skept.fr at 00:04 AM on 3 December 2011Economic Growth and Climate Change Part 2 - Sustainable Growth - An Economic Oxymoron?
Tom Curtis : «Otherwise your policy seems like an absurd risk to me » De facto, we are in a no policy situation – at least, no global policy with emission targets, many local efforts in cities or countries. I think perseus article points one of the main barrier to a global policy : a reform that could threat economic growth is unlikely to be adopted. Of course, this is a stupid gamble if a short term growth implies a long term poverty due to fossil depletion and climate externalities. Where we disagree is probably the cost-benefit analysis of climate reforms and their feasability in a sustained growth perspective. Perseus and I doubt that the most ambitious target (450) is compatible with such a growth because : a) empirically, we have no example of a massive decoupling between economic growth and fossil use in the past decades, even a local example (a country that would have achieved growth during 3 ou 4 decades without increasing its emissions in absolute term, and more, that would have significantly decreased these emissions) ; b) mean energy intensity/density or EROEI of renewable energy is for the moment less than fossil energy, except in the most favourable conditions that are not necessarily the most interesting conditions for installed infrastructures of production and consumption (concentration solar plant in a desert may be productive, but few persons live in the desert and far away distribution of this energy increase costs and losses). Look at the figure SPM 5 (p. 14) of IPCC SRREN 2011 . If you defend a global and immediate reform, the important factor is the global and immediate cost of RE, not just some selective and local examples of costs in the best conditions. You see in this figure that there are some substitution opportunities at the same cost, but neither solar electricity nor ocean electricity are of real interest on a global scale, even wind mean cost is a bit over the mean range of fossil cost. South Africa (for example) produces coal, so the coal-based electricity in this country has a very low cost and to choose wind or solar would be unrational and underproductive from a strict economic point of view. Of course, a reform is progressive and we will see the costs' abatments in 2020 or 2030, but it seems untrue to assert that globally, policymakers and economic actors would choose the ideal condition of short term growth if they choose massively RE energy in their current technological productivity. (In fact, if RE energy was really more profitable than fossil energy, they would be fool to ignore it, we are supposed to live in world obsessed by immediate profitability) ; c) relative costs are just one dimension : you must also achieve a total production of the same amount of energy that the fossil ressource you substitute (or you need for development). As we have discussed, there is no realistic plan for a biofuel production that would replace a large share of oil-products in transportation in the next decades, and the total mean RE annual production of 164 IPCC scenarios in 2050 is 248 EJ, just 50% of the actual ~500 EJ, and probably 30% or 40% of the total amount we would need for 2050 in a high economic growth scenario. In spite of these pessimistic observations, I think we need urgently a global climate-energy policy because a business as usual scenario would be far too risky. But no hope for me that the most ambitious policy will be compatible with a sustained economic growth for 7, 8 then 9 billion humans. And I bet these humans will in last resort prefer a 550 ppm perspective than a socio-economic stagnation. At least, this preference will partly depend on the reduction of scientific uncertainties for climate sensitivity and regional projections. -
Don Gaddes at 23:32 PM on 2 December 2011It's the sun
See (921) for my answer to the queries on temperature readings (or lack of them.)The Ratios Principle predicts 'Dry Cycles' not Heat Fluctuations.I suspect the current predilection for temperature fixation is just an attempt to 'prop up' AGW. For the queries on Drift of Magnetic Field. It is my understanding that the Earth revolves around the Sun once every Earth/Solar Year, 360 degrees, 30 degrees/month. I believe we are accompanied on this journey by our Magnetic Field. Does the Magnetic Field 'drift, undulate, waft or cavort?' Probably all of the above. I stand by the 'Ratios Principle' and the methods used to obtain it. Apart from my own observations it should be perfectly simple for anyone to check the veracity of the forecasts from 1976 (or before,)to 2011. KR(939) I appreciate your 'moderate approach' The Metonic cycle of the Moon's Nodes is an important 'Constant' in the Ratios Principle calculation. It appears to affect the severity and duration of 'Dry Cycles.' (see where the Metonic Cycle appears in the Forecast Tables, and accompanying comments.)Perhaps you can use Sphaerica's copy,(apparently he wont be using it any more.) It is now cold and dry in America, 'physically indicating' the predicted passage of the 'Dry Cycle' due to reach Australia in early January 2012.Response:[DB] "Does the Magnetic Field 'drift, undulate, waft or cavort?' Probably all of the above."
Now you resort to trolling by argumentarium. If you honestly cannot understand what you are talking about in this point you must then also summon the intellectual honesty to admit it and then get more knowledge.
"Apart from my own observations it should be perfectly simple for anyone to check the veracity of the forecasts from 1976 (or before,)to 2011."
Eyecrometers do not cut it in science. You must perform statistical significance tests to provide a scientific basis for your claims. You still practition climastrology as a result.
"It appears to affect the severity and duration of 'Dry Cycles.'"
IBID.
"It is now cold and dry in America"
Winter approaches. For many parts of America this means rain, not drought. Or do include the seasons in your collection of semimythical cycles?
Either step it up and provide real scientific evidence (via significance testing) to support your extraordinary claims (which bear the burden of proof of extraordinary evidence to support them) or take your agenda elsewhere. Many "alternatives-to-science" blogs exist that will gladly welcome you.
Evasion struck out.
-
Arkadiusz Semczyszak at 22:32 PM on 2 December 2011Greenhouse Gas Concentrations Continue Climbing
... sorry: “... natural sinks removed 49? Gt C - 9?% ...” - of course ... -
Arkadiusz Semczyszak at 22:24 PM on 2 December 2011Greenhouse Gas Concentrations Continue Climbing
Sorry to reply so late - too much work. #KR 1. Had Keeling began his research 10-20 years ago, probably would not be any doubt ... 2. Many conclusion given by you - as mine (for example, that currently only natural sources are responsible for the increase in concentration of Carbon in the atmosphere) are not mine. I only draw your attention to natural sources C - as it evolved in the twentieth century and now. I leave - The readers - conclusions. I think that we can not exclude the participation of natural resources - particularly permafrost - in the current increases in atmospheric CO2 concentrations - now - not only in the future. Abrupt Permafrost Thaw ...: "Abbott said [of carbon which is still "trapped" in the permafrost]: "There's more organic carbon in northern soils than there is in all living things combined; it's kind of mind boggling." “... around four times more than all the carbon ever emitted by modern human activity and twice as much as is now in the atmosphere, according to the latest estimate.” "... we don't yet know how to incorporate them into climate models," Abbott said." 3. “... a simple mass balance analysis ...” - may get too simple. Of course, accepting paleo - record can be concluded that up to 19? natural sources, the increase, was almost 100% balanced by sinks. According to paleo - record an increase of 1 degree C is maximum 6-7 ppmv of CO2 excess. With at least 500 Gt C of natural emissions - permafrost (years 1910-1950) natural sinks usuwałyby 49? Gt C - 9?%. But the atmosphere is a surplus equal to the size of 50% of our emissions - which shows that the abrupt increase in the size of the source, sinks always respond - but "grow" much slower than the source. In nature, the cases 100% of the balance - in response to the rapid growth of sources (eg, permafrost from 1910 to 1950) there are no ( Khatiwala (2009): “... terrestrial biosphere was a source of CO2 until the 1940s”). Usually it happens this way: this Of course You can say that now sinks remove: all growing sources of natural, and yet - additionally - 50% of our sources. The possibility absorbers of sinks, are therefore greater than the increase in natural sources. But what will be, but if we assume that the sinks remove only a percentage (determined by a mathematical function) increase in all sources - regardless - irrespective of the size of the sources increase? 4. Lower (than at present) the temperature - is a accumulation organic C in permafrost, in the form of practically undegraded. Thawing is rapid release of C. Later: the slow formation of permafrost biomes: wetlands and forests - the re-accumulation of C. That these "slowly" by Zimov (2006). The complicated reactions permafrost have best described here : Wisser ( 2011). We may “not like” NIPCC, but similar conclusion (“slowly” re-accumulation of C) follows from this very large study NIPCC - page 228-230(32-34). 5. Of course, the consequence of my position is to assume that the paleo-data have “drawbacks”: low accuracy in time, smoothing the results, the possibility of underestimation of the size of the former amount of C in the atmosphere. Last possibility is weakly proved (as yet) - I now, moreover discussion on this topic greatly exceed the “framework” of this post. 6. Salby and Spencer - They really confuse: variability with the trend; and draw attention only to the potentially large oceanic source C - completely incompatible to the current: C isotopic changes in the atmosphere and changes in oxygen content. Two months ago I sent - Salby, “few dozen pages” of my remarks ... P.S. I think I replied to most of the comments - by the way - also Sphaerica. -
les at 21:18 PM on 2 December 20112011: World’s 10th warmest year, warmest year with La Niña event, lowest Arctic sea ice volume
Tjall - This is probably a good place to start Positives and negatives of global warming -
Tjall at 21:01 PM on 2 December 20112011: World’s 10th warmest year, warmest year with La Niña event, lowest Arctic sea ice volume
Looking at the first graph I notice that in La Nina year 1989 compared to this La Nina year (2011) it has become around 0.3 degrees warmer (a little less actually). All this over more than 20 years. O my god!! Does this mean we are all gonna die?? No, but seriously, I'm new here. Can someone please explain what all the fuss is about? This can't really be a problem, right? I mean, even when this goes on it means that in 80 years- my son will be 84 then- it will be around 1.5 degrees warmer. In 80 years! I mean, 80 years ago we were using de gracht here in Utrecht as a toilet and riding around on horses. I don't mean to make fun of this, but I just don't get it. Please explain. Someone? regards TjallModerator Response: [DB] Welcome to Skeptical Science! There is an immense amount of reference material discussed here and it can be a bit difficult at first to find an answer to your questions. That's why we recommend that Newcomers, Start Here and then learn The Big Picture.I also recommend watching this video on why CO2 is the biggest climate control knob in Earth's history.
Further general questions can usually be be answered by first using the Search function in the upper left of every Skeptical Science page to see if there is already a post on it (odds are, there is). If you still have questions, use the Search function located in the upper left of every page here at Skeptical Science and post your question on the most pertinent thread.
All pages are live at SkS; many may be currently inactive, however. Posting a question or comment on any will not be missed as regulars here follow the Recent Comments threads, which allows them to see every new comment that gets posted here.
Comments primarily dealing with ideologies are frowned upon here. SkS is on online climate science Forum in which participants can freely discuss the science of climate change and the myths promulgated by those seeking to dissemble. All science is presented in context with links to primary sources so that the active, engaging mind can review any claims made.
Remember to frame your questions in compliance with the Comments Policy and lastly, to use the Preview function below the comment box to ensure that any html tags you're using work properly.
-
cynicus at 19:51 PM on 2 December 2011Climategate 2.0 in Context - Solar Warming
CW pontificates a lot but fails to do the legwork to support his pontification: compare actual temperature to TSI directly. And we'll see why: WoodForTrees allows this comparison nicely and shows -shock, horror-: since approx 1980 solar activity and temperature don't correlate at all. But, ofcourse, this has been noticed by mainstream science a long time ago. TSI vs Temp since 1975Sunspot count vs Temperature since 1880:
-
Tom Curtis at 18:25 PM on 2 December 2011Climategate 2.0 in Context - Solar Warming
Michael Hauber @11, a better idea of mean of Total Solar IRradiance over recent times can be provided by Steinhilber et al's reconstruction of TSI over the Holocene: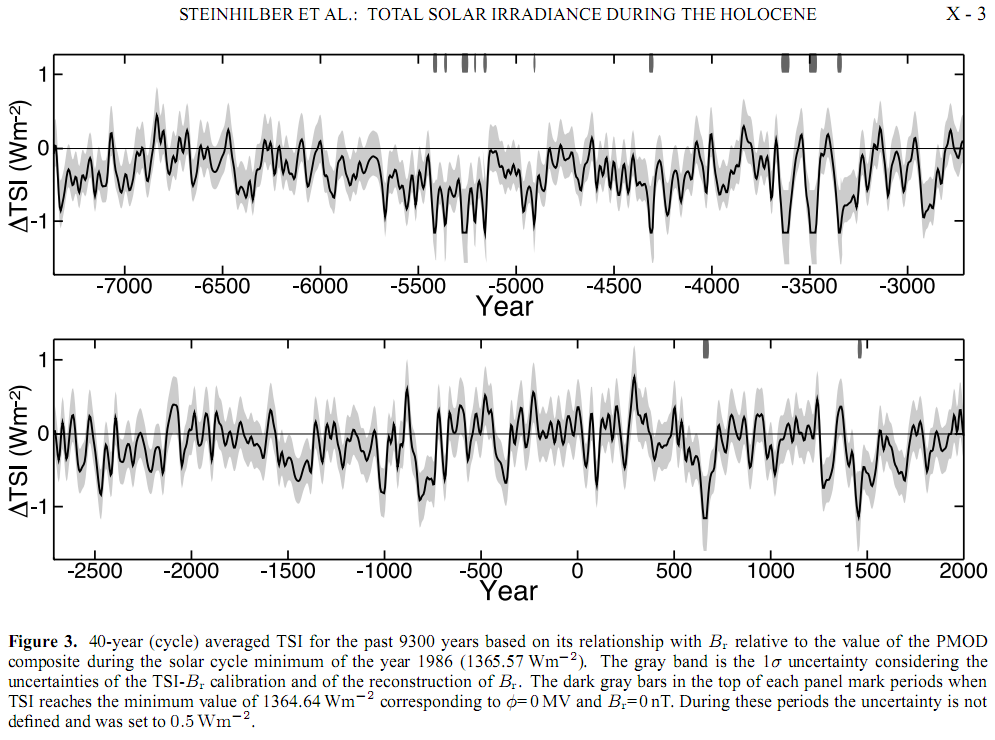 They show a 0.9 W/m^2 change between the Maunder Minimum and the solar minimum of 1986, and a 0.93 W/m^2 difference between 1986 and the lowest values in the record. The highest values are about half that greater than current values, with the mean slightly below late 20th century values. That represents a variation of less than 0.3 W/m^2 in solar forcing from grand maximum to minimum.
-
DrTsk at 17:53 PM on 2 December 20112011: World’s 10th warmest year, warmest year with La Niña event, lowest Arctic sea ice volume
Nice bifurcation. Non-linear stability analysis of the model anyone?? It will be interesting to see the dominant modes. -
muoncounter at 15:36 PM on 2 December 2011Climategate 2.0 in Context - Solar Warming
Tom C: The point was this CW observation Also that solar irradiance appears to be at a century or more high doesn't look so apparent when the last 10 years of data is included. Nor here: --source
-
Michael Hauber at 15:20 PM on 2 December 2011Climategate 2.0 in Context - Solar Warming
"A regression to the mean may be more likely". Certainly speculation, but I wouldn't call it completely unspported, but rather a speculation that is weakly supported by the common sense idea that the average for the last 150 years is the mostly likely true long term average. I see no reason why unsupported speculation is bad. I have a problem with speculation that is dressed up as fact. E.g. 'The IPCC is incompetent because they chose a continuing high solar value for their models' Personally if I was doing the models I'd probably have run models with both a high and low solar forcing to try and further explore the likely upper and lower range of future temperature change. As further speculation I would expect the upper limit would be unchanged, the most likely case would go down a small amount, and the lower limit would go down a bit more. Or perhaps the IPCC know something about the sun that I don't and continuing high solar levels over the next century are more likely than regression to the mean. Well actually I'm sure they know many things I don't about the sun, but rather something that applies specifically to this situation. -
Climategate 2.0 in Context - Solar Warming
ClimateWatcher - It would be worth your while to look at the How would a Solar Grand Minimum affect global warming thread. Story in short: "The most likely impact of a Maunder Minimum by 2100 would be a decrease in global temperature of 0.1°C with a maximum reduction of warming by 0.3°C. Compare this to global warming between 3.7°C ... to 4.5°C". Solar variation is being hugely overwhelmed by greenhouse gas changes. You are, IMO and based upon your posting history, blowing smoke. Again. Why is it, considering what obviously represents considerable investment in searching out information such as these insolation values, that you keep hunting for reasons to reject the influences of greenhouse gases? -
Tom Curtis at 14:21 PM on 2 December 2011Climategate 2.0 in Context - Solar Warming
Muoncounter @6, I assume you are aware that his second graph is the solar forcings as used for projections to 2100 in some group of climate models. Unfortunately ironic (or sarcastic) tone does not come through well on the internet. -
muoncounter at 14:17 PM on 2 December 2011Climategate 2.0 in Context - Solar Warming
DB#6: Ah yes, the picture is vastly different if your data stops in 2000. Based on the 2nd CW graph, it hasn't changed since then. -
Tom Curtis at 14:17 PM on 2 December 2011Economic Growth and Climate Change Part 2 - Sustainable Growth - An Economic Oxymoron?
skept.fr @50, obviously a country by country target would be preferable to a group by group approach. However, I am realistic enough to recognize that a group by group approach is more likely to be negotiated due to political pragmatism (which I believe is best defined as forgetting what you are trying to achieve so that it won't interfere with the possibility of a "successful" outcome). While group 2 nations will require immediate mitigation efforts: 1) Much of that mitigation can be in the development of a small scale distributed energy network for domestic and light industrial needs, and which therefore are not troubled by intermittancy. In that context solar and wind power are already the cheapest options; 2) The west and China, if truly committed to these targets will be massively developing renewable energy infrastructure which will consequently drive down costs very fast (from scale of production if nothing else) making adoption of renewable energy for new infrastructure projects in group 2 nations a minor additional expense (if that). Finally, you keep on saying it is a gamble. Of course it is a gamble. Everything is a gamble because nothing is certain in life. More importantly, facing a world in which climate change has destroyed the Great Barrier Reef and the Amazon Rainforest is a gamble. Simply assuming that food production can keep pace with population growth in such a world is a gamble on a par with Russian Roulette. Unfortunately policy inaction to date has placed us in a position in which any policy response (including inaction) is a gamble. Whatever our policy response, delaying action will make our subsequent policies even more of a gamble. As it happens, pushing for a semi-targeted effort at decarbonization backed by a price on carbon so that we very rapidly decrease carbon intensity is the safest bet in this context. It avoids the excessive risks not to mention the political impossibility (as you will agree) of pushing the world into zero growth as a deliberate policy. It also avoids (or gives us a good chance of avoiding) the worst consequences of climate change. Unfortunately, any other alternative avoids neither the worst consequences of climate change (because their response is too slow) nor the negative growth (due to the consequences of climate change). If you have an alternative policy which avoids crashing through the 2 degree C safety barrier, by all means present it. Otherwise your policy seems like an absurd risk to me. -
scaddenp at 14:01 PM on 2 December 2011Climategate 2.0 in Context - Solar Warming
CW - so your position is that while obviously the sun hasnt been responsible for warming since 1950, we can nevertheless ignore the GHG problem because we can always hope that the sun will reduce output soon. However, how about you compute what the TOA forcing for a change in irradiance from 1650-1995 corresponds to compared to GHG forcing change since pre-industrial? Now suppose the sun suddenly goes quiet but GHG continue to go up. That would be a help, no question. But the GHG stay in the atmosphere so what do you think happens when solar activity returns? -
muoncounter at 13:52 PM on 2 December 2011It's the sun
Sphaerica#936: And strangely enough, there are 29 papers in G.Scholar for "ratios principle." Unfortunately, none of them have anything to do with climate, sun, moon or the price of tea. -
muoncounter at 13:47 PM on 2 December 2011Climategate 2.0 in Context - Solar Warming
Watcher#5: Nice choice of scale for your solar irradiance graph. However, you miss the details evident in the graph in this post: last 50 years - solar down, warming up.Response:[DB] The paternity for that graphic is here.
-
muoncounter at 13:44 PM on 2 December 20112011: World’s 10th warmest year, warmest year with La Niña event, lowest Arctic sea ice volume
Watcher#21: And it is just a coincidence that global glacial mass continues decreasing? Does the self-same Beaufort Gyre extend to Patagonia? Or is it far more likely that the same mechanism - warming - melts both Arctic sea ice and glacial ice? -
skept.fr at 13:42 PM on 2 December 2011Economic Growth and Climate Change Part 2 - Sustainable Growth - An Economic Oxymoron?
Tom : thank you for the reference. I don't know if South Africa citizens and government would appreciate to be in the Group I (immediate cuts) or if Algeria is ready for stabilization and transition (Groupe II). The 45 poorest nations of the world, with less than 0,5 t CO2/capita/y, were not especially in my mind because it seems obvious we have no ethical basis for blocking their growth even if carbon-based. But the ~100 intermediate and emerging countries, often still far poorer than we (OECD) are and without all the basic infrastructures of a developed society, would have for most of them to stabilize their CO2 emissions around 2025 and then to keep their economic growth up while decarbonizing their energy mix… hmm, it's hard for me to imagine this could be done. Of course, a cap and trade CO2 market would favor massive investments transfer from North to South. But basic infrastructures need steel, cement, all sort of raw or transformed materials I don't know how to extract and produce without fossil fuel in such a short period (15 years!), or without high costs contradictory with the need for growth in these countries. And the same is true for transportation without oil (one basis of trade and growth is mobility). But these diverse and vague questions are summarized in Jackson's challenge, to mute very rapidly at a global scale from a 0,7% to a 7% annual carbon intensity gain —without creating social, economic or environmental drawbacks which would dislocate the consensus for climate reforms. A gamble, for sure. -
Tom Curtis at 13:38 PM on 2 December 20112011: World’s 10th warmest year, warmest year with La Niña event, lowest Arctic sea ice volume
Weatherwatcher @21, following your logic we would have to conclude that very cold conditions in the Arctic in the 1910's had nothing to do with the solar minimum of 1910, but rather was the cause of that minimum. Alternatively we could conclude that polar amplification did not start in 1975. With regard to the expected behaviour of sea ice under warming, part of the impact of warming is that currents bringing water into the Arctic are themselves warmer. Consequently we would expect regions sheltered from such currents to have less melting. We would also expect, in general, water adjacent to extent ice sheets, as in the Canadian Archipelago to melt slower. Not being adjacent to ice free water with its increased solar absorption, it itself will not warm as fast. Further, those ice sheets, though extent are still melting, and Canadian rivers further south are now flowing with the water deposited in a confined volume due to the Islands. Both factors contribute to the water in the Canadian Archipelago being fresher than elsewhere in the Arctic (except just North of Siberia). Fresh water freezes more easily than does salt. Finally, all ice in the Arctic melts to some extent in the summer, reducing its thickness. Whether it melts completely if in situ depends on its thickness, which in turn depends on its age. Because ice adjacent to the Canadian archipelago is effectively anchored by the local shore line, it is much older than ice (hence thicker) than ice elsewhere in the Arctic, and hence is not expected to melt away in a single season. Of course, because it does not shift, if it is not melted away in a single season it will be replenished in winter months.
Your "testable hypothesis", therefore, is the product of a shallow and thoughtless analysis of the situation. If you believe otherwise, feel free to show us an AOGCM run of the Arctic melting to an ice free state in which the last surviving ice is at the North Pole rather than in the northern bays and straights of the Canadian Archipelago.
Finally, all ice in the Arctic melts to some extent in the summer, reducing its thickness. Whether it melts completely if in situ depends on its thickness, which in turn depends on its age. Because ice adjacent to the Canadian archipelago is effectively anchored by the local shore line, it is much older than ice (hence thicker) than ice elsewhere in the Arctic, and hence is not expected to melt away in a single season. Of course, because it does not shift, if it is not melted away in a single season it will be replenished in winter months.
Your "testable hypothesis", therefore, is the product of a shallow and thoughtless analysis of the situation. If you believe otherwise, feel free to show us an AOGCM run of the Arctic melting to an ice free state in which the last surviving ice is at the North Pole rather than in the northern bays and straights of the Canadian Archipelago.
-
ClimateWatcher at 13:26 PM on 2 December 2011Climategate 2.0 in Context - Solar Warming
 Available energy to earth, averaged over surface area is subject to: S * ( 1 - a ) / 4, where S is Solar Irradiance, a is albedo and 1/4 is the ratio of the area of the disc through which sunlight passes to irradiate the surface area of the (roughly spherical )earth.
The amount of increased energy from any increase in insolation is considerably less than the reduced amount of energy modeled to leave earth.
Still we should recall that ( neglecting ozone absorption for the moment ) sunshine is largely absorbed at the bottom of the atmosphere while GHG forcing is from a reduction of outgoing at the top of the atmosphere.
Also that solar irradiance appears to be at a century or more high.
Also that whatever the equilibrium energy level was 150 years ago, solar increase alone changed it. Is there a contribution from 150 years of increased sunshine coming back out of the oceans?
Further still, we don't know albedo very well or how it varied in the past or how it varies from year to year.
IPCC models, lacking anything else to go on, use persistence of the recent high levels for the value of insolation:
Available energy to earth, averaged over surface area is subject to: S * ( 1 - a ) / 4, where S is Solar Irradiance, a is albedo and 1/4 is the ratio of the area of the disc through which sunlight passes to irradiate the surface area of the (roughly spherical )earth.
The amount of increased energy from any increase in insolation is considerably less than the reduced amount of energy modeled to leave earth.
Still we should recall that ( neglecting ozone absorption for the moment ) sunshine is largely absorbed at the bottom of the atmosphere while GHG forcing is from a reduction of outgoing at the top of the atmosphere.
Also that solar irradiance appears to be at a century or more high.
Also that whatever the equilibrium energy level was 150 years ago, solar increase alone changed it. Is there a contribution from 150 years of increased sunshine coming back out of the oceans?
Further still, we don't know albedo very well or how it varied in the past or how it varies from year to year.
IPCC models, lacking anything else to go on, use persistence of the recent high levels for the value of insolation:
 http://igloo.atmos.uiuc.edu/IPCC/FORCING/solar.constant.png
A regression to the mean may be more likely.
If that occurs, we will have a case study which should help in evaluating just how significant solar forcing is ( or isn't ).
Response:
http://igloo.atmos.uiuc.edu/IPCC/FORCING/solar.constant.png
A regression to the mean may be more likely.
If that occurs, we will have a case study which should help in evaluating just how significant solar forcing is ( or isn't ).
Response:[DB] "Also that whatever the equilibrium energy level was 150 years ago, solar increase alone changed it."
Straw man. Multiple factors (forcings and feedbacks) account for the changes in global temperatures over that timeframe.
"Further still, we don't know albedo very well or how it varied in the past or how it varies from year to year."
More straw men. I suggest you research more, pontificate less.
"IPCC models, lacking anything else to go on"
IBID. The models you reference are global circulation models, not something concocted by the IPCC. Your statement reveals either a lack of knowledge about them or a willingness to deliberately impart false information.
"A regression to the mean may be more likely."
Unsupported speculation. You have a protracted history on this forum of making unsubstantiated allegations and falsehoods. Cease.
Prev 1369 1370 1371 1372 1373 1374 1375 1376 1377 1378 1379 1380 1381 1382 1383 1384 Next


