


 Arguments


Recent Comments
Prev 1391 1392 1393 1394 1395 1396 1397 1398 1399 1400 1401 1402 1403 1404 1405 1406 Next
Comments 69901 to 69950:
-
Bob Lacatena at 16:04 PM on 18 November 2011Is there a case against human caused global warming in the peer-reviewed literature? Part 2
52, Fred, Thanks for that link. I can't stop laughing! Their credentials and laughable quotes are absolutely precious. It's just amazing to me how well-educated but sadly over-confident people can express such amazing ignorance in a field that is, sadly, outside of their area of expertise but, even more sadly, in which they clearly have not taken the time to achieve even a college level understanding, let alone any right to make such political and unscientific statements. Still laughing. Thanks. That will help me sleep better tonight, knowing that it is really now only the utterly foolish who fail to understand and continue to deny climate change. -
AndrewD at 15:58 PM on 18 November 2011The Debunking Handbook Part 2: The Familiarity Backfire Effect
Nice. But I guess that means you will have to rejig the Myths sidebar?Response: [JC] Hmm, a case of do as I say, not as I do :-) Seriously though, that is a tricky question. How do you invoke and debunk myths without reinforcing them. The left margin could be restructured in the same way that most of the SkS rebuttals are now headlined with open questions rather than the myth. Something to think about. -
Philippe Chantreau at 15:24 PM on 18 November 2011Medieval Warm Period was warmer
"Therefore the observed patterns are most likely the variations in spatial patterns of warming and cooling found in the models, rather than temporal variations in mean global temperature." I find that a better way to understand it indeed. A while ago, I took a look at the litterature on the SHALDRIL cores, of which a chief researcher was Milliken. He finds that "There is no compelling evidence for a Little Ice Age readvance in Maxwell Bay" and also asserts that "the current warming and associated glacial response in the northern Antarctic Peninsula appears to be unprecedented in its synchroneity and widespread impact." So indeed LIA and MWP seem to have been more likely regional than global in nature. -
Philippe Chantreau at 15:15 PM on 18 November 2011Is there a case against human caused global warming in the peer-reviewed literature? Part 2
Marc Morano's garbage is as far as one can get from a compilation of scientific litterature. Anyone willing to be taken on a ride by a political operative deserves what they'll get. Morano is so pathetically illiterate in matters of science that nothing coming from him is worth any consideration. -
muoncounter at 14:50 PM on 18 November 2011Is there a case against human caused global warming in the peer-reviewed literature? Part 2
Fred#52: This post is about a case in peer-reviewed literature, not the efforts of Marc Morano to compile a list of WUWT links, clippings from little known newspapers and fringe, unscientific blog posts. No soap. -
Fred at 14:43 PM on 18 November 2011Is there a case against human caused global warming in the peer-reviewed literature? Part 2
Hi, Other papers where scientists disagree about the dangerous anthropogenic global warming hypothesis can be found at the website for the United States Senate Environment and Public Works Committee (Minority Page). See http://epw.senate.gov/public/index.cfm?FuseAction=Minority.PressReleases&ContentRecord_id=d6d95751-802a-23ad-4496-7ec7e1641f2f Well documented and linked, it lists more than 1000 international scientists. Cheers, FredResponse:To further compliment muoncounter's sage advice below, you need to Meet The Denominator to gain the context that you lack: well-documented and linked, it reveals that even a paltry 1,000+ nay-saying scientists are no match for the millions that lie in the Denominator. If you wish to pursue this, take it there. Cheers, DB.
-
Bern at 14:12 PM on 18 November 2011Lone Star State of Drought
Albatross, muoncounter, thanks for those two comments, very informative. -
adelady at 13:56 PM on 18 November 2011Stratospheric Cooling and Tropospheric Warming - Revised
Mango "... to engage in conversation. I'm not saying you will convince me, I really think the AGW "theory" is flawed, but I'm open to being convinced..." One thing that slipped by me the first time I saw your post. "AGW theory" - no-one yet has asked so I will. Do you realise that there is no AGW theory? What we have is climate science - AGW is merely a predictable sub-set of the general science. The core contributors to the discipline are physics, geology, astronomy, meteorology, chemistry, biology, oceanography, glaciology and other cryology, and a good couple of dozen others. Given what we know from physics of the radiative properties of CO2 and other long-lived gh gases, and the geology of many regions tells us more, we know what to expect when the atmosphere has an increased concentration of ghgs. And the measurements are telling us the physics, geology, chemistry et al are taking us pretty well where we'd expect to end up. How far and how fast we push ourselves along that path is a problem of interpreting and analysing those measurements. But it really is pretty straightforward. (From the comfortable perspective of someone who's never gone to work on a glacier or done super dangerous things in stormy seas or remote jungles just to collect the data we use.) -
Mark Harrigan at 13:01 PM on 18 November 2011David Evans' Understanding of the Climate Goes Cold
Folks, Evans is at it again with a new document dated September 2011. A Link to the pdf can be found here http://www.auscsc.org.au/home/1/limit/6 if you want to copy and paste into a browser or here it is an embedded hyperlink Time for an updated rebuttal please dana? -
Tom Curtis at 12:05 PM on 18 November 2011Medieval Warm Period was warmer
skept.fr @44, earlier in the paper Mann et al wrote:"Both simulations give very similar estimates of the global mean MCA-LIA temperature difference (0.16° and 0.24°C for NCAR and GISS, respectively; the latter is identical to the proxy reconstructed mean surface temperature difference of 0.24°C). The spatial patterns of response for the two models (Fig. 3), however, are quite different, as discussed further below"
The sentence you quoted comes from that discussion. Therefore the observed patterns are most likely the variations in spatial patterns of warming and cooling found in the models, rather than temporal variations in mean global temperature. It should be noted that changes in spatial patterns in temperature can make a small difference in TOA outgoing radiation, and hence there may also be some temporal variation in GMST, but it would be very small relative to the difference in temperature between MWP and LIA, ie, less than 0.06 degrees C (one quarter of the difference between MWP and LIA). -
muoncounter at 11:53 AM on 18 November 2011Lone Star State of Drought
There's some interesting research on these southwestern US droughts at Lamont Doherty. This figure reveals a very conspicuous decrease in drought area over the long term that has reversed during the 20th century.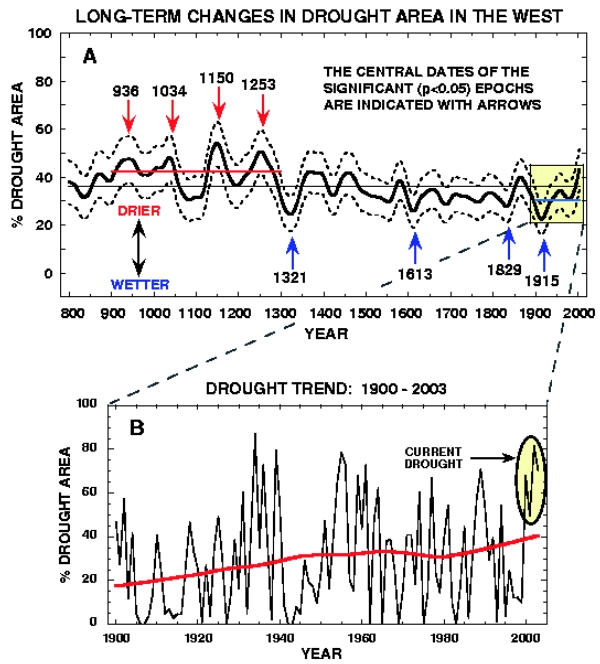 --source
In the detail (lower panel), the red curve shows this increase. Please note this figure dates from 2004, so the current drought is not included in the assessment that 'the current drought is not historically exceptional.'
Rather than focus on individual droughts, which may well be driven by oscillations, this research looks at the long term.
The dynamical causes of imminent subtropical drying appear distinct from the causes of historical North American droughts such as occurred in the 1950s and during the 1930s Dust Bowl. ... In contrast to historical droughts, future drying is not linked to any particular pattern of change in sea surface temperature but seems to be the result of an overall surface warming driven by rising greenhouse gases. Evidence for this is that subtropical drying occurs in atmosphere models alone when they are subjected to uniform increases in surface temperature.
Their short term projections do not look good:
--source
In the detail (lower panel), the red curve shows this increase. Please note this figure dates from 2004, so the current drought is not included in the assessment that 'the current drought is not historically exceptional.'
Rather than focus on individual droughts, which may well be driven by oscillations, this research looks at the long term.
The dynamical causes of imminent subtropical drying appear distinct from the causes of historical North American droughts such as occurred in the 1950s and during the 1930s Dust Bowl. ... In contrast to historical droughts, future drying is not linked to any particular pattern of change in sea surface temperature but seems to be the result of an overall surface warming driven by rising greenhouse gases. Evidence for this is that subtropical drying occurs in atmosphere models alone when they are subjected to uniform increases in surface temperature.
Their short term projections do not look good:
 -- full scale
GFDL's Isaac Held had a hand in this report, offering a great catch phrase:
Warming of the global climate is expected to be accompanied by a reduction in rainfall in the subtropics and an increase in precipitation in subpolar latitudes and some equatorial regions. This pattern can be described in broad terms as the wet getting wetter and the dry getting drier -- emphasis added
Note: here is the original source (Cook et al 2004) for the two-panel figure above.
If the Z-C modeling results hold up, it is plausible that continued warming over the tropical Pacific, whether natural or anthropogenically forced, will promote the development of persistent drought-inducing La Nina–like conditions. Should this situation occur, especially in tandem with midcontinental drying over North America, the epoch of unprecedented aridity revealed in the DAI reconstruction might truly be a harbinger of things to come in the West.
-- full scale
GFDL's Isaac Held had a hand in this report, offering a great catch phrase:
Warming of the global climate is expected to be accompanied by a reduction in rainfall in the subtropics and an increase in precipitation in subpolar latitudes and some equatorial regions. This pattern can be described in broad terms as the wet getting wetter and the dry getting drier -- emphasis added
Note: here is the original source (Cook et al 2004) for the two-panel figure above.
If the Z-C modeling results hold up, it is plausible that continued warming over the tropical Pacific, whether natural or anthropogenically forced, will promote the development of persistent drought-inducing La Nina–like conditions. Should this situation occur, especially in tandem with midcontinental drying over North America, the epoch of unprecedented aridity revealed in the DAI reconstruction might truly be a harbinger of things to come in the West.
-
Tom Curtis at 11:29 AM on 18 November 2011World Energy Outlook 2011: “The door to 2°C is closing”
skept.fr @32, I reiterate my point @18 which I do not feel you have addressed. There is no doubt, IMO, that increased production of biofuels will lead to an increased cost of grains. That is a simple consequence of increased demand in the face of constrained supply. However, logically you cannot split apart the many sources of demand and say one is responsible for the higher prices while others are not. Given that, if you wish to restrict demand for one use of a good to keep prices down, the decision to do so represents a decision that the restricted use is less valuable than all the other uses of the good. In other words, restricting biofuels because of their price impacts on food, while not restricting grain use as animal fodder represents a decision that grain fed animal meat is more valuable than cheap grain for the third world, which in turn is more valuable than access to biofuels. What is more, this is a valuation that stands outside the market and imposes itself on it. While the meta-valuation that biofuel is less valuable than cheap grain for third world food production is one I agree with, the meta-valuation that grain fed beef is more valuable than either cheap grain for the third world, or biofuels is not. Please note that these meta-valuations are ethical, not economic valuations, which can be derived from the market itself. Therefore, allowing that increased production of biofuels increases overall demand for grains, and hence prices, it does not follow that the appropriate policy is to reduce production of biofuels. Rather, if you are going to interfere with market valuations at all, then you are faced with a range of possible policy responses including (but not restricted to): 1) Restricting production of biofuels; 2) Imposing a tax on purchases of grain for animal fodder (thereby decreasing effective demand for animal fodder); 3) Subsidizing purchases of grain for human consumption in the third world, thereby increasing the effective demand for human consumption of grain); or 4) Encouraging production of biofuels from plant material other than grains, especially plant material that can be grown on marginal land for grain production. Of course, various of these can be tried in combination. A tax on animal fodder could be used to fund subsidies on human consumption of grains in the third world. Regardless of the policy chosen, it represents an implicit moral choice. As it is fairly straightforward (to me) that western demand for more marbled meat is of significantly less importance, ethically, than future generations demand for the existence of major eco-systems such as the Amazon, and the Great Barrier Reef (both significantly under threat even with a 2 degree C increase in global temperatures) any response to an increase in demand for grains due to the production of biofuels that restricts itself to restricting biofuels represents a very selfish choice of minimal current convenience (for a select proportion of the world's population) over fundamental needs of the majority of the world's current population and future generations. Until you adress this issue, I have little interest in what (to me) appears like a very shallow analysis of the issue. -
Stephen Baines at 11:09 AM on 18 November 2011Cardinal Pell needs to practise what he preaches on climate change
John...the baby in the bathtub analogy is brilliant. In one image you capture variability on top of trend AND the idea that variability is simply redistribution of heat. It also appeals to family values to boot! -
John Hartz at 11:00 AM on 18 November 2011Extreme Events Increase With Global Warming
Suggested reading: “Monte Carlo versus blocking formations: why attributing heatwaves to climate change is still a gamble,” The Carbon Brief, Oct 27, 2011 To access this article, click here. -
John Hartz at 10:57 AM on 18 November 2011Extreme Events Increase With Global Warming
“Climate change is likely to cause more storms, floods, droughts, heatwaves and other extreme weather events, according to the most authoritative review yet of the effects of global warming. “The Intergovernmental Panel on Climate Change will publish on Friday its first special report on extreme weather, and its relationship to rising greenhouse gas emissions. “The final details are being fought over by governments, as the "summary for policymakers" of the report has to be agreed in full by every nation that chooses to be involved. But the conclusions are expected to be that emissions from human activities are increasing the frequency of extreme weather events. In particular, there are likely to be many more heatwaves, droughts and changes in rainfall patterns.” Source: “IPCC expected to confirm link between climate change and extreme weather,” the Guardian (UK), Nov 17, 2011 To access the entire article, click here. -
Albatross at 10:15 AM on 18 November 2011Lone Star State of Drought
CW @1, Sigh, you are missing the point. I do not think that anyone in the know is entirely blaming the development of the drought and heat wave over the southern great plains on global warming. They are saying that the underlying warming trend made a bad situation worse (i.e., that the event was likely stronger than it would otherwise have been). Dr. Nielsen-Gammon has some interesting posts up on this. It is more than a little disconcerting that we are already seeing a discernible anthropogenic signal so early in the anthropocene. That chart you showed above is the teleconnection for the winter months, the drought peaked during the summer. This is a more appropriate image, for precipitation: [Source]
Note that for JJA there is not a very strong La Nina signal at all for temperature:
[Source]
Note that for JJA there is not a very strong La Nina signal at all for temperature:
 So just as it is wrong to entirely attribute the development and intensity of this drought and heat wave to AGW, it is just as wrong to claim that the intensity of the heat wave and drought were solely the result of La Nina.
Hansen has showed using observations, that globally, the area affecting by marked warm events is on the increase.
So just as it is wrong to entirely attribute the development and intensity of this drought and heat wave to AGW, it is just as wrong to claim that the intensity of the heat wave and drought were solely the result of La Nina.
Hansen has showed using observations, that globally, the area affecting by marked warm events is on the increase.
 Likewise Dai et al. (2004), again using observations, have shown that the areas under the impact of drought or pluvial have increased:
"The global very dry areas, defined as PDSI <-3.0, have more than doubled since the 1970s, with a large jump in the early 1980s due to an ENSO-induced precipitation decrease and a subsequent expansion primarily due to surface warming, while global very wet areas (PDSI >+3.0) declined slightly during the 1980s. Together, the global land areas in either very dry or very wet conditions have increased from ~20% to 38% since 1972, with surface warming as the primary cause after the mid-1980s. These results provide observational evidence for the increasing risk of droughts as anthropogenic global warming progresses and produces both increased temperatures and increased drying."
It is very difficult to argue with such compelling observational evidence. In closing a comment by Dr. Nielsen-Gammon:
"It is plain that heat records should and are increasing, and hot episodes should and are becoming more extreme, as the climate warms. In the specific case of the Texas 2011 heat, natural factors appear to have been so strong that it would have set a record even in the absence of climate warming, but it would almost certainly not have been so intense as to be four sigmas above the long-term average without the contribution of climate warming."
Likewise Dai et al. (2004), again using observations, have shown that the areas under the impact of drought or pluvial have increased:
"The global very dry areas, defined as PDSI <-3.0, have more than doubled since the 1970s, with a large jump in the early 1980s due to an ENSO-induced precipitation decrease and a subsequent expansion primarily due to surface warming, while global very wet areas (PDSI >+3.0) declined slightly during the 1980s. Together, the global land areas in either very dry or very wet conditions have increased from ~20% to 38% since 1972, with surface warming as the primary cause after the mid-1980s. These results provide observational evidence for the increasing risk of droughts as anthropogenic global warming progresses and produces both increased temperatures and increased drying."
It is very difficult to argue with such compelling observational evidence. In closing a comment by Dr. Nielsen-Gammon:
"It is plain that heat records should and are increasing, and hot episodes should and are becoming more extreme, as the climate warms. In the specific case of the Texas 2011 heat, natural factors appear to have been so strong that it would have set a record even in the absence of climate warming, but it would almost certainly not have been so intense as to be four sigmas above the long-term average without the contribution of climate warming."
-
scaddenp at 09:39 AM on 18 November 2011Medieval Warm Period was warmer
Perhaps because of the global patterns apparent, oceanic effects like discussed in Swanson and Tsonis 2009, also discussed here at Realclimate (guest post by Swanson, MAY have been a factor. -
ClimateWatcher at 09:37 AM on 18 November 2011Lone Star State of Drought
So the Texas drought is, as the video identified, strongly correlated with La Nina: But La Nina is also correlated with lower ( than normal years or El Nino years ) global temperatures.
This ( now double dip ) La Nina event is quite independent of the very real warming due to ghgs.
Moderator Response: [Albatross] Fixed image width
But La Nina is also correlated with lower ( than normal years or El Nino years ) global temperatures.
This ( now double dip ) La Nina event is quite independent of the very real warming due to ghgs.
Moderator Response: [Albatross] Fixed image width -
Stratospheric Cooling and Tropospheric Warming - Revised
MangoChutney - "I'm not saying you will convince me, I really think the AGW "theory" is flawed..." With that as an opening statement, I would suggest reading through Newcomers, Start Here and The Big Picture pages, as well as looking at the excellent historical overview contained in The Discovery of Global Warming. As opposed to (for example) selecting one piece of information, arguing that it's problematic or unknowable, and from that claiming the entire theory of AGW, supported by multiple lines of evidence and the physics of the last 150 years, is flawed. There are uncertainties, there are multiple influences (in this case ozone, CO2, water vapor levels, etc.), and it's always important not to oversimplify or overgeneralize from your data... -
Albatross at 08:56 AM on 18 November 2011There's no tropospheric hot spot
Mango, Nobody has asked you to confess your sins, can you please tone down the rhetoric and stop arguing strawmen. IIRC, Skywatcher was asking if you accept that you are wrong about the so-called hot spot in the upper tropical troposphere being purely an anthropogenic signal/signature/fingerprint. So what are you not convinced about in this regard? 1) That the hot spot is not purely an anthropogenic "signal"? It is not a fingerprint of AGW, it is a fingerprint of a warming planet regardless of the cause of the warming. 2) That the "hot spot" upper tropical troposphere not discernible in the observations? Please state your position clearly. This is exactly why I asked you on another thread to list your top three or so primary concerns, to avoid what is happening now. Now concerning the validation of the model simulations of the "hot spot". I suggest that you read the very latest literature on this by Thorne et al. (2011). They conclude that: "It is concluded that there is no reasonable evidence of a fundamental disagreement between tropospheric temperature trends from models and observations when uncertainties in both are treated comprehensively." If that paper in addition to the other excellent papers cited in the main post do not convince you then nothing will I'm afraid. We can provide you with facts, but the rest is up to you. "thing as a graph showing the actual observed data" What is wrong with the data presented by Thorne et al. (2008)? Are you suggesting that the data from multiple agencies and data observation platforms are not trustworthy? And why do both "sides" have to agree on hard, cold facts? You have a very troubling idea of how science works Mango.
-
alan_marshall at 08:46 AM on 18 November 2011Cardinal Pell needs to practise what he preaches on climate change
Mankind's Power to Create and Destroy The title and opening remarks in Cardinal Pell’s speech encapsulate all that is deficient in his worldview. His reference to the Biblical story of the Tower of Babel indicates that, to him, the idea that mankind can change the climate of the Earth is as prideful and far-fetched as the tower builder’s belief they could reach heaven. This idea is profoundly wrong both in terms of the science and theology. As to the science, John has answered that well. As to the theology, Genesis chapter 1 states that man was made "in the image of God", and was given authority to rule (responsibly) over the Earth. This means that man, like God, has the power to create and destroy. Should Cardinal Pell doubt our ability to wreck the environment, we need to look no further than our power to split the atom in the bombs dropped on Hiroshima and Nagasaki. We came perilously close to nuclear Armageddon during the Cuban missile crisis of 1963. I believe by the grace of God, we were saved at that time by President Kennedy, who unlike Cardinal Pell, understood the destructive potential of mankind’s follies. -
skywatcher at 08:12 AM on 18 November 2011There's no tropospheric hot spot
#10 Mango, you like taking the emotive line, but I am after a scientific reasoning as to why you believe that the tropospheric hotspot is specifically an AGW signature. The 'advanced' tab clearly shows that it is by no means unique to AGW, so where do you think this is wrong, and upon what scientific basis? You have, elsewhere, insinuated that data has then been massaged to fit the models (much like Lindzen suggested as discussed above), yet clearly this is not the case. This area of the science is one that has significant uncertainties (as the Thorne graph above shows), yet is not fundamental to the validity of our understanding of the climate system. Lindzen, Monckton and others love to portray otherwise, and I'd hate to see you be taken in by their misinformation. Forget the emotion, or feeling hurt that you've been called out on these statements you've made, as you now have a great chance to present the science for your case. -
Albatross at 06:48 AM on 18 November 2011Stratospheric Cooling and Tropospheric Warming - Revised
Hi Mango @115, "appears to be really worried about why I am here" "or do you not want to engage in civilised conversation" Now you are arguing strawmen, and are also being paranoid. You still have not specified exactly which statements you have made that people are alleging are wrong. instead you now say Posters at the BBC blog are always telling me I'm wrong about everything". Regardless, I and others here, are happy to engage in a cvil scientific discussion with you. What are say your three primary issues/positions that you have, that you have been told are wrong, and which you believe refute or call into question the theory of AGW? We can then address them on the relevant thread. I was under the impression, going by your very first comments on another thread, that they had something to do with temperature trends in the stratosphere no? Specifically, you seem to think that because the stratosphere has not cooled recently that this is a significant flaw in the theory (no quotation remarks required) of AGW. Let us look at the big picture shall we, instead of cherry picked short-term trends that have no statistical significance and which, as such, cannot be used to accept or reject the null hypothesis. [Source]
-
scaddenp at 06:31 AM on 18 November 2011Extreme Events Increase With Global Warming
How about also considering that the effects of blocking patterns are more severe in a warmer world? (ie both more severe drought - higher evaporation rate, and more severe flooding - rain intensities are jigher so a prolonged pattern has greater effect). -
skept.fr at 06:27 AM on 18 November 2011Medieval Warm Period was warmer
I've read the Mann et al 2009 paper linked above and I've a question. The authors compare the overall pattern of change between Medieval Climate Anomaly and Little Ice Age, as reconstructed from proxies and simulated by models. And they conclude : « The observed patterns of change, even when averaged over multicentury intervals, are unlikely to be entirely forced in nature, as there is also a potentially important role for purely internal, natural variability. » Reference to the unforced natural variability is unclear for me. I have often read that such an intrinsic variability cannot create any long term trend. This is a typical Tamino argument : energy is redistributed, not created, by (unforced) natural variability so you do not expect from it any decadal-to-century trend in surface temperature, just a season-to-year signal, up-and-down noise. So, what are Mann et al alluding to when they mention such a « purely internal » variability which could explain part of the averaged multicentury pattern ? -
John Hartz at 06:16 AM on 18 November 2011Tar Sands Impact on Climate Change
“Conventional wisdom has it that the next election will be fought exclusively on the topic of jobs. But President Obama’s announcement last week that he would postpone a decision on the Keystone XL pipeline until after the 2012 election, which may effectively kill the project, makes it clear that other issues will weigh in -- and that, oddly enough, one of them might even be climate change.” Source: “Bill McKibben, Puncturing the Pipeline” TomGram, Nov 15, 2011 To access this insightful analysis, click here. -
MangoChutney at 06:08 AM on 18 November 2011Stratospheric Cooling and Tropospheric Warming - Revised
I'll read through the comments and get back to you, (-snip-) OK, albatross, you read the comments, seemingly everywhere! Posters at the BBC blog are always telling me I'm wrong about everything and they tell me all the answers lie at SkS. I do read the links, even though I suspect the posters at the BBV never read the links from the opposing camp And that's why I'm here - to engage in conversation. I'm not saying you will convince me, I really think the AGW "theory" is flawed, but I'm open to being convinced and I have, on several occasions at the BBC and WUWT, stated that we shouldn't read too much into papers that, for example, show lower climate sensitivity than the IPCC would have us believe, because the papers are still based on models not on empirical data (-snip-)Response:[DB] Welcome to Skeptical Science. Here we focus on the science, not on rhetoric or ideology; that focus immediately separates SkS from the other sites you reference. Please familiarize yourself with the Comments Policy of this site. Note that a continued focus on "camps" or "tribes" detracts from one's credibility here.
Inflammatory snipped.
-
Albatross at 04:16 AM on 18 November 2011Stratospheric Cooling and Tropospheric Warming - Revised
Mango @109, "AGW hypothesis" Actually, it is the theory of AGW. There is a significant/important difference between a "hypothesis" and a "theory". -
Albatross at 04:12 AM on 18 November 2011Stratospheric Cooling and Tropospheric Warming - Revised
Mango, You see this is exactly why I asked my questions @10. I do not recall questioning why you are here. I am glad to here that you are willing to listen to the evidence, but we shall see. Now in order to help you and to focus the discussion I repeat, specifically, what statements have you made that "they" have told you were wrong. You made reference to that in your post @100 when you said: "People tell me i am wrong and point to SkS, so i thought i would ask here" Someone in the interim has replied to one of your other questions that asked after reading a post, but I am more interested in what you have been saying that people claim is wrong, the alleged real reason for you being here. Can we please help you address that? -
skept.fr at 04:08 AM on 18 November 2011World Energy Outlook 2011: “The door to 2°C is closing”
Philippe : I agree, my first words were imprecise. Also, I understand and share your concern, but a larger debate on market-equilibrium models failure, short-termism in economy policy and illusion of infinite exponential growth in a finite planet (Bartlett from Bernard) would probably be off-topic here. (Note that IEA as well as IPCC SRES share a basic assumption of sustained economic growth for coming decades… non compatible for example with a fast fossil depletion.) Furthermore, I also quoted the correlates of energy so as to remind a fundamental fact : whatever your economic system is (capitalist, socialist, feudal, etc.), it’s very unlikely that a low production and consumption of energy will meet the common criteria of human welfare. Bolivia, Yemen or Haiti have an ideal energy consumption per capita for climate stabilization, but few people in developped or emerging countries would consider their HDI as their new ideal. There would be no debate if we can simply give up fossil fuels without any sacrifice, or if climate stabilization was the unique problem of humanity. Look at the Millenium Development Goals of United Nations : most of them are not energy-free in their achievement and no climate objective is sustainable that would worsen on short-term the vulnerability to non-climatic hazards or threats. IEA (and Andy) message is clear : we’re committed to act for climate stabilization, and to act now. So, part of the debate should now deal with the efficiency and security of present energy alternative to fossil fuels ‘other things beeing equal’, because if we condition our climate action to the instauration of a perfect economic and political world system, we will never act ! And similarly, if we choose the worst solutions revealing their negative side-effects for other human needs or concerns, a long-term policy will be very difficult to maintain. On biofuel in their current generation, I think there are all sort of reasons to consider they may be a local and partial solution (eg Brazilian way if enviromentally constrained), but to doubt and even to fear their global extension to the detriment of agricultural use. Most studies do find an influence on crops price, so we cannot just pick those which don't so as to conclude there is no risk at all. (Thereafter, a quite devastative assessment of biofuel by International Energy Forum, including the crop price risk) http://www.ief.org/PDF%20Downloads/Bio-fuels%20Report.pdf Edmh : hem, we're discussing IEA report, 450 scenario and choices in energy policy, not exactly your topic. -
Bob Lacatena at 03:47 AM on 18 November 2011Stratospheric Cooling and Tropospheric Warming - Revised
Mango, short answer... You are wrong in thinking that OLR has increased. There is a net 0.9±0.5 W/m2 imbalance... less, not more. The proper value is, I think, hard to detect reliably considering all of the noise inherent in the system and without better satellite measurements and longer time periods with which to accumulate averages (although Trenberth appears to have done so, and I'd have to look at his paper again to see how)... and sadly satellites keep failing to reach orbit and funding for them is rather dry with the Republican Party in power in the U.S. House. At the same time, however, KR's link to Is the CO2 Effect Saturated as well as this link to Have American Thinker disproven global warming? together show that while the total imbalance is difficult to detect, the expected changes in specific frequencies of OLR -- fingerprints not of any imbalance and warming, but of the effects of CO2 in particular -- are detectable and present. Your argument/question is not invalid. We simply don't have the resources to observationally support or refute the question of which substance, ozone or CO2, is more responsible for the cooling of the stratosphere. But we do have other observations that more than suffice to make us believe that answering that particular question is not all that important. No one really thinks for a minute, nor should they based on the wealth of other evidence, that CO2 is somehow not responsible for both warming the planet and cooling the stratosphere, exactly matching what is predicted by our firm understanding of the physics, but instead that ozone is cooling the stratosphere and some other mysterious, unnamed, unknown force is warming the globe, while CO2 is somehow surprisingly not behaving as all physics expects. So, you see, the proposition that ozone is responsible for cooling the stratosphere requires four huge assumptions:- Ozone is responsible for the cooling of the stratosphere.
- Something else (as yet unknown) is responsible for global warming.
- In spite of our good understanding of the physics and all other observations that support this, CO2 is somehow not warming the globe.
- In spire of our good understanding of the physics and all other observations that support this, CO2 is somehow not cooling the stratosphere.
-
Philippe Chantreau at 03:35 AM on 18 November 2011Eschenbach and McIntyre's BEST Shot at the Surface Temperature Record
I'm going to need aspirin if I see more TLAs... -
CBDunkerson at 03:18 AM on 18 November 2011Stratospheric Cooling and Tropospheric Warming - Revised
Actually, now that I look at the UNrounded values, it seems that Trenberth IS showing the radiative imbalance; 341.3 incoming - 101.9 reflected = 238.5 OLR + 0.9 imbalance The imbalance is labelled 'Net absorbed' at the bottom middle of the diagram. -
CBDunkerson at 03:14 AM on 18 November 2011Stratospheric Cooling and Tropospheric Warming - Revised
Mango, consider Trenberth's energy flow diagram; From this we can see that:
341 W/m^2 incoming solar radiation - 102 W/M^2 reflected solar radiation = 239 W/m^2 OLR
Thus, we can also use this diagram to identify some things which could change the amount of OLR. For instance, an increase in OLR could be due to increased incoming solar radiation (which goes through a semi-regular cycle of about 11 years), increased surface reflection of solar radiation (e.g. due to higher snow coverage than usual), or increased cloud cover causing more atmospheric reflection of solar radiation.
Thus, if you are angling for 'any increase in OLR for any duration disproves AGW' then you are incorrect... many things can and do cause short duration increases in OLR.
Indeed, over the long term greenhouse gases have no impact on OLR. Energy out MUST equal energy in - though not immediately. An increase in greenhouse gases can cause an energy imbalance (note that Trenberth's diagram only depicts balanced flows) by temporarily decreasing the OLR rate until temperature rises enough that OLR becomes balanced again.
From this we can see that:
341 W/m^2 incoming solar radiation - 102 W/M^2 reflected solar radiation = 239 W/m^2 OLR
Thus, we can also use this diagram to identify some things which could change the amount of OLR. For instance, an increase in OLR could be due to increased incoming solar radiation (which goes through a semi-regular cycle of about 11 years), increased surface reflection of solar radiation (e.g. due to higher snow coverage than usual), or increased cloud cover causing more atmospheric reflection of solar radiation.
Thus, if you are angling for 'any increase in OLR for any duration disproves AGW' then you are incorrect... many things can and do cause short duration increases in OLR.
Indeed, over the long term greenhouse gases have no impact on OLR. Energy out MUST equal energy in - though not immediately. An increase in greenhouse gases can cause an energy imbalance (note that Trenberth's diagram only depicts balanced flows) by temporarily decreasing the OLR rate until temperature rises enough that OLR becomes balanced again.
-
MangoChutney at 02:15 AM on 18 November 2011Stratospheric Cooling and Tropospheric Warming - Revised
@Albatross Does it really matter why I'm here? As long as I am prepared to be convinced (and I am prepared), isn't that enough? @All We seem to agree that there could be 2 reasons for the cooling stratosphere, CO2 and / or ozone depletion. The answer seems to be where in the stratosphere the cooling is happening, so do we have the records to show if the cooling affects the whole of the stratosphere or just the upper stratosphere? ----- The AGW hypothesis suggests outgoing longwave radiation should decrease. I've read the post: http://www.skepticalscience.com/American-Thinker-claims-to-have-disproven-global-warming.html which, as the author of the AT article confirms in the comments, shows that OLR has remained constant over the period to 2006 "We have increased the CO2 in the atmosphere about 17% from 1970 to 2006 (328ppm vs. 383ppm) and the OLR appears to have remained constant when you look at the raw data from these three papers". Essentially we have over 30 years of satellite data which seems to show no overall decrease in OLR and possible an overall increase (didn't read all the comments) My understanding is OLR has increased over the full satellite period, but I could be wrong, so: Has OLR slightly decreased, slightly increased, decreased significantly, increased significantly or stayed the same over the satellite period? If OLR has increased to any extent, what are the possible causes? If OLR has increased to any extent does this invalidate the enhanced green house effect hypothesis? TIA -
G.Kaminski at 01:59 AM on 18 November 2011The Debunking Handbook Part 1: The first myth about debunking
John... This looks to be a great resource that I'd like to hand out to a few people. A suggestion, please consider adding permission to the PDF to be duplicated as many commercial copy shops will not allow copies to be made by them without it.Response: [JC] Good idea, thanks for the suggestion. -
Papy at 01:55 AM on 18 November 2011World Energy Outlook 2011: “The door to 2°C is closing”
Or "is worth a thousand words". But Grandma was french. -
Papy at 01:53 AM on 18 November 2011World Energy Outlook 2011: “The door to 2°C is closing”
"A picture is worth than a thousand words" (Grandma et al.) -
MangoChutney at 01:30 AM on 18 November 2011There's no tropospheric hot spot
Is there such a thing as a graph showing the actual observed data - not prepared by Monckton that both sides can agree on? -
MangoChutney at 01:08 AM on 18 November 2011There's no tropospheric hot spot
@9 Can't win, can I? If I ignore links to SkS I'm condemned as a "denier" for not listening to both sides and if I engage with readers of SkS I'm immediately pounced upon to confess my sins. In answer, yes I have read the advanced tab and no I am not convinced, hence the questions -
Bob Lacatena at 01:00 AM on 18 November 2011World Energy Outlook 2011: “The door to 2°C is closing”
Edmh's assertion of 12% is off by a factor of 10. The real increase is 120%, not 12%. Just to clarify things for readers who may fall for the pseudo-logic of non-mathematical declarations that do not include actual math, Edmh's false and unsupported assertions amount to (I assume, since his rambling, emotional assault was so thin on details):- CO2 effects are logarithmic.
- The difference in forcing from the current level of 390 ppm to a doubling of the preindustrial value of 285 ppm to 570 ppm will only represent a 12% increase in forcing over the current level.
∆T = 3•log2 (ppm-CO2/285)
Forcing at 285 ppm is presumed to be our base, that is3•log2(285/285) = 3•log21 = 0˚C
Put into words, a zero increase over the base level of 285 ppm has no effect on mean global temperature. Forcing at 570 ppm (double the original) is a factor of 1, that is3•log2(570/285)= 3•log22 = 3˚C
Put into words, a doubling of CO2 to 570 ppm increases temperatures by 3˚C. Forcing at 390 ppm (where we were a few years ago, we're now at 395 ppm) is 1.36˚C, that is3•log2(390/285) = 3•log21.37 = 3 • 0.454 = 1.36˚C
Put into words, if we stopped right now the global mean temperature would rise, with time, to a point 1.36˚C above the general global mean for the past 5,000 years (but with all of the same natural variation seen in the last 2,000 years of about ±0.3˚C). The difference between a doubling, 3˚C, and the current forcing, 1.36˚, is3 - 1.36 = 1.64 ˚C.
So if we succeed in stopping at a doubling of CO2 (which deniers like Edmh strive to prevent us from doing by arguing against any action at any time) then that added CO2 will increase temperatures 1.64˚C beyond the 1.36˚C to which we have already committed ourselves, or as a percent100 • 1.64 / 1.36 = 120.5%
120.5%. Not 12%. Off by an order of magnitude -- a factor of 10. And, of course, what we really care about is temperatures, not percents. We are rolling the dice and gambling with civilization and hundreds of millions if not billions of lives even if we stop at 2˚C. Policy analysts hope that 2˚C won't be so bad that hundreds of millions die or become refugees, and the resulting burden on the economy and food production doesn't overwhelm us all. And this assumes that climate sensitivity really is only 3˚C per doubling. Current estimates are in the range of 2˚C (increasingly unlikely) to 4.5˚C. So that equation could be 3.5•log2CO2 or 3.8•log2CO2 or 4.5•log2CO2 or worse yet even 5•log2CO2. We are at 1.36˚C. If we want to stop at 2˚C, we need3•log2(X/285)=2.0 log(x/285) = 2.0 / 3 x/285 = 22.0 / 3 x = 285 • 22.0 / 3 = 285 • 1.59 = 452 ppm
450 ppm is a number you may have seen recently. Like in this post (up above, The 450 Scenario). And, of course, even a 120.5% increase in forcing presumes that we are able to stop cold at 570 ppm. -
Glenn Tamblyn at 23:41 PM on 17 November 2011Eschenbach and McIntyre's BEST Shot at the Surface Temperature Record
Carl Thanks for dropping by to SkS and for the kind words (and brickbats). I was the author behind the opinions about STAR, Fu & V&G so let me clarify my intent. This post and my linked post on the satellite data began as a response to a post by Willis Eschenbach at WUWT. We at SkS often find we are trying to correct misinformation about the published science, often of a vague and misleading nature. However in the case of the post by Eschenbach I felt he was making an unreasonably definite staement about the degree of accuracy in the satellite temperature products. Perhaps he intended that as a means of casting too much doubt on the quality of the surface temperature products, presumably as a means of suggesting that they have a 'problem' and UHI is the likely culprit - ignoring the fact that the surface records include corrections for UHI. As you are probably well aware, the various temperature records have become quite politicised, with 'skeptics' using whichever record could seem to bolster their claim, until they switched to another claim. So some years ago, when the UAH & RSS TLT products still showed significant differences the lower UAH product was always the skeptics darling. Since the two products are now giving similar results, this seems to have dropped away. What I wished to do with this post was to highlight to a general audience that there are actually 5 different groups who are or have examined the satellite data and reached somewhat varying results. The work by the Star, Fu & V&G teams appears to be virtually unknown outside scientific circles compared to the UAH/RSS products. I also feel that getting a graph of the weighting functions for the different channels in front of as many eyeballs as possible was an important exercise in informing people that the satellite records aren't as clearcut and black-and-white as they sometimes portrayed in the Blogosphere. To your specific criticisms. The basis for the numbers for Fu are taken from Fu et al 2004, Fig 3. The bar graph highlights the difference between the basic T2 results from both RSS & UAH and the same values when the Fu method was applied to produce their T850-300 result. The key point I wished to convey was how much the Fu method altered the original T2 values. And the figure of around 0.2 comes from this graph. I do point out that this is from earlier data and provide a link to the NOAA site for the current Fu adjusted figures. I have included the weighting function for the Fu product to allow the reader to see the effect it has and that in particular its peak weighting is at essentially the same height as T2. To your comments about the Star data and suggesting a TLT trend from it. I know they don't yet have a TLT product although it is in the works. My purpose here was simply to highlight that since their SNO method is producing a significantly higher TMT value than either RSS or UAH, that a TLT trend when they produce it could well be higher as well. In this respect I was simply trying to suggest what seemed plausible. My comments there were: "So what trend would Zou produce if the TLT calculations were added as well? We can’t know for certain yet, but they must be higher than UAH or RSS simply because their starting point from the TMT trend is so much higher. For a definitive answer we will need to wait for their analysis. But we can possibly make a ballpark estimate. If we simply take the difference between the TMT and TLT values for RSS & UAH as being indicative of how much the TLT processing adds to the underlying TMT trend, and add them to the Zou teams TMT trend we might get some idea". Not intended to be definitive, just suggestive. Hopefully the Star team will be able to produce their TLT product soon so we can gain clarification. The thrust of this post was arguing against the implicit claim made by Eschenbach that particular temperature products were significantly better quality than others wereas it seems from the work of all the teams working on both surface and satellite temperature analyses that you are all converging towards a common point in the analysis but it is not yet completely clear how close each teams results are to that desired definitive result. You are all circling the target and a prettty damn close. And my hat is off to you guys working on the satellite data. That is one hell of a tricky problem, teasing meaning out of such a complex problem. If you have any further comments we would be glad to hear them, or if you were interested in writing a guest post on some of these topics, John Cook would love to hear from you. As an aside, a personal interest of mine, which I included as a speculation at the end of my post, is whether it is possible to apply a method akin to the TLT algoritm or the Fu method to tease out an upper Tropospheric signal without the stratospheric cooling bias. Looking at the weighting functions for TTS and TLS and their corresponding trends from UAH, RSS and Star, it certainly seems plausible that the TTS signal is indicative of a warming upper troposphere combined with a cooling stratosphere. Is such an analysis technically possible and do you know if anyone is planning such a project. I don't know what the scientific utility of such an analysis might be but it would certainly be useful as a data product in the public debate about AGW. -
Tom Curtis at 22:51 PM on 17 November 2011World Energy Outlook 2011: “The door to 2°C is closing”
Edmh @26, first, your "summary" contains multiple denier myths, including the canard that CO2 only contributes 5% of the greenhouse effect. You add a few straight out falsehoods of your own, including a claim that CDIAC disagrees with the IPCC about the temperature effect of increased CO2 concentrations. Indeed, your table of temperature effects is best described as a complete fiction. More troubling is your claim in your spreadsheet that an increase in atmospheric CO2 from 900 to 1000 ppmv would have no effect on temperatures. In fact, given the best estimate of climate sensitivity, it would increase Global Mean Surface Temperature by over 0.4 degrees C. In fact, given reasonable estimates of fossil fuel reserves, we can increase atmospheric CO2 concentrations to levels well beyond 5000 ppmv, with consequent forcings significantly greater than any experienced from the combined effects of solar and CO2 concentration changes since the evolution of the first vertebrate, the common ancestor of all fish, amphibians, reptiles, birds or mammals. Further discussion of this topic can be found where is it on topic, ie, the rebuttal of the denier myth that The CO2 effect is saturated. -
Steve Brown at 22:22 PM on 17 November 2011The Last Interglacial Part Five - A Crystal Ball?
skept.fr #1 - If you are asking if it's possible to infer local as in specific regional temps, then no. Local temps are influenced by numerous factors such as vegetation, proximity to ocean, prevailing wind direction etc. Modelling estimates that the various forcings in play during the Eemian led to a global temp of up to 1 degree C above present day. Arkadiusz Semczyszak #7 - Whilst Rundgren et al (2005) provides an interesting and useful result, it needs to be taken in the context that it's based on a leaf stomatal index proxy with whopping great error bars. -
Arkadiusz Semczyszak at 20:45 PM on 17 November 2011The Last Interglacial Part Five - A Crystal Ball?
MIS 11 - it is worth noting that here too we have serious objections: Rohling et al., 2010.: “MIS-11 is often considered as a potential analogue for future climate development because of relatively similar orbital climate forcing ...” “However, there is an obvious difference in that the current interglacial (Holocene) spans a single insolation maximum (summer, 65°N), while MIS-11 spanned two (weak) astronomical precessiondriven insolation maxima separated by a minor minimum (due to coincidence of a minimum in 400-ky orbital eccentricity with a maximum in the Earth's axial tilt ...” -
Arkadiusz Semczyszak at 20:45 PM on 17 November 2011The Last Interglacial Part Five - A Crystal Ball?
Solar variability. It is worth recalling how much "link to orbital eccentricity," must be amplified to explain the creation (and end) - not just the last - interglacial. Beer et al., 2000.,: “If one computes the global and annual mean of solar forcing caused by the 100 kyr period of eccentricity one gets an amplitude of in the spherical mean. This value is too small to be detected in climate records. But, despite the tiny global forcing value, we can observe the 100 kyr frequency during the last 800 kyr in most paleoclimatic records. The global mean temperature changes between glacial and interglacial periods are large: about 20C for polar (Johnsen et al., 1995) and 5 for tropical regions (Stute et al., 1995).” Beer et al. 2006. : “ Note that the mean annual global insolation changes caused by the eccentricity are very small (<2.5 Wm −2 )” “The existence of feedback mechanisms is illustrated by the discussed glacial-interglacial cycles that are related to a [-all caps snipped-] annual mean change in insolation.” “This implies that the climate system has the potential to respond significantly to even [-all caps snipped] forcings and that this response may depend strongly, not only on the amplitude, but also on the duration of the forcing with potentially larger effects for longer lasting or repeated forcings.”Moderator Response: (Rob P) No more all caps please. You have commented here long enough to know the rules. Further breaches may result in your post being deleted. -
Arkadiusz Semczyszak at 20:44 PM on 17 November 2011The Last Interglacial Part Five - A Crystal Ball?
Atmospheric CO2 during the Last Interglacial was comparable to the pre-industrial Holocene and reasonably stable ... Is worth to draw attention - Rundgren et al., 2005. - on Figure 4 - "raw" data. Together with a possible range of deviations - fluctuations of CO2 are possible (and in a relatively short time) between 160 and c. 350 ppmv CO2. Changes in the Eemian p.CO2 may thus be significantly underestimated. These changes, however, took place in a relatively short period of time: „... centennial to millennial changes were followed by more rapid CO2 oscillations within the range of c. 255–285 ppmv between c. 2700 and 3000 years after the onset of the Eemian.” Of course these changes are smaller and slower than today, but if you can call them: „reasonably stable” ? -
Dikran Marsupial at 20:36 PM on 17 November 2011World Energy Outlook 2011: “The door to 2°C is closing”
Edmh The radiative forcing from CO2 rises only logarithmically with the concentration, so in a sense, yes "effect of CO2 as a Greenhouse gas becomes ever more marginal with concentration". However the point that you are missing is that CO2 concentrations are rising approximately exponentially, which means that CO2 radiative forcing (the effect on the climate) is rising linearly. "From the present position of a atmospheric CO2 concentration of ~390 ppmv, there is only ~12% of the effectiveness of CO2 as a Greenhouse Gas remaining even as emissions increase." This is simply incorrect, logarithmic relationships have no upper limit. -
Edmh at 20:22 PM on 17 November 2011World Energy Outlook 2011: “The door to 2°C is closing”
But the effect of CO2 as a Greenhouse gas becomes ever more marginal with concentration This article is predicated on the suggestion that a temperature rise of +2 degC must not be exceeded Remarkably, IPCC Published reports themselves show that the effective temperature increase caused by growing concentrations of CO2 in the atmosphere radically diminishes with increasing concentrations. The effectiveness of CO2 as a greenhouse gas is well understood in the climate science community to reduce logarithmically as concentrations increase. Although the IPCC accepts that this crucial effect exists, it certainly does not emphasise it. The IPCC does not explain thedevastatingconsequences of this fact in their Summary for Policy Makers, and it thus fails to provide conclusive support for its claim. When it states "Warming of the climate system is unequivocal. Most of the observed increase in global average temperatures since the mid-20th century is very likely due to the observed increase in anthropogenic greenhouse gas concentrations." Thus any unquestioning, policy making reader is unequivocally lead to assume that all increasing CO2 concentrations are progressively more harmful because of their escalating Greenhouse impact. This is not so. From the present position of a atmospheric CO2 concentration of ~390 ppmv, there is only ~12% of the effectiveness of CO2 as a Greenhouse Gas remaining even as emissions increase. These guys miss the crucial point that only 12% of the effectiveness of CO2 as a GHG remains however much the concentration of CO2 increases So however much CO2 is emitted its never going to have that 2degC effect And nobody seems to see this (-snip-) flaw in the alarmist argument see http://diggingintheclay.wordpress.com/2011/09/21/quantifying-co2-mitigation/ read the summary at the endModerator Response:(Rob P) All Caps edited.
[DB] "But the effect of CO2 as a Greenhouse gas becomes ever more marginal with concentration"
Incorrect. Please support this assertion with a link to a reputable source.
"The effectiveness of CO2 as a greenhouse gas is well understood in the climate science community to reduce logarithmically as concentrations increase."
Incorrect. The temperature rise produced by logarithmic increases concentrations of CO2 rises is about 3° C per doubling. Thus, there is no loss of "effectiveness".
"Although the IPCC accepts that this crucial effect exists, it certainly does not emphasise it."
This "crucial" effect does indeed exist, as I have described it. That the IPCC fails to "emphasise it" to your satisfaction is your issue.
"The IPCC does not explain the devastating consequences of this fact in their Summary for Policy Makers, and it thus fails to provide conclusive support for its claim."
IBID. Inflammatory tone struck out.
"Thus any unquestioning, policy making reader is unequivocally lead to assume that all increasing CO2 concentrations are progressively more harmful because of their escalating Greenhouse impact.
This is not so. "Unsupported assumptions, speculations and allegations, on your part.
"From the present position of a atmospheric CO2 concentration of ~390 ppmv, there is only ~12% of the effectiveness of CO2 as a Greenhouse Gas remaining even as emissions increase."
Incorrect, as Dikran points out subsequent to your comment.
"These guys miss the crucial point that only 12% of the effectiveness of CO2 as a GHG remains however much the concentration of CO2 increases"
Repetitively incorrect and IBID.
"So however much CO2 is emitted its never going to have that 2degC effect"
IBID, and spectacularly so.
Inflammatory tone snipped. Less ideological posturing and more emphasis on using citations to reputable sources would begin to lend you credibility. And if you are just another sock puppet of Galloping Camel/Peter Morcombe: you know better than to continue your modus operandi as above.
-
les at 20:14 PM on 17 November 2011How to Avoid the Truth About Climate Change
An excellent talk - give or take the sound quality ;) A clear exposition of arguments always gives one room to think... something occurred to me re the Galileo gambit: Ignoring the appalling revisionist history of the "Galileo Movement", the point that was made clearly in the talk is that Galileo, and the other astronomers of the time, where trying to match their observations to a 'physics' model, not a Physics model. The Physics model awaited Newton and then Einstein for further refinement. Once we had that, the observations made a lot more sense, 'bad' observations could be spotted more easily, the 'killer argument' data defined. There is a parallel, for example, with the "it's natural cycles" brigade and the pure trend / spectrograph analysers. They are doing 'physics' and ignoring the Physics. If, in the spirit of charity, one where to lend Galileo to the truth-challenged, for the moment... Then they are identifying them selves with a methodology which connects assumption to observations without intervening Physics insight. Worth noting that to accomplish this, many people spend much time trying to undermine the Physics / models etc.
Prev 1391 1392 1393 1394 1395 1396 1397 1398 1399 1400 1401 1402 1403 1404 1405 1406 Next


