


 Arguments


Recent Comments
Prev 1400 1401 1402 1403 1404 1405 1406 1407 1408 1409 1410 1411 1412 1413 1414 1415 Next
Comments 70351 to 70400:
-
Kevin C at 23:04 PM on 11 November 2011The Climate Show 21: Carbon, coal and BEST
John: Sorry to spoil the narrative, but the stuff about CRUTEM3 is wrong. Not your fault - the BEST team messed up the comparison again. The problem is that - just with GISS dTs - CRUTEM3 is not a land-area average and therefore not comparable to the others. The problem is discussed in AR4 here. Once they fix this, I expect the final figure to look more like this: .
(I generated corrected CRUTEM3 data by re-averaging the gridded data, but a weighted average of the hemispheric sets should give a very similar result. The graph also depends on the choice of baseline, of course.)
Extrapolation over the arctic is not a factor for CRUTEM3, since it is a land-only product. The residual differences between CRU and the others seem to come down to the following factors:
1. Different (smaller) set of station data (~4k stations).
2. Constant angle grid, leading to undersampling of high latitudes.
3. No extrapolation into empty cells.
I'm looking at these, and my tentative conclusions are as follows:
For CRUTEM3, (1) causes the lack of warming over the last decade. (2) leads to a suppression of the total temperature of the last decade, but doesn't change the picture within the last decade. (3) has a smaller effect than the other two (weak evidence only).
Of course all the differences in the land indices could easily be swamped by the fact the global indices (which are what we are really interested in) use different SST data. I haven't even started looking at that.
.
(I generated corrected CRUTEM3 data by re-averaging the gridded data, but a weighted average of the hemispheric sets should give a very similar result. The graph also depends on the choice of baseline, of course.)
Extrapolation over the arctic is not a factor for CRUTEM3, since it is a land-only product. The residual differences between CRU and the others seem to come down to the following factors:
1. Different (smaller) set of station data (~4k stations).
2. Constant angle grid, leading to undersampling of high latitudes.
3. No extrapolation into empty cells.
I'm looking at these, and my tentative conclusions are as follows:
For CRUTEM3, (1) causes the lack of warming over the last decade. (2) leads to a suppression of the total temperature of the last decade, but doesn't change the picture within the last decade. (3) has a smaller effect than the other two (weak evidence only).
Of course all the differences in the land indices could easily be swamped by the fact the global indices (which are what we are really interested in) use different SST data. I haven't even started looking at that.
-
Bernard J. at 22:29 PM on 11 November 2011Australia Legislates an Emissions Trading Scheme
Focusboy at #24:...fossil fuel provides 100% of Australias [sic] base load and peak load power...
Huh?! Have you not heard of the Snowy Project? Have you not heard of Tasmania - you know, one of the states of the Commonwealth of Australia? Do you really need to have the truth spelled out for you? Really? Seriously? -
JMurphy at 21:07 PM on 11 November 2011Australia Legislates an Emissions Trading Scheme
Focusboy : "Govt doesn't have a great track record of investing in anything!!! Insulation....schools.... etc. Why not give tax breaks or investment incentives to private companies to come up with the technology?" How about nuclear power ? Who did all the investing in that ? -
alan_marshall at 20:45 PM on 11 November 2011Australia Legislates an Emissions Trading Scheme
More than one solution There is indeed more than one way to price GHG emissions, and the Fee and Dividend approach advocated by James Hansen and The Climate Lobby has, in my opinion, a lot to recommend it. As noted by Tom51@ 15, it was successfully implemented by British Columbia in 2008. Its present price of $25 per ton of CO2, and annual increment of $5 per ton, happens to be nearly identical to a proposal I independently put to both the Austalian Labor and Liberal parties last year as part of my personal campaign to get a price on carbon. Nevertheless, I fully support the scheme introduced by the Gillard government. It is effectively a hybrid scheme, acting as an incrementing carbon tax until 2015, when it transforms into a cap and trade scheme through floating the price of permits. There are two features of Cap and Trade schemes that are not presently part of the Fee and Dividend approach, but could be incorporated if so desired. The first is the price on GHGs other than CO2. For example, the Australian scheme charges dirty coal mines for their fugitive methane emissions at $23 per tonne of CO2eq. As a result, the biggest such miner, Gujarat, has already made plans to reduce its emissions by a whopping 83% by simple measures to control ventilation and drain gases for flaring. That’s how a carbon price works! The second feature is carbon credits, the ability for businesses to purchase offsets to reduce their liability. James Hansen thinks these are dodgy, and indeed some are, but properly audited offsets need to be part of the mechanism so that we can begin to sequester, through both biological and industrial means, the excess CO2 already in the atmosphere. We are now at 393 ppm, and the consensus is that we need to get back below 350 ppm. I think we need to avoid a fight between supporters of Cap and Trade, Fee and Dividend, Cap and Dividend (which caps production) and any of the other proposed mechanisms. Our struggle is rather with those who deny the science of climate change and would do nothing to reduce emissions. The above schemes, properly implemented, can all radically curb emissions, so I dissent with Karamanski @ 13 on that point. Both Cap and Trade and Fee and Dividend are capable of implementation on a provincial, national or global level. There is also no reason in principle why a Cap and Trade system cannot return a 100% dividend to citizens. My present position is that we need a principled formula, such as some version of Contraction and Convergence, for setting emission reduction targets for each nation. Then each country can decide for itself what mechanism to use to achieve its target. -
Philippe Chantreau at 18:38 PM on 11 November 2011Australia Legislates an Emissions Trading Scheme
Idealism won't get us anywhere and but denial is sure to get everybody backwards to dark places. If the carbon tax achieves the goal of making energy more expensive in Australia then perhaps it will help people understand that energy is a precious thing and it is not to be wasted or used carelessly. This entire world is living a Las Vegas type of life based on artificially cheap energy and countless other "externalized costs." Heck when you see how Wall Street, big banks and the whole she-bang work, you could say it's living off of money that doesn't even exist. But the ship, the physical support of all this madness, has a bow and a stern, it is finite. The boundaries are slowly catching up with us and our outrageously careless lifestyle. Australian are blessed to have a chance to learn about the boundaries while there is still room and the country is rich enbough to manage a low-pain transition. Consider yourself lucky indeed. -
Rob Painting at 18:11 PM on 11 November 2011Extreme Events Increase With Global Warming
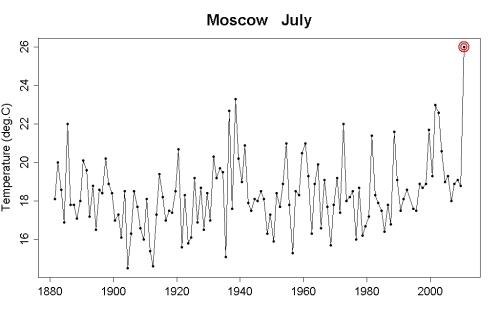
Norman @ 4 - "One may be able to claim that global warming will have a greater probability of causing a higher avearge temperature during a heat wave, evidence does not show or prove the conclusion that frequencies of heat waves will increase." Norman re-read the post again. If the temperature series follows a gaussian distribution (as illustrated in figure 1) then it will indeed have more record-breaking warm events with warming. That's one of the key points affirmed by this study. If you look at the analogy in the basic version of this post, it's like the incoming tide rising higher and higher. Of course record-breaking warm events will increase. It's a no-brainer. The essential difference between the probability of record-breaking in the GISS and Moscow July temps is due to the larger standard deviation (i.e natural variation) at Moscow. This lowers the probability of record-breaking. -
Rob Painting at 17:36 PM on 11 November 2011Extreme Events Increase With Global Warming
Nobody at All @ 2 - to describe Pielke Jnr's comments as a critique is being very, very charitable. None of his comments indicate he even understands the paper. Check out the Real Climate article hyper-linked in the post above. As for the NOAA follow up, I wonder why they change their definition of Western Russia between the original paper and their response? It's evident there is strong warming in and around Moscow (north west quadrant) in their graphic. Which is a better indicator of record-breaking temperatures in Moscow in July? Moscow itself, or the Western Russian region? We'll have to see how it plays out, but I note that Rahmstorf & Coumou have applied their analysis to a stackload of other datasets. The paper is still in pre-publication. -
Stevo at 16:51 PM on 11 November 2011Australia Legislates an Emissions Trading Scheme
Focusboy @ 25. All of us who post here at SkS know to be very careful when posting on politically related topics. The Clean Energy Authority is to be an independant body, not a government department. I'll not make any comment about either the Labor party, the Greens, nor the independants. This site is not the forum for such discussions. This site is concerned with climate science. Right now it appears that the Australian Federal Parliament has heeded the word from climate scientists. Any comments we make regarding the efficacy of political policies should be viewed through the lens of peer reviewed science. There are several topic threads at this site where discussions of how to meet base load power generation can be found. Such matters are best discussed on the appropriate threads. -
Albatross at 16:27 PM on 11 November 2011Extreme Events Increase With Global Warming
Norman @4, The area studied in your post is rather arbitrary. Please look at the latest paper that Hansen et al are working on. Available here. They conclude: "The "climate dice" describing the chance of an unusually warm or cool season, relative to the climatology of 1951-1980, have progressively become more "loaded" during the past 30 years, coincident with increased global warming. The most dramatic and important change of the climate dice is the appearance of a new category of extreme climate outliers. These extremes were practically absent in the period of climatology, covering much less than 1% of Earth's surface. Now summertime extremely hot outliers, more than three standard deviations (σ) warmer than climatology, typically cover about 10% of the land area. Thus there is no need to equivocate about the summer heat waves in Texas in 2011 and Moscow in 2010, which exceeded 3σ – it is nearly certain that they would not have occurred in the absence of global warming. If global warming is not slowed from its current pace, by mid- century 3σ events will be the new norm and 5σ events will be common." Please note the highlighted text. Also, not the following key figure from Hansen et al. (2011) for a truly global perspective: Jun-Jul-Aug surface temperature anomalies over land in 1955, 1965, 1975 and 2003-2011 relative to 1951-1980 mean temperature in units of the local standard deviation of temperature. [H/T Daniel Bailey]
-
Stevo at 16:23 PM on 11 November 2011Australia Legislates an Emissions Trading Scheme
Agnostic @23, As a former member of an Australian political party who drafted some policies relating to environmental matters, I'm just pleased to see that the legislation has put it's foot through the door. The first year of operation will allow the public to see that carbon pricing will not cause the sky to fall - and thus leave those who would repeal the tax with so much less wind in their sails. Subsequent years will most likely see changes and adjustments made to the existing legislation. The biggest hurdle has been crossed, now it just a matter of keeping the bill in law and ammending and improving it to suit needs. -
Focusboy at 16:22 PM on 11 November 2011Australia Legislates an Emissions Trading Scheme
Oh Marcus! "Some of the money raised in the first 3 years will be going to an Independent Authority that will invest the money in Clean Energy Projects. Luckily, thanks to the efforts of The Greens & Independents-in both Houses-neither Coal Seam Gas nor Carbon Capture & Storage will be included for funding by said Authority." Govt doesn't have a great track record of investing in anything!!! Insulation....schools.... etc. Why not give tax breaks or investment incentives to private companies to come up with the technology? And what do you mean 'luckily'? What you are saying is "luckily" the govt decided not to invest in the only two currently viable technologies that could replace some of our peak power load. How is that lucky? I admire your idealistic view of the world - but idealism won't get us anywhere.... -
Focusboy at 16:18 PM on 11 November 2011Australia Legislates an Emissions Trading Scheme
Lots of backslapping and feel good comments here, but I don't read anything anywhere that tells me what the carbon tax will achieve? A price on carbon, yes - but if Australia has no alternative fuel sources (fossil fuel provides 100% of Australias base load and peak load power - which is 93% of Australias total power usage) then a price on carbon will just make everything generated using fossil fuels (which is everything!) more expensive. To argue that Australias consumption will reduce means that someone has discovered a viable base load power alternative which didn't exist yesterday (or that Australia has agreed to go Nuclear) - You can't dial up or down coal fired power stations. So - for those of us concerned about real climate action - the carbon tax achieves nothing. -
Albatross at 16:15 PM on 11 November 2011Increase Of Extreme Events With Global Warming (Basic Version)
Skywatcher @9, Too true. Who will be this austral summer's drought/heat wave victim, or next boreal summer's drought/heat wave victim? Southern Africa is currently enduring a heat wave, with temperatures between 35 C and 45 C. Also see here. Is it now their turn for a 2 or 3 sigma event? -
Norman at 16:07 PM on 11 November 2011Extreme Events Increase With Global Warming
Rob Painting "That continued warming of the Earth will cause more frequent and intense heatwaves is hardly surprising, and has long been an anticipated outcome of global warming." From the two graphs below it would appear that the intensity of heat during a hotter phase does seem to be greater in the more recent years, but it does not show an increase in the frequency of hot cycles. One may be able to claim that global warming will have a greater probability of causing a higher avearge temperature during a heat wave, evidence does not show or prove the conclusion that frequencies of heat waves will increase. source.
 source.
-
Riduna at 15:16 PM on 11 November 2011Australia Legislates an Emissions Trading Scheme
The Prime Minister and Members of Parliament sitting on the cross benches do indeed deserve congratulations for passage of legislation putting a price on carbon. The real value of this legislation is that it gives certainty to investment in energy generation from the least polluting sources and provides substantial public funding to promote the development and application of technology to curb carbon emissions. However, in other respects, is it worth boasting about? There are no performance targets associated with the legislation and the purely nominal target of reducing carbon emissions by 5% below 2000 level is just that – nominal and giving a poor example to major emitting countries. Worse, government is very unclear about the actual level of reduction it aims to achieve and, when clarity is sought on this point, it refuses to provide any response. One might, at the very least, have hoped for orderly reduction in dependence on and use of fossil fuels. Instead we get repeated, categorical assurances from the Minister for Climate Change that coal has a long and lucrative future and investment in it is encouraged. The legislation provides a good structure for reduction of carbon emissions and the orderly, rapid abandonment of fossil fuels and development of the innovative technology required to achieve this. Indications are that there is far too little political will to actually achieve these outcomes. Actions speak louder than words – particularly ambivalent ones. -
alan_marshall at 15:16 PM on 11 November 2011Australia Legislates an Emissions Trading Scheme
Tom51 @ 15 When Tony Abbott seized the Liberal Party leadership from Malcolm Turnbull in December 2009, he won by just 42 votes to 41. As the impacts of climate change become ever clearer, Abbott’s support is unlikely to increase. And when we consider that not just Turnbull, but 3 other former leaders of the Liberal Party have supported pricing carbon, Abbott is beginning to look a bit lonely. With David Cameron, John Key, Arnold Schwarzenegger and Gordon Campbell, we have conservative leaders from 4 similar English speaking economies taking firm action to reduce CO2 emissions. These men ought to serve as good role models for whoever leads the Liberal Party in Australia. -
alan_marshall at 14:52 PM on 11 November 2011Australia Legislates an Emissions Trading Scheme
Arkadiusz Semczyszak @ 11 The revenue raised by pricing carbon will be used for legitimate purposes. All taxpayers with incomes below $80,000 will get tax cuts - most about $300 a year. Combined with adjustments to welfare payments, this means that 55% of revenue will be returned to households, with 2 in 3 receiving compensation at least equal to the impact on their cost of living. The balance of the revenue will be used for industry assistance and a renewable energy investment fund. Tony Abbot describes this as a “money churn”, but he missed the point. The price differential between products and services that are emissions intensive, and those that are not, will still provide the same incentive to alter spending behaviour, regardless of how much compensation is paid. -
skywatcher at 14:34 PM on 11 November 2011Increase Of Extreme Events With Global Warming (Basic Version)
That figure (Hansen's Fig 6) is a very elegant way of expressing how extreme events (the 2-3 sigma reds and browns) are on the rise due to AGW, but not uniformly everywhere every year. The next time somebody suggests Texas wasn't extreme, or that Australia / Europe / Russia / Amazon has had such events before therefore there's no problem, they should be referred to that graphic. Roll the dice each year, fancy being under a red or brown in your local summer? It's getting more and more likely... -
chriskoz at 14:14 PM on 11 November 2011CO2 Problems: Parallel concerns breed parallel denial
Good article, chukbot. Thanks for debunking one more piece of misconception. I found minor detail worth the correction. In Pedantic Semantics section you say: If the pH of a solution changes from 9 to 8, the solution has acidified, even though it is still basic. IMO, it's more correct to say: If the pH of a solution changes from 9 to 8, the solution has acidified, even though it is still alkaline. I'm not a chemist but I think from primary school that 8 is definitely alkaline, since it's 1 degree above (10 times more alkaline ions) the basic. -
Chris G at 13:59 PM on 11 November 2011Increase Of Extreme Events With Global Warming (Basic Version)
DB, I think one would have to have a moderate understanding of statistics to understand just how chillingly dead-on that paper is to what I really did not want to hear. I don't know how to convey what an increase from 0.1-0.2% to 6-13% coverage of 3 sigma (or greater) anomalies means to a person who doesn't know what a Gaussian distribution is. Dr Hansen's saying that "...there is no need to equivocate..." is perhaps an understatement. I was hoping that recent events would remain anomalous for some decades; the data would indicate that is unlikely. It's all there in figure 6, Europe 2003, Australia 2009, the Amazon, Russia and the Middle East 2010, and Texas 2011. The area with 3 sigma warming sometimes pops in different places in different years, it waxes and wanes, but it is growing inexorably. Thanks, I think.Response:[DB] The graphic that Chris refers to is this one:
Figure 6. Jun-Jul-Aug surface temperature anomalies over land in 1955, 1965, 1975 and 2003-2011 relative to 1951-1980 mean temperature in units of the local standard deviation of temperature.
-
pmiddents at 13:31 PM on 11 November 2011Extreme Events Increase With Global Warming
Maybe Roger Jr. could be induced to comment. He has had a lot to say about RC11 on his own blog, briefly at Real Climate and a comment yesterday at Kloor's where he says it is a "nonsense paper" On his blog he describes the methods in RC11 as Stats 101 ball and urn stuff tricked out with a bunch of complexity. Rahmstorf retired from the fray early at Real Climate and I don't blame him. You folks here at SkS have the chops and the persistence to talk this over with the junior Pielke. It needs to be done. Paul Middents -
muoncounter at 13:27 PM on 11 November 2011Increase Of Extreme Events With Global Warming (Basic Version)
DB inline#5: That is a beautiful paper. No doubt he will be denounced by the usual denouncers for it. People who deny the global warming cause of these extreme events usually offer instead a meteorological "explanation". For example, it is said that the Moscow heat wave was caused by an atmospheric "blocking" situation, or the Texas heat wave was caused by La Nina ocean temperature patterns. Of course the locations of the extreme anomalies in any given season are determined by the specific weather patterns. However, blocking patterns and La Ninas have always been common, yet the large areas of extreme warming have come into existence only with large global warming. Today's extreme anomalies occur because of simultaneous contributions of specific weather patterns and global warming. Too bad he didn't use the phrase 'rolling thirteens.' -
Nobody at All at 13:18 PM on 11 November 2011Extreme Events Increase With Global Warming
What are your thoughts on Roger Pielke, Jr.'s critique (and the NOAA follow-up)? -
Bern at 12:08 PM on 11 November 2011The Climate Show 21: Carbon, coal and BEST
Well, there's my Friday evening entertainment all sorted... :-P -
John Hartz at 11:47 AM on 11 November 2011Australia Legislates an Emissions Trading Scheme
Suggested reading: “Capitalism vs. the Climate”, The Nation (USA), Nov 28, 2011 print edition. Click here to access this in-depth and thought-provoking, cover story by Naomi Klein. -
Chris G at 11:24 AM on 11 November 2011Increase Of Extreme Events With Global Warming (Basic Version)
**** correction "..., have experienced unusual or record warm/dry events within Y years..." -
Chris G at 11:19 AM on 11 November 2011Increase Of Extreme Events With Global Warming (Basic Version)
I'm thinking that the work on the probability of the Moscow heat wave/drought could be extended to multiple locales. For instance, one might ask the question, "What are the odds that X regions of Australia, the US, China, Russia, and possibly others, have occurred within Y years of each other?" You could might have to look at the historical records to see how much concurrence, if any, has existed for droughts in the same regions. If the number of such events occurring in close proximity to each other is common in history, but not associated with global warm periods, then it means less. If they have been mostly uncorrelated in the past, and are becoming more correlated, or if common occurrences are associated with warm periods, then it means more. I'm going to throw out a guess that you would find an association between the frequency of these events and warm periods, and you might find the regions just poleward of Hadley cells were the most likely to be unusually warm and dry. Otherwise, yeah, at best you can attempt to keep the undecideds from being swayed by misinformation. If the undecideds really cared, they would not be undecided; there is plenty of information available. Maybe the trick is to catch them at the moment they start to care. Maybe attributions of crop damage, food prices, and social unrest will work better than appeals to preserve the habitat of what most people consider exotic species. On the other hand, appeals to preserve their own children do not work on those who have convinced themselves that nothing bad will happen to them.Response: [DB] Dr. James Hansen has a pertinent new article out on his website: Climate Variability and Climate Change: The New Climate Dice -
Stevo at 10:51 AM on 11 November 2011The Climate Show 21: Carbon, coal and BEST
John, Dana, Hats off to you both. -
John Hartz at 10:49 AM on 11 November 2011Extreme Events Increase With Global Warming
Kudos on a very well-written article about rather complex analyses. -
John Cook at 10:47 AM on 11 November 2011The Climate Show 21: Carbon, coal and BEST
I knew you'd come through for me in time, Dana :-) -
WyrdWays at 10:41 AM on 11 November 2011Increase Of Extreme Events With Global Warming (Basic Version)
3 - Invicta You've hit the nail on the head there. Many climate hawks (ie those who want strong action on dealing with climate change; blame Joe Romm for that one..) spend a lot of time trying to argue to point with the denialist fringe. Pointless. Such people have invested emotionally in the denialist-narrative, that suits them very nicely, for various personal reasons; they won't be shifted - it's a faith. Of course plenty on the 'climate hawk' side are somewhat intractable and faith-based too.. But the others outside this schism - the great apathetic wedge in the middle - won't form an opinion on CC until CC intrudes rudely on them. It is already doing so, of course, but it's too nebulously attributed. Putting probability numbers such as "80% this extreme weather event that flooded your house/ dried your reservoir/ flattened your crops/.. was down to climate change" changes the picture dramatically. If the attribution is valid, and reported consistently, CC stops being a wishy-washy creep of the 'global average thermometer over a decade' (which that no-one directly experiences anyway) Much more of this sort of research/reporting please! -
Marcus at 10:36 AM on 11 November 2011Australia Legislates an Emissions Trading Scheme
"In Europe, a large part goes back to the fuel companies". Really, Ark, you got any evidence to back that up? Here in Australia, some of the money raised in the first 3 years will be going to an Independent Authority that will invest the money in Clean Energy Projects. Luckily, thanks to the efforts of The Greens & Independents-in both Houses-neither Coal Seam Gas nor Carbon Capture & Storage will be included for funding by said Authority. -
skywatcher at 10:17 AM on 11 November 2011CO2 Problems: Parallel concerns breed parallel denial
Interesting Arkadiusz refers us to a paper that does not support his conclusions. In his subsection from Seki et al 2010 entitl;ed "Changes in the CO2 were also rapidly:", he highlights and describes a part of a figure 9, whose data do not come from Seki et al. In fact, they come from: Raymo et al, 1996. Mid-Pliocene warmth: stronger greenhouse and stronger conveyor. Mar. Micropaleontol. 27 (1–4), 313–326. Here, we see that not only are the errors in the ~370-470ppm pCO2 estimates for the mid-Pliocene given as +/-65ppm on the graph, and suggested +/-25ppm in the text, the most rapid variation is 29ppm over 3600 years, or 66ppm over 31,200 years, with undefined age errors referred to an earlier paper (Shackleton et al 1990), the rate of CO2 drop in the first instance is 0.008ppm/yr, and increase in the second instance is 0.002ppm/yr. Now ignoring the errors discussed in the papers and above, hands up who would like atmospheric CO2 to be increasing by as little as 0.005ppm per year? Not exactly rapid, compared to modern rises several orders of magnitude larger! Arkadiusz, be careful with your sources, and placing your own amateur interpretations of large variations put on a scale where the x-axis reads hundreds of thousands or millions of years... -
bill4344 at 09:58 AM on 11 November 2011Australia Legislates an Emissions Trading Scheme
I'm with Marcus. Abbott's 'blood oath' to repeal will only come to define him as the purely negative anachronism he is. As the economy continues to fail to fall apart post CT what has 'Dr. No' got left? Turnbull then becomes the obvious leader of the Her Majesty's Loyal Opposition. Then neither major Australian party in denial - of AGW, anyway - woohoo! Although I agree with Bernard that some will attempt to sheet home the global impact of Berlusconi's egregious incompetence to the Great Big New Tax, I seriously doubt that people are that stupid. -
invicta at 09:45 AM on 11 November 2011Increase Of Extreme Events With Global Warming (Basic Version)
2-les Spending too long here or similar sites can make you (me) think that the lunatic brigade are what is important. In truth I think the important people are the great majority who couldn't care less either way. (in my experience) Until the message gets through that what's going to happen will or is affecting them (us) directly they will continue to care less and bother their politicians not at all. In which case we are all simply using all this electricity for our own amusement. -
Bob Lacatena at 09:41 AM on 11 November 2011Models are unreliable
411, dhogaza, No, no, no. What if the cloud feedback is negative, as RW1 claims? Then climate sensitivity is 0.5C per doubling, or even 0.0C per doubling. Maybe even -1C per doubling! You darn science types are always making false assumptions and jumping to alarmist conclusions. -
skywatcher at 09:25 AM on 11 November 2011Models are unreliable
You've got to love the way uncertainties in parts of climate models get conflated with "models are unreliable", or "models do not have preditive ability". Say it's mid-August in Melbourne, the daytime temperature is a respectable (and close to average) 15C. Can I forecast the exact temperature two weeks from now? No. But I can say that it's likely that the average temperature during September will be a bit higher than 15C. Some days will be cooler, but it's very likely, but not certain that most will be warmer. As for October, I can forecast that nearly all days will have a max temperature higher than 15C, and for November and December, it's unlikely that any day will be below 15C. I know this because the underlying forcing, not visible in a short timeseries with large variability, shows up over a longer period of time. The underlying forcing beats the variability every time. I know that October will be warmer than August, although not every October day will beat every August day. In the same manner, I can be very confident that the 2010s and the 2020s will be warmer than the 1990s and 2000s, even though not every later year will beat every earlier year. The models forecast this very well, alongside a great deal of more complex factors. Some factors not so well, but claiming unreliability belies an inability to understand the usefulness of models. Is the model unreliable because it cannot pick out the exact variability due to noisy variations in the short term? If you're forecasting the weather two months ahead, yes, but if you're forecasting the climate, no. -
les at 09:19 AM on 11 November 2011Increase Of Extreme Events With Global Warming (Basic Version)
1 - invicta I guess this is off topic for this thread but thinking that accurate predictions will have any impact is deluded. Google words like "YU55, NASA, coverup" and see what turns up. AFAIK the presence of the comment was well known, none of the lunatic bridgade have any "evidence" beyond what scientists provide - yet NADA scientist are "liers"!! Don't over estimate the intelligence of those we're up against. -
Bruce A. at 08:59 AM on 11 November 2011CO2 Problems: Parallel concerns breed parallel denial
Thanks for an interesting article. Would Figure 6 with a log-linear Y-axis add to the discussion, or do the different sources/smoothing/whatever make this uninformative? -
dhogaza at 08:52 AM on 11 November 2011Models are unreliable
Sphaerica: "Let me see if I get this right: 1) Clouds are a factor that models do not handle as well as desired 2) Therefore clouds are not handled at all 3) Therefore models are unreliable and have no predictive skill 4) Therefore we don't know what climate sensitivity is" Typically #4 is "4) therefore climate sensitivity is about 1C per doubling, max", no ??? :) ITSM that's where they always end up. Even Curry does it ... her "uncertainty monster" argument is that poor treatment of uncertainty causes climate scientists to *overestimate* sensitivity. Not "underestimate error bars" ... -
dana1981 at 08:18 AM on 11 November 2011Australia Legislates an Emissions Trading Scheme
NewYorkJ - I guess it's not only the USA in which political liberals are inept at messaging! -
invicta at 08:03 AM on 11 November 2011Increase Of Extreme Events With Global Warming (Basic Version)
I have just been reading this article communicating the science of climate change in physicstoday regarding the way scientists communicate with the public about climate science. When do you think scientists will be able to say accurately things like - there is a ...% chance that this event was due to climate change- on a regular basis rather, than the 'sceptic' friendly 'It is impossible to attribute any specific event to AGW'? Weather forecasters use similar phrases regularly and it would convey a more realistic scenario to the unenlightened. Wouldn't it? -
dr2chase at 07:46 AM on 11 November 2011CO2 Problems: Parallel concerns breed parallel denial
Here's my favorite graph showing "no change". Haven't seen it elsewhere, don't know why. -
muoncounter at 07:40 AM on 11 November 2011Models are unreliable
In addition to their 'undercarriage,' models get better with time. People who run models learn from prior work. That seems to be a significant problem with the denials - they just keep repeating the same old generic 'models are unreliable.' For example, listed here are several publications from a NASA water cycle study group. These folks are addressing the very issues that Camburn is looking for: evaporation, clouds, soil moisture, etc. But really: is there something likely to come out of this detail work that will undo the warming to date? That will undo the fact that forcing from atmospheric CO2 keeps rising? That these nonsensical objections (Warming paused! You can't be sure! There's no basis!) are just distractions from the real questions? Sphaerica's assessment is quite correct. We are in this situation. Meanwhile there's a tropical storm in the Atlantic in mid November and the worst storm in 37 years in Alaska on the same day. -
chuckbot at 07:19 AM on 11 November 2011CO2 Problems: Parallel concerns breed parallel denial
re: 4-6 Ooops! It should in fact be concentration on the Y-axis. That will teach me to copy/paste code :( I'll fix it momentarily. -
chuckbot at 07:17 AM on 11 November 2011CO2 Problems: Parallel concerns breed parallel denial
Re: JH @2 Sure! Top to bottom, Fig1: Taken from the written statement of Dr. John Everett before Senate EPW hearing on “EPA's Role in Protecting Ocean Health”, May 11, 2010. Fig2: Global CO2 rate data taken from Thomas Conway and Pieter Tans, Annual Mean Carbon Dioxide Growth Rates NOAA/ESRL (www.esrl.noaa.gov/gmd/ccgg/trends/global.html) Fig3: MLO data from Pieter Tans and Ralph Keeling. Mauna Loa Annual Mean Data, NOAA/ESRL/Scripps (ftp://ftp.cmdl.noaa.gov/ccg/co2/trends/co2_annmean_mlo.txt). IS92a Scenario from IS92a CO2 concentrations (http://www.cgd.ucar.edu/vemap/supplemental/IS92a.dat). Dr. Everett's projection (described in his remarks in part II) is based upon the assumption of a constant accumulation rate of 1.87 ppm/year; the extrapolations based on MLO (1959-present) and global (1980-present) rate data are calculated by integrating the least-squares linear fit with the 2009 CO2 concentration as an initial condition. Fig4: IPCC AR4 Working Group I, figure 6.1. (http://www.ipcc.ch/publications_and_data/ar4/wg1/en/ch6s6-3.html) Fig5: MLO data as with Figure 3; all others from the Paleoclimatology archive of NOAA's National Climatic Data Center. Law Dome data were the 75-year smoothed series from Etheridge, D.M., et al., 2001, Law Dome Atmospheric CO2 Data, IGBP PAGES/World Data Center for Paleoclimatology Data Contribution Series #2001-083. NOAA/NGDC Paleoclimatology Program, Boulder CO, USA. (http://www.ncdc.noaa.gov/paleo/metadata/noaa-icecore-2455.html) Taylor dome data were from Indermühle, A., B. Stauffer, T.F. Stocker and M. Wahlen, 1999,Taylor Dome Ice Core CO2 Holocene Data. IGBP PAGES/World Data Center-A for Paleoclimatology Data Contribution Series #1999- 021 NOAA/NGDC Paleoclimatology Program, Boulder CO, USA. (http://www.ncdc.noaa.gov/paleo/metadata/noaa- icecore-2419.html) Vostok data were originally published in Barnola, J.-M., D. Raynaud, Y.S. Korotkevich, C. Lorius. 1987. Vostok ice core provides 160,000-year record of atmospheric CO2. Nature 329:408-414; the data were retrieved from the NCDC archives (http://www.ncdc.noaa.gov/paleo/metadata/noaa-icecore-2442.html). Fig 6: Same data as Figure 5; rates have been calculated by dividing the difference between successive concentrations by the length of time between them, and assigning the resulting rate to the midpoint of the time interval (ie, given a time series [Ti, Xi], a new time series is constructed [ti, Yi] where ti = (Ti + Ti+1)/2 and Yi = (Xi+1 - Xi) / (Ti+1 - Ti))Moderator Response: [John Hartz] Thanks. The captions should now be inserted into tbe article. -
chuckbot at 07:08 AM on 11 November 2011CO2 Problems: Parallel concerns breed parallel denial
Re: DM @1 Based simply on this data, you could argue that - the trend in the global ESRL data is significant only at ~93% confidence interval. However, MLO data which stretch back to the late 1950's and are in good agreement with the ESRL data in their overlap, show a significant increase (p~01^-7) -
dana1981 at 06:26 AM on 11 November 2011The Climate Show 21: Carbon, coal and BEST
Well who doesn't love an animated GIF, after all? http://sks.to/best is now live, by the way. -
NewYorkJ at 06:24 AM on 11 November 2011Australia Legislates an Emissions Trading Scheme
"Carbon tax bill passes" "Carbon pricing scheme" Sheesh...they got it done in the end, but they've done a horrible job of selling it. They haven't managed to convince anyone to call it anything other than something that sounds purely negative - the big bad government taxing them more, although this is certainly on the media too. I mean, they could just as well call it the "Clean Energy Promotion and Income Tax Relief" bill, and it would be just as accurate. Instead, Australians come away with the false impression that it's simply a tax on them with nothing positive. Maybe someone can find a poll on this, but how many Australians know that there are income tax offsets that will put many of them ahead? -
Bob Lacatena at 06:19 AM on 11 November 2011Models are unreliable
408, Camburn, Say something beyond the obvious, and make an actual point rather than a vague and wholly uncertain implication. And remember to support it with facts and references.
Prev 1400 1401 1402 1403 1404 1405 1406 1407 1408 1409 1410 1411 1412 1413 1414 1415 Next


