


 Arguments


Recent Comments
Prev 1401 1402 1403 1404 1405 1406 1407 1408 1409 1410 1411 1412 1413 1414 1415 1416 Next
Comments 70401 to 70450:
-
Eric (skeptic) at 12:22 PM on 13 November 2011Australia Legislates an Emissions Trading Scheme
I am surprised to learn we have a second political party here in the USA :) IMO there is little doubt that someone who acknowledges climate change will be elected President in 2012. However the House will not acknowledge it unless the people do (may take a while) and the Senate will not propose effective legislation due to disproportionate farm state representation (it would basically be a big farm bill with some windmills and solar). I would support tax and rebate to gain popular support and remove some of the offset fluff. -
Tristan at 12:03 PM on 13 November 2011Australia Legislates an Emissions Trading Scheme
Romney abandoned his acknowledgment of climate change when it became clear that he wouldn't win the primaries otherwise -
Eric (skeptic) at 11:49 AM on 13 November 2011Increase Of Extreme Events With Global Warming (Basic Version)
Muoncounter, that's a assuming that 1995 cutoff date is meaningful. I could set the cutoff date to 1980 (half way back to 1950) and the ratio is still 62/38. The most accurate description is that there was a lull from 1970 to 1995. -
muoncounter at 11:12 AM on 13 November 2011Increase Of Extreme Events With Global Warming (Basic Version)
Additional evidence of increasing Euro heat. “The reduction in days of extreme cold is due to an increase in the average minimum temperature from 0.5ºC to 1ºC during the analysis period, while for days of extreme heat, the increases in the average maximum temperature were from 0.5ºC to 2ºC” And evidence of more frequent Euro drought. "The magnitude and frequency of the drying that has occurred is too great to be explained by natural variability alone," said Martin Hoerling, Ph.D. of NOAA's Earth System Research Laboratory ... "This is not encouraging news for a region that already experiences water stress, because it implies natural variability alone is unlikely to return the region's climate to normal." These are connected: Dry Winters In North Mediterranean Stoke Hot European Summers From an analysis of meteorological records spanning the past 58 years, Vautard et al. determine that parched conditions around the northern Mediterranean create a mass of anomalously warm, dry air that spreads northward in early summer. -
muoncounter at 10:59 AM on 13 November 2011Increase Of Extreme Events With Global Warming (Basic Version)
Eric#21: "(8/13 is still too close to 50/50 IMO)." That's 62% of the hyperactives in the last 16 years. The remaining 38% are spread over 1950-1995 or 45 years. Even if the ratio was 50/50, that would still be a very asymmetric distribution. -
Eric (skeptic) at 09:35 AM on 13 November 2011Increase Of Extreme Events With Global Warming (Basic Version)
Sphaerica and muoncounter, thanks for the feedback. The 10-15 years of stronger and more frequent storms is still a bit short to draw strong conclusions. My impression from the landfalling storms (links in #15) is that decades were heavily clustered and almost every decade will bring forth a new pattern. But that may be more applicable to landfall than all tropical storms. My view on the frequency vs strength is that increasing strength seems like a no-brainer, but frequency requires both warmth and dynamics, warmth alone is not enough to spawn tropical storms. "Hyperactive" ACE trends (last link in #20) seem to reflect that increase in strength which could still use a little more evidence (8/13 is still too close to 50/50 IMO). -
Rob Honeycutt at 08:13 AM on 13 November 2011How to Avoid the Truth About Climate Change
Dr Bickmore... IMO you are hitting on exactly the right issue. It's one thing when Chris Mooney writes his book on why conservatives have a hard time accepting science. It falls on deaf ears with regards to the people who most need to understand the challenge. When a conservative such as yourself writes a book on this topic it's a different matter. It means more of the people who need to be reconsidering their position will actually be able to hear what's being said. -
actually thoughtful at 07:22 AM on 13 November 2011Australia Legislates an Emissions Trading Scheme
I can't help but look at this through the lens of US policy (but very fun to get the insider view on Australian politics). At this point, I base my hopes on the fact that US politics often change on a dime. If we get a hot summer in 2012 (even in a La Nina this could happen) leading up to the elections, and these effective policies in Australia, Europe, Scotland, BC are highlighted - we could end up with a rational policy in the US. As much as Obama has given lip service to climate change, the facts remain that he made health care his primary issue, and completely botched the effort in the US Congress to get cap and trade passed. It could be true that a Romney election is the path to an effective US response, just as only Nixon could go to China. For all the noise in the US - there are only 20% firmly against, and another 20% doubtful. The rest of us have a pretty firm grasp of reality (perhaps only on this issue...). -
Utahn at 07:01 AM on 13 November 2011How to Avoid the Truth About Climate Change
I can't recommend this enough for a certain moderate or conservative in your life who has been deceived. I think the tone is perfect for that type... -
chuckbot at 07:00 AM on 13 November 2011CO2 Problems: Parallel concerns breed parallel denial
re 25 (chriskoz): My understanding is that basicity is defined by the concentration of OH- ions in the same way that acidity is defined in terms of the concentration of H+ ions. A solution is basic when its basicity outweights its acidity - that is to say, there are more OH- ions than H+. When this happens, the pH is greater than 7 (7 being the pH of a neutral solution.) One thing that I didn't know about before researching OA is that alkalinity and basicity, which I had previously treated as synonymous, are actually distinct concepts. Acidity, alkalinity, and CO2 are related in the ocean, and the Gazeau 2007 paper I mention used this interrelationship to study the effects of high CO2 on shellfish calcification in a way I thought was clever. So I think that it is fine to describe a pH change from 9 to 8 as acidification of a solution that remains basic. Your discussion in #26 seems right on though :) -
chuckbot at 06:38 AM on 13 November 2011CO2 Problems: Parallel concerns breed parallel denial
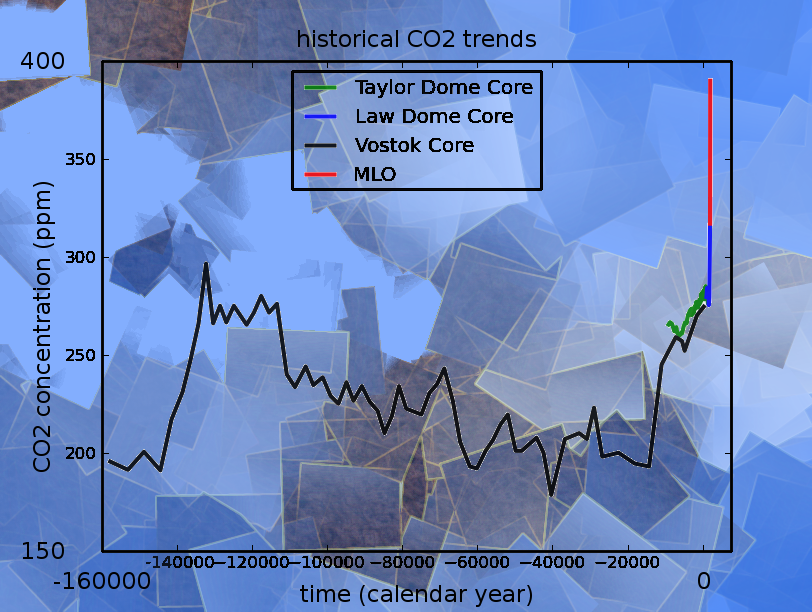
Images fixed and captioned! re:23 (Bruce) I have thought about a logarithmic time axis - it would be a neat way of comparing events over different time scales. Unfortunately that collapsing of scales can be a conceptual barrier to people who aren't used to thinking with logarithms. For example, I have shown people this image: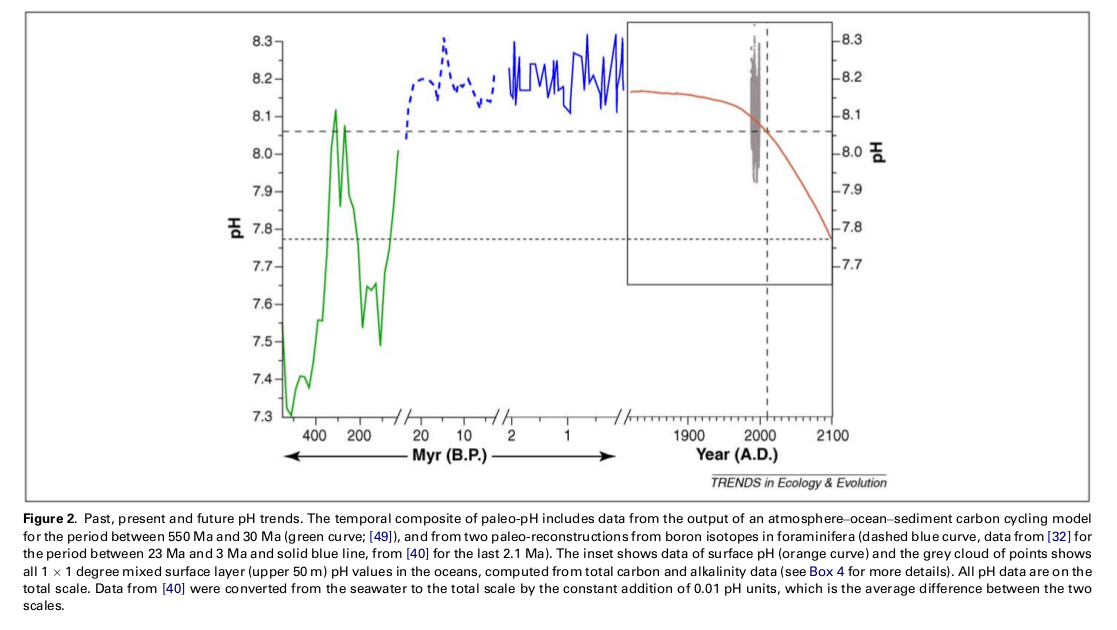 and even after explaining that the changes are taking place on very different time scales, they still see the current event as being comparable to the 100myear scale oscillations. It would be neat though. I made some fancy backgrounds for some of my graphs and the one I did for the Vostok/Taylor/Law/MLO concentrations was my favorite. I was reading a lot of HP Lovecraft at the time and especially liked the story At the Mountains of Madness, which is set during a geological research expedition to Antarctica. I based it a lot on how that story felt to me
-
Riccardo at 06:36 AM on 13 November 2011How to Avoid the Truth About Climate Change
Oh yes, they are definitely "trying too hard to avoid the truth". Good job Barry, thank you for sharing your lecture. -
Steve L at 05:29 AM on 13 November 2011The BEST Summary
Hi Brent, feel free to quote of course. I'm just a biologist, though, and not someone with any special insight on the underlying physical processes your engineers are interested in or the relevant psychology regarding how that information is (mis)interpreted. My tentative conclusions in comment 1 are based on things I learned here at SkS. But what to do with those conclusions? How do we move on? I'm not sure that a discussion with people whose professional opinions of their opponents include such characterizations is a good way to do it. Your idea to point them here is a good one, if they're interested in science. I think your efforts are laudable. Best of luck. -
Tristan at 05:06 AM on 13 November 2011Australia Legislates an Emissions Trading Scheme
Unlike the USA, China is not burdened by a major political party in denial. Haha. Or a 2nd political party. -
John Hartz at 04:47 AM on 13 November 2011CO2 Problems: Parallel concerns breed parallel denial
"It is a difficult idea to fathom. But the science is clear: Unless we change the way we live, the Earth's coral reefs will be utterly destroyed within our children's lifetimes." Source: "Is the End in Sight for The World’s Coral Reefs?" by J.E.N. Vernon, Yale Environment 360, Dec 6, 2010 To access this informative article, click hereJohn Hartz at 04:25 AM on 13 November 2011Australia Legislates an Emissions Trading Scheme
Suggested reading: “Countries Most Vulnerable To Climate Change Meet In Dhaka, Bangladesh” PlanetSave, Nov 12, 2011 To access this timely article, click here.David Lewis at 04:22 AM on 13 November 2011CO2 Problems: Parallel concerns breed parallel denial
Great article. More people should present data as you have, i.e. in your "historical CO2 trends", and "historical CO2 rate trends" charts which show present trends as vertical lines. On the general subject of ocean acidification, I note that J.E.N. Veron, one of the world's authorities on reefs, has a great book out, "A Reef in Time", which is his plea to the world that the composition of the atmosphere be stabilized so that life in the oceans can be conserved. A few quotes follow. The italics are Veron's: "Acidification is serious because of commitment - a word that will soon be used with increasing frequency in the scientific literature. Commitment embodies the concept of unstoppable inevitability, according to which the nature and health of future environments will be determined not by our actions at some future date but by what is happening today. The oceans, including the ocean depths, respond slowly to atmospheric conditions, whether a temperature increase or a CO2 buildup, which means that the full effects of acidification will take time to develop. Nevertheless, this is only a delay: the factors causing acidification will have irretrievably committed the Earth to the process long before its effects become anywhere near as obvious as those of mass bleaching today." "Ocean acidification must be taken seriously and as a matter of great urgency if the world's oceans are not to be committed to a future of unbridled destruction. It has happened before and it not only can happen again it will happen again unless adequate intergovernmental action is taken on CO2 emissions now. This is one of the most serious (if least well understood) of all predicted environmental changes on Earth, yet so far it has attracted only the most superficial publicity and, to date, only the beginnings of intergovernmental recognition. Preventative action is the same as for global warming and coral bleaching, but the time frame and severity of acidification, as well as its long-term consequences, have no equal." Also: "a lack of international willingness to confront core issues will soon lead to unstoppable processes that could bring on an extinction event the likes of which the world has not seen for 65 milion years". "the effect will, at least in the case of ocean acidification, last for a minimum of hundreds of thousands of years"John Hartz at 04:15 AM on 13 November 2011Australia Legislates an Emissions Trading Scheme
You will want to check out the Open Climate Network recently created by the World Resources Institute. The Open Climate Network is an independent, international partnership that tracks and reports on the progress of key countries on climate change. OCN seeks to accelerate progress toward the low-emissions future by providing consistent, credible information that enhances accountability both between and within countries.muoncounter at 03:09 AM on 13 November 2011The BEST Summary
dorlomin#10: "they both seem to hold the idea that uncertainties are under estimated" Wasn't the goal of BEST to reduce the overall uncertainties in the land temperature record? And didn't it show that CA/WattsUp-type criticisms of the more recent record are, on balance, rubbish? Incredibly, Curry can't even admit that the study with her name on it accomplished even that much. Would you want her as a co-author, given that she would feel free to publicly criticize your work after it was done?muoncounter at 02:46 AM on 13 November 2011Increase Of Extreme Events With Global Warming (Basic Version)
Eric #17: "muoncounter's conclusion..." I'm flattered, but I am also hardly a reputable source. One of the more telling points, after considerable back and forth over which metric to use (!), was this graphic: -- source
This was an attempt to analyze ACE (accum cyclonic energy), which is purely a wind speed - duration metric, by its components. In addition, there was some discussion of the fact that ACE ignores the large rainfall events like tropical depressions and gives more weight to slow-moving storms.
So the context of 'the science isn't settled' was an argument over interpretations of fewer landfalling storms/more named storms and lower ACE/more precipitation. We can now add another datapoint/bone of contention: Of the 25 'above normal' Atlantic seasons (including 2011) shown here, 15 occurred since 1970; of the 13 'hyperactive' seasons, 8 occurred since 1995.
Bob Lacatena at 02:02 AM on 13 November 2011Increase Of Extreme Events With Global Warming (Basic Version)
-- source
This was an attempt to analyze ACE (accum cyclonic energy), which is purely a wind speed - duration metric, by its components. In addition, there was some discussion of the fact that ACE ignores the large rainfall events like tropical depressions and gives more weight to slow-moving storms.
So the context of 'the science isn't settled' was an argument over interpretations of fewer landfalling storms/more named storms and lower ACE/more precipitation. We can now add another datapoint/bone of contention: Of the 25 'above normal' Atlantic seasons (including 2011) shown here, 15 occurred since 1970; of the 13 'hyperactive' seasons, 8 occurred since 1995.
Bob Lacatena at 02:02 AM on 13 November 2011Increase Of Extreme Events With Global Warming (Basic Version)
17, Eric, I will concede from the data offered that it makes no statement as to total number of storms. If you wish to take the position that an increase in named storms, hurricane strength storms and hurricane size and intensity all represent an increase in strength, while the total frequency of storms (including those that do not become strong enough to earn names) remains the same, then I will concede that point. Note that I am also well aware that much of the literature argues for the point you are making (an increase in intensity, not frequency) based on simulations. I am simply pointing out that the most recent data appears to contradict this, and I look forward to future attribution studies which will have a larger data pool from which to draw conclusions.Bob Lacatena at 01:54 AM on 13 November 2011Australia Legislates an Emissions Trading Scheme
47, bill, Stupendous response. Still chuckling at that one.Bob Lacatena at 01:17 AM on 13 November 2011Increase Of Extreme Events With Global Warming (Basic Version)
17, Eric, No argument on what is settled. It is so early that it's hard to prove a climate change attribution for any extreme weather event, simply because the period is too short and the net change is too small. This is what has been discussed a lot, but is changing day by day as extreme events become more common and more extreme. Picking the signal out of the noise gets easier every year. And it will continue to get a lot worse. I am merely addressing your specific statement of expectation of what is likely to occur. You list heat waves, extreme drought and extreme rainfall as events that are more likely to occur. You suggest that hurricanes will probably be stronger but fewer. I am simply pointing out that evidence to date is to the contrary. It is far from settled, but it also appears that the "stronger but fewer" hypothesis is not, at least for now, supported by observations. In fact, it is strongly refuted by observations of Atlantic storms. Specifically, in the past 16 years, 10 of those years have had 15 named tropical storms or more. The previous 102 years only had 4 such years. 6 of the 10 most intense Atlantic hurricanes in the past 100 years occurred in the past 13 years, 5 of those in the past decade. Using data going back to 1851 (i.e. a span of 160 years) the 9 largest storms by diameter all occurred in the last 15 years. Even if you want to dismiss data prior to the satellite era as unreliable... 9 of the largest in whatever period you want to choose occurred in the last 15 years! Is older data suspect and less accurate, prior to globalization, modern instruments and satellites? It always is. This is an ongoing impediment to climate science. Is the science settled? No. Do observations support the idea that stroms will be stronger but fewer? No. Current observations (over a short period in a world that has not warmed nearly to the point that we have already committed with current CO2 levels) strongly support the idea that at least in the Atlantic we will see both more numerous storms and more powerful storms.dorlomin at 00:41 AM on 13 November 2011The BEST Summary
"and involved Richard Muller and Judith Curry, two scientists quite skeptical of the global warming theory." I think this is a mischaracterisation. I think they are both convinced that CO2 increases temperatures and that the feedbacks will be generally positive, however they both seem to hold the idea that uncertainties are under estimated and take on board the Climate Audit type criticisms of the last 1000s years of paleo.Anne-Marie Blackburn at 00:03 AM on 13 November 2011Luxembourgish translation of The Scientific Guide to Global Warming Skepticism
Great work, Robert. What's the situation in Luxembourg like? Do people generally accept the science, or is there much denial?Eric (skeptic) at 23:20 PM on 12 November 2011Increase Of Extreme Events With Global Warming (Basic Version)
Sphaerica, There was a discussion on that last winter and muoncounter's conclusion was " this particular aspect of the science isn't settled". I brought it up again here and muoncounter pointed out in the next post that there are some studies showing an increase, some showing no increase, but no studies showing a decrease. So still somewhat unsettled ATM.RobertLeven at 22:28 PM on 12 November 2011Luxembourgish translation of The Scientific Guide to Global Warming Skepticism
Deeply convinced about the valuable content of this document, I forwarded the information to the press and the media, accompanied by an introduction. Meanwhile, I passed an interview on the most important Radio network for Luxembourg (RTL)to promote the work of the document and of skepticalscience as well, and an article in the biggest newspaper (Luxemburger Wort) was published on last Thursday. An additional interview and presentation on the german speaking RTL radio should follow soon.macwithoutfries at 21:03 PM on 12 November 2011Extreme Events Increase With Global Warming
Rob Painting @10 - very good point, I have missed that reference to 1360; however my experience with deniers is showing that they like to focus on the slightest detail and draw away the debate on it, so it is always better to avoid giving them any such 'distraction point' - like in this case saying " may have been the warmest in more than 500-700 years" instead of "almost 1000 years" - the impact on the reader is the same and deniers will not be able to cling on that point since they already have too much 'invested' in the story with 'little ice age'!quokka at 18:24 PM on 12 November 2011Australia Legislates an Emissions Trading Scheme
"Govt doesn't have a great track record of investing in anything!!!"
Really? How about the Snowy Mountains Scheme, the largest engineering project ever undertaken in Australia and frequently cited as an example of civil engineering excellence. Still operated by a wholly state owned corporation and by the far the most important renewable electricity generator in Australia. On the related issue of "picking winners" think about such things as the Pharmaceutical Benefits Scheme whose purpose is to "pick winners" ie effective medical treatments and ensure they are delivered at affordable cost.bill4344 at 17:37 PM on 12 November 2011Australia Legislates an Emissions Trading Scheme
Phila, I think the word you're looking for is 'Gubmint'. As in 'the gubmint can't do anything right'. It's a little like wondering 'what have the Romans ever done for us?'Phila at 15:40 PM on 12 November 2011Australia Legislates an Emissions Trading Scheme
"Govt doesn't have a great track record of investing in anything!!! The amazing thing about this common-as-dirt received wisdom is that much of the energy-related status quo it's defending exists because of government investment. Surely, some folks in the "government can't do anything right" crowd have affordable electricity because of the TVA. Or Hoover Dam. Or the National Reactor Testing Station. Or the UK's Central Electricity Board. Or government coal and oil subsidies. And don't even get me started on the fact that they're issuing these complaints on the Internet. The cognitive dissonance is just astounding.Bob Lacatena at 15:15 PM on 12 November 2011Increase Of Extreme Events With Global Warming (Basic Version)
15, Eric, The graph is of both named storms and hurricanes, the vast majority of which never reach landfall. Is the implication that no one was able to properly notice tropical storms which grew so large they required names -- without the advent of modern technology? Do you have a citation of a source that explicitly makes the case that hurricanes were under-reported prior to some selected date?skywatcher at 15:08 PM on 12 November 2011Australia Legislates an Emissions Trading Scheme
Nice to see how the goalposts shift, Camburn from "shock value to GDP" to "we should expect to see significant growth in Australian GDP". Does that mean you'll consider the carbon price a failure if Australia's GDP does not grow? As if the carbon price is the only thing that will affect the Aussie economy...muoncounter at 15:08 PM on 12 November 2011Australia Legislates an Emissions Trading Scheme
43 Camburn: "the USA's emissions are more than China's." China passed the US in total carbon emissions in 2006, despite the fact that the US GDP is more than 2x that of China. US leads in per capita emissions.Camburn at 14:56 PM on 12 November 2011Australia Legislates an Emissions Trading Scheme
Of course the USA's emissions are more than China's. Look at the GDP difference and it is self explanatory. The political reality in the USA right now is that no new schems of any kind will be put into effect. The hole that has been dug the past 10 years is so deep that we never in fact dig out of this one. We shall see how the Chinese pilot schemes pan out. Remember it is a few cities and provinces. We should expect to see significant growth in Australia's GDP as a result of passage of this.Bob Loblaw at 14:42 PM on 12 November 20112nd law of thermodynamics contradicts greenhouse theory
There is a whole class of 1-D climate models called "radiative-convective models" that combine realistic radiative calculations (in the vertical) with convective energy transfer constraints on the resulting temperature profile. Tom Curtis mentions the name of Manabe in #1133. Here is a link to one of the classic papers: Manabe and Wetherald (1967) Thermal Equilibrium of the Atmosphere With a Given Distribution of Relative Humidityalan_marshall at 14:42 PM on 12 November 2011Australia Legislates an Emissions Trading Scheme
Those who are cynical about the significance of Australia’s example probably feel that way because they are still in denial about the dangers of climate change. Contrary to Camburn @18’s opinion, China is getting its act together. Australia has received praise from Jiang Kejun, the head of the China’s Climate Commission, who explained that our scheme will be the model for one of six Chinese pilot schemes to be introduced in 2013. Jiang says: Some say what is happening in Australia is even better [scheme design] than in Europe, so in that sense Australia is leading. It is worth remembering that China’s per-capita emissions are still 60% below that of the USA, which bears historical responsibility for more than 3 times China’s total emissions. Unlike the USA, China is not burdened by a major political party in denial.muoncounter at 14:17 PM on 12 November 2011Extreme Events Increase With Global Warming
There is very strong evidence of increased extremes to be found in the Indices of Extremes in the European Climate Assessment and Dataset. The database interface is very user friendly: To generate maps, select 'trend maps,' pick an 'index category,' select a specific index and a time period. Particularly interesting are indices under the category 'Heat,' with maps comparing 1951-1978 to 1979-2010. Here is a two image animation, showing the pair of maps depicting the index TX90p - temperature greater than the 90th percentile of daily max - for 1951-78 and 1979-2010. This index is a measure of 'warm days.' -- source
The map that is primarily green/blue (no trend - decreasing) is the earlier period; the map that is overwhelmingly red is the latter period. Other heat indices show that 1979-2010 saw increasing numbers of summer days, increasing 'warm spell duration index', increasing consecutive summer days and an increase in the max daily temperature. Both the number of warm wet days and the number of warm dry days reversed their 1951-1978 declines, increasing strongly over 1979-2010. This suite of indices demonstrates conclusively that warm days are becoming more frequent, warm spells are lasting longer and are warmer.
However, the number of days with snow depth > 50 cm strongly decreased in Scandinavia while increasing in west/central Europe. This large contrast between nearby regions may exist because weather is becoming more variable, but they are fueling denials based on 'there's snow in my backyard!'
Camburn at 13:17 PM on 12 November 2011Australia Legislates an Emissions Trading Scheme
-- source
The map that is primarily green/blue (no trend - decreasing) is the earlier period; the map that is overwhelmingly red is the latter period. Other heat indices show that 1979-2010 saw increasing numbers of summer days, increasing 'warm spell duration index', increasing consecutive summer days and an increase in the max daily temperature. Both the number of warm wet days and the number of warm dry days reversed their 1951-1978 declines, increasing strongly over 1979-2010. This suite of indices demonstrates conclusively that warm days are becoming more frequent, warm spells are lasting longer and are warmer.
However, the number of days with snow depth > 50 cm strongly decreased in Scandinavia while increasing in west/central Europe. This large contrast between nearby regions may exist because weather is becoming more variable, but they are fueling denials based on 'there's snow in my backyard!'
Camburn at 13:17 PM on 12 November 2011Australia Legislates an Emissions Trading Scheme
skywatcher: Why do you think the shock value will be negative?Albatross at 13:11 PM on 12 November 2011Australia Legislates an Emissions Trading Scheme
Camburn enough with the alarmism and fear mongering already...skywatcher at 13:01 PM on 12 November 2011Australia Legislates an Emissions Trading Scheme
I'm sure we'll watch Australia slide back into the Bronze Age while the rest of the world powers ahead... /sarcasm Meanwhile, the billions of dollars investment in renewables supported by the carbon price will have no impact at all on Australia's GDP?Camburn at 12:52 PM on 12 November 2011Australia Legislates an Emissions Trading Scheme
The USA is years away from implimenting a carbon emission policy. China is importing Aussie coal like mad and burning it. They are also years away from a carbon emission policy. Austrailia is 15 in the world as far as GDP. Will be interesting to watch the shock value to their GDP from the passing of the carbon plan.Eric (skeptic) at 12:46 PM on 12 November 2011Increase Of Extreme Events With Global Warming (Basic Version)
Spharica, those numbers require some explanation of how hurricanes were and are now detected. Here are some interesting graphics: 1921-1980 and 1981-2000Bob Lacatena at 11:56 AM on 12 November 2011Increase Of Extreme Events With Global Warming (Basic Version)
13, Eric, Here is a bar chart of Atlantic storms from the Wikipedia List of Atlantic Hurricane Records. I added the horizontal lines for easy visual comparison to previous years. Notice anything (click the image to see it larger)? Eric (skeptic) at 11:36 AM on 12 November 2011Increase Of Extreme Events With Global Warming (Basic Version)
What I would put in the basic version is an explanation of the types of events that are more likely to occur: heat waves, extreme drought, and extreme rainfall; and those that are more ambiguous like hurricane: probably stronger but fewer; or events like 11/11/11: http://cafnrnews.com/2011/10/midwests-perfect-storm/ triggered by cold/warm contrast (may decrease over time).Tom Curtis at 11:11 AM on 12 November 20112nd law of thermodynamics contradicts greenhouse theory
Fred Staples @112:"[A] sceptical person would do that (ask what was wrong with the multilayer model). He would conclude that he was looking at the problem the wrong way round – bottom up instead of top down."
This is simply wrong headed. It does not matter where you start your calculations with multi-layer models (top or bottom) so long as you iterate until equilibrium is reached, the final result will be the same. Further, with multi-layer models if you want to solve for the equilibrium surface temperature algebraicly, you must start with the outer most layer. Therefore characterizing multi-layer models as "bottom up" models is at best meaningless, and at worst, simply false."The lapse rate, the cooling of the atmosphere with height, something you can observe on your car thermometer, is about 6K per kilometer and it has nothing (or almost nothing, Tom) to do with radiation."
The lapse rate is not a constant 6 degrees C/km. Rather, it depends primarily on the local relative humidity. If humidity is 100%, the lapse rate will be 5 C/km, whereas for dry air it is 9.8 C/km. The lapse rate is also effected by lateral heat transport, which is why in polar winters it is near 0, or even negative. In simplified one dimensional models, the lapse rate is treated as having a single constant value, but that is a simplifying approximation only. It should no more treated as reality than the assumption of point masses in standard Newtonian calculations of gravitational force should be considered evidence that the sun's diameter is zero. More importantly, the role of radiation is not neglible. At all levels of the atmosphere, gross radiative transfers of energy exceed those by convection or latent heat, although net transfers are typically smaller. Indeed, there is a complicated interplay between radiation and convection. Without the radiatively induced lapse rate, the atmosphere would be near equal in temperature at all altitudes, and convection would be limited. Convection is best understood (for these purposes) as a negative feedback on the radiatively induced lapse rate."First consider a single shell model. Simple Algebra..."
You have simply returned to the multi-layer radiative only, emissivity 1 model which I described as "unphysical" above. Why do you inist on this false dilemma of either a purely radiative model or a purely convective (higher is cooler) model. The world does not fit into simple compartments like that. Both radiation and convection are important within the atmosphere. Indeed, I have already described a model which includes both (and which because it does not fit your false dilemma, you ignore)."There is only one snag. For this model to be true the troposphere temperatures must rise earlier and faster than the surface temperatures as CO2 concentrations increase. In a multi-layer model it would be the other way round."
First, there is no "uniquely correct" model of the greenhouse effect. There is a correct physics, the radiative-convective physics discovered by Manabe. That can be modeled by either multi-layer models which track both radiation and convection at each level, or by a simplifying TOA radiation plus lapse rate model. The second is a simplified version and so is not entirely accurate (although it is the best of the simple models). Because both approaches describe the same physics, there is no fundamental difference in their predictions. Second, the tropospheric hotspot is not a direct consequence of the greenhouse effect. Rather, it is a consequence of increased humidity at altitude which is predicted for all warming scenarios. Because the vertical transfer of heat in the atmosphere is rapid, taking days (for radiative transfers) and hours (for convective), the hotspot is most definitely not a consequence of which portion of the atmosphere heats first. And please note, as the lapse rate is a function of humidity, the hotspot is predicted equally by the multi-layer and the TOA plus lapse rate models once the lapse rate is allowed to adjust for humidity changes. To sum up, your entire post consists of nothing but a series of misunderstandings of climate science. You refuse to acknowledge the existence of the type of multi-layer models that are used in GCM's on a regular basis, insisting on a false dilemma between two crude models only used for teaching purposes. Because you insist on that false dilemma, you do not recognize the existence of the models actually most used in climate science, which are mulit-layer, but have the same general properties (though more accurately) of the model you insist we use.GreenCooling at 11:11 AM on 12 November 2011The BEST Summary
Steve, Philippe, Aussie et al, I couldn't agree more strongly, the denier psychology is hard to comprehend, and incredibly frustrating to confront. I've been engaged in a now lengthy debate with some HVAC engineers/technicians over at LinkedIn (on the "HVAC Professionals" group) that has diverged from a question on the relative merits of R410a vs R22 to whether global warming and even ozone depletion are real. These guys livelihoods will depend on their ability to adapt to the impending shift away from HCFCs and HFCs, yet in their processional opinions, everyone here at SkS are leftist propagandists, liberals, morons, politics and philosophy majors and all manner of other unsavory things. In hope of widening the debate, I've started a new discussion featuring the SkS site, probably not even a snowflake's chance in hell of changing the minds of the key protagonists, but the group has a broad audience, and it should help build awareness of the excellent work featured here. Would be great if anyone has time to drop in and lend your 2 cents worth? Steve, I'd love to quote your post 1 at an early point in this new discussion, unless you'd rather drop by yourself? My heartfelt thanks to all for all that you do, please keep up your great and valuable work. Brentskywatcher at 10:54 AM on 12 November 2011Extreme Events Increase With Global Warming
Albatross, that figure is incredibly telling and quite chilling. Roll the dice. Who's next under the 3-sigma browns? Now it's a lot more people than it was 30 years ago. Soon enough it'll be common...Response:[DB] How about some more chillin', then? From the same source:

Figure 4. Frequency of occurrence (y-axis) of local temperature anomalies divided by local standard deviation (x-axis) obtained by binning all local results for 11-year periods into 0.05 intervals. Area under each curve is unity.
dana1981 at 10:51 AM on 12 November 2011The BEST Summary
John H - thanks very much. Tom - I know, we discussed the incomplete final two data points in the blog post from which Figure 2 originated (linked above Figures 1 and 2). For the purposes of that particular graphic, it's a rather minor point (two data points out of thousands), and those two data points were included in "Curry's BEST" graph. I suppose it wouldn't hurt to remove them, if I have the time.skywatcher at 10:49 AM on 12 November 2011Australia Legislates an Emissions Trading Scheme
Others have made the important point that it is not necessarily the global scale impact on climate of Australia's emissions cuts that is at stake here. It is the setting an example, or showing willing that will encourage other major economies to do the same. It's also the case that generally the first step is the hardest - and once investors see greater benefits in renewables than in fossil fuels, then momentum can be built. Another wee piece of good news - the Fossil Fuel Levy, which has been in place in Scotland since 1996, has finally yielded significant funds (£103m) for the burgeoning renewables industry in Scotland, despite some political wrangling. Another £103m is going to the Green Bank which is further supporting renewables investment. The Fossil Fuel Levy has now been replaced by the Climate Change Levy, which taxes non-domestic FF power in the UK - not quite the same as the Australian price on carbon, but a step in the right direction. Still more political will required to move carbon reductions forward still further, but it shows that if you get the building blocks in place, reductions can happen.
Prev 1401 1402 1403 1404 1405 1406 1407 1408 1409 1410 1411 1412 1413 1414 1415 1416 Next


