


 Arguments


Recent Comments
Prev 1416 1417 1418 1419 1420 1421 1422 1423 1424 1425 1426 1427 1428 1429 1430 1431 Next
Comments 71151 to 71200:
-
les at 04:17 AM on 2 November 2011Baked Curry: The BEST Way to Hide the Incline
61 - Dikran Marsupial Just for clarification... I'm a bit confused about what her (or the) Null hypothesis actually is. Surely it's not "no warming". That statement is just "the slope of the line is zero" and 'zero' there is just an arbitrary number, could be any other number. (the zero in no warming is not the same as Null!) I'd have though the null hypothesis should be "the trend in period X is no different to the trend leading up to period X" for some reliable measure of preceding trend. Surely? No? As an analogy. If I wanted to test the breaks on my pushbike, either I could stand next to the thing (bike not moving... [zero] null hypothesis applying the breaks makes no difference to the speed) and squeeze them a 10,000 times (nice low p-value) and go, well the bike isn't moving so they must work. Or I could roll the bike at some speed (null hypothesis; applying the breaks makes no difference to the speed) and squeeze the breaks once (horrid low p-value, illustrating the p-value fallacy while we're at it) and see if the bike stops. -
Ian Forrester at 03:39 AM on 2 November 2011Richard Milne separates skepticism from denial
Shibu, the Judge (yes there is only one supreme judge, Nature herself) has given her verdict since she has observed the following evidence: Arctic ice declining Greenland ice cap is shrinking Species are migrating poleward or to higher altitudes Stratosphere is cooling Carbon dioxide is increasing Science has shown carbon dioxide to be a green house gas The increased carbon dioxide in the atmosphere has a fossil fuel fingerprint So why do you cling to the notion that temperatures are not increasing and even if they are humans are not to blame? -
John Hartz at 03:10 AM on 2 November 2011Sorting out Settled Science from Remaining Uncertainties
To learn more about the SkS Firefox plug-in system, click on the "Software" button embedded in the SkS toolbar. -
John Hartz at 03:08 AM on 2 November 2011Sorting out Settled Science from Remaining Uncertainties
@dana1981 #11: Thanks for the clarification. I now presume that Cliffeking #1 was referring to emails generated by the SkS Firefox plug-in. -
Dikran Marsupial at 02:53 AM on 2 November 2011Baked Curry: The BEST Way to Hide the Incline
Tristan, reporting the outcome of a frequentist hypothesis test is a rather subtle issue, the problem with reporting the p-value is that it is only half the story. It is the probability of observing a statistic at least extreme assuming that the null hypothesis is true. The key point is that the alternative hypothesis doesn't enter into the calculation anywhere, and the probability of observing a statistic at least as extreme under the alternative hypothesis might not be greatly different. The danger if presenting the p-value is that it will be interpreted as the probability that the null hypothesis is true (the "p-value fallacy"). The thing to do is to always interpret the result of the test in the way that provides the least support for the argument you wish to make, and Prof. Curry is doing the exact opposite of that in suggesting that the non-significance of the warming trend is evidence that there is no warming. Like Prof. Pielke she is arguing for the null hypothesis, rather than against it, so she needs to talk about the statistical power of the test to make her case (or to re-frame the test so that warming at the long-term rate is the null hypothesis). -
dana1981 at 02:39 AM on 2 November 2011Sorting out Settled Science from Remaining Uncertainties
SkS also sends out daily emails of links to outside climate stories/studies/etc. These are links which have been added via the SkS Firefox plug-in by those who have it installed and use it. Those people generally keep an eye out for new (or repeated) "skeptic" myths to add to the database. Thus most of the links in the email are from "skeptics". -
Tristan at 02:33 AM on 2 November 2011Baked Curry: The BEST Way to Hide the Incline
Similarly, anyone using classical stats should use p-values or confidence intervals to describe their results. -
Albatross at 02:32 AM on 2 November 2011Baked Curry: The BEST Way to Hide the Incline
Tamino has a new post up challenging Dr. Curry: "You stated explicity that warming has stopped, your latest is vague enough to be satisfied by “slowdown” but the first two say “pause” and “stopped.” Either way — slowdown or stop — you need to provide some actual evidence that the trend has changed. The one thing that nobody has yet seen, is your scientific basis for any of these claims. Question #1: Do you still maintain the above statements? No ambiguous answers, please, it’s yes-or-no for each statement. Question #2: If any answer to #1 is “yes,” then what’s your scientific basis for claiming that the trend post-1998 (or post-2001 or whatever) has changed?" I will be surprised is she provided forthright answers. More likely she will engage in more hand waiving and some other carefully constructed narrative to try and caste doubt or suggest incompetence by someone other than herself. Or she will claim not to understand what the fuss is about, or the meaning of Tamino's post. She tends to do that when confronted with inconvenient facts. -
Dikran Marsupial at 01:46 AM on 2 November 2011Baked Curry: The BEST Way to Hide the Incline
Tom Curtis Yes, the Bayes factor does ignore the prior probabilities, however you can put them back in by multiplying the Bayes factor by the ratio of prior probabilities to give you the ratio of posterior probabilities. However the problem with priors is that a "skeptic" can dismiss the argument by saying that your priors are unreasonable. Equally they could say that solar-tidal forces means that the PDO oscillation ... blah blah blah ... natural cycles mean that the prior ratio for cooling to continued warming is 100. The Bayes factor has the advantage of telling you by how much your prior belief should be altered by the evidence provided by the data. The advantage of the Bayes factor is that it is a continuous measure of the relative support from the data for one hypothesis over another, rather than a binary decision of "satistically significant" or "statistically insigniicant". This means the key problem here, that a non-significant trend not necessarily meaning the null hypothesis being true, doesn't arise as it is clear from a Bayes factor below three. -
Tom Curtis at 01:33 AM on 2 November 2011Baked Curry: The BEST Way to Hide the Incline
muoncounter @43, I see you have found one of the many examples I leave of my inability as a proof reader. I am glad you found a use for my error. -
Tom Curtis at 01:31 AM on 2 November 2011Baked Curry: The BEST Way to Hide the Incline
Dikran Marsupial @50, I dislike likelihood measures because, by ignoring the relative a priori probabilities of two hypotheses, they will often favour the hypothesis with the least a priori probability, while Bayes theorem would favour the other. So, while useful in some applications, likelihood measures are not universally applicable, and I am far from certain that Bayes factor would be applicable in this situation. -
Tom Curtis at 01:25 AM on 2 November 2011Baked Curry: The BEST Way to Hide the Incline
CBDunkerson @49, you are correct that I presupposed the period of the BEST record. Without the caviate, I think the conditions would need to be stated: There exists at least one interval with a statistically significant positive trend such that: a) The period 2001-2011 is a sub-period of that interval, and b) The interval contains no sub-periods with a statistically significant zero or negative trend. Given that these conditions are satisfied, the statistically significant positive trend is a sound scientific reason to accept an underlying positive trend in the interval 2001-2011, and the lack of any sub-periods within that interval (including 2001-2011) with statistically significant zero or negative trends means there are no defeaters for those sound scientific reasons. -
muoncounter at 01:21 AM on 2 November 2011Baked Curry: The BEST Way to Hide the Incline
DB#52: Thanks, I'm considering writing a guidebook. Or possibly offering a kit, containing the decision-making tools found here, here and here. -
Mark Harrigan at 01:08 AM on 2 November 2011Baked Curry: The BEST Way to Hide the Incline
Thanks - great post and also an excellent discussion thread gents. Sadly - this whole debacle simply demonstrates yet again that climate "skeptics" are better labelled "evidence immune" -
John Hartz at 00:53 AM on 2 November 2011Sorting out Settled Science from Remaining Uncertainties
@cliffeking #1 and #8: In your first post you state, "I receive SKS e-mails linking to articles on climate change and wonder why so very many of them (probably 80%)are of a skeptical or denialist nature..." To the best of my knowledge, the only broadcast emails from Skeptical Science are the daily notices about new articles (including the Weekly Digest) that have been posted on SkS. Your claim that 80% of this material is "skeptical" or "denialist" does not make sense to me. -
Daniel Bailey at 00:49 AM on 2 November 2011Baked Curry: The BEST Way to Hide the Incline
@ muoncounter Congratulations! You've just earned another bookmark in my file of New Climate Definitions. cli·ma·strol·o·gy/klīˈməˈsträləjē/ Noun: The study of the lack of evidence of that which hasn't happened within the field of climate science. -
Sasquatch at 00:40 AM on 2 November 2011Yes, It's Still Us, and It's Still Bad
Dana1981, has the post gone up yet? -
Sasquatch at 00:39 AM on 2 November 2011Yes, It's Still Us, and It's Still Bad
Thanks, all. I was just asking as I try to wrap my head around this. -
muoncounter at 00:31 AM on 2 November 2011Baked Curry: The BEST Way to Hide the Incline
Tom C#43: "Curry is not wrong. She is egregiously in error." This fits the conditions of 'wronger than wrong;' the scientific equivalent to any of these. -
Dikran Marsupial at 00:28 AM on 2 November 2011Baked Curry: The BEST Way to Hide the Incline
muoncounter it may not be a trend, but it is significant! ;o) dana1981 I am in complete agreement. Even giving Prof. Curry the benefit of the doubt, her comments do her little credit. It doesn't overly surprise me that scientists don't do a good job of communicating the science, the really susprising thing is that they have not actually performed the required statistical test of their hypothesis. Bob Loblaw ;o) I once read a microbiology paper where a "quadratic response surface" was fit to two points with one independent variable! Fortunatly the software wisely decided that the coefficient of the squared term was zero (which was faithfully written down in the equation for the model). Tom Curtis Nice comment. Perhaps the Bayes factor, which gives the ratio of the support from the data for two hypothesis (taking the uncertainties into account), would be a better approach. If the Bayes factor is less than three the evidence is generally considered "barely worth mentioning", which I suspect would sum up the 2001-present trend. Gary Thompson Simple, we have a decent grasp of basic statistics principles and know that the eyecrometer is not a reliable instrument in detecting relatively small magnitude signals in the presence of noise. -
CBDunkerson at 00:26 AM on 2 November 2011Baked Curry: The BEST Way to Hide the Incline
Tom Curtis wrote: "The period 2001-2011 is not a sub-period of any interval with a statistically significant zero or negative trend." Presumably you intended this to refer just to the duration of the BEST record, but without that caveat being explicitly stated there are technically very large intervals (e.g. the past 50 million years) for which it would not be true. Here's a thought... when was the last statistically significant zero or negative trend within the confines of the BEST record? I'm guessing that it was decades ago. -
muoncounter at 00:22 AM on 2 November 2011Baked Curry: The BEST Way to Hide the Incline
Tom C #35: If I may repeat your points with a minor correction, "1) We have strong evidence from medium term trends (greater than 17 years) that the temperature trend is close to 0.27 degrees C; 2) No short term trends provide evidence significant enough tobringsuggest the evidence in (1) is misleading about the future temperature trend." I agree with your statements 1 (where the stated trend is in deg C per decade) and 2; a most cogent and compelling summary. The implication of (2) is clear: it is nonsensical to go on about 'there is evidence for a change in trend' or 'there is no evidence that the trend hasn't changed.' In the first case, because it is incorrect; in the latter case, there is no evidence that a lot of things have not happened; what kind of science deals with that? Unfortunately, those who are in denial must find something to deny, so they will go on with this nonsense. That leaves them to practice their chosen field: pseudo-skeptic climastrology, which now includes the study of the lack of evidence of that which hasn't happened. -
Bob Lacatena at 23:59 PM on 1 November 2011Baked Curry: The BEST Way to Hide the Incline
38, garythompson,...how can you look at this graph and say that warming has not stopped.
You are so right! Take a look at this graph. Warming hasn't merely stopped, but cooling has started. In fact, cooling started back in 1973 and the globe has cooled since. The fact is that all trends are negative since 1973, without pause, and therefore the inescapable conclusion is that there has never been any warming. [Hint: A "skeptic" can pick any point in time in the past 30 years and prove that the globe is cooling. What does that tell you?] Albatross: Sorry. I missed your request for this back at comment #5.
-
Kevin C at 23:40 PM on 1 November 2011Baked Curry: The BEST Way to Hide the Incline
Tom said:a) The period 2001-2011 is a sub-period of an interval with a statistically significant positive trend of approx 0.27 degrees C per decade; and b) The period 2001-2011 is not a sub-period of any interval with a statistically significant zero or negative trend.
Wow. Logical reasoning is hard. Much harder than spotting the flaws in other people's reasoning. But you nailed it here; that's one for the quote file. -
Shibui at 23:13 PM on 1 November 2011Richard Milne separates skepticism from denial
I've heard some of these analogies before ... anyway, we just have to await the judges' decisions. -
CBDunkerson at 22:47 PM on 1 November 2011Baked Curry: The BEST Way to Hide the Incline
You know, I read Curry's statement, "This is 'hide the decline' stuff", and immediately thought; 'what, you mean people grossly misrepresenting the data?' She then proceeded to grossly misrepresent the data. So... I agree with Judith Curry. This is 'hide the decline stuff'. The same sort of nonsense as the claims that 'hide the decline' referred to a decrease in global temperatures, rather than the divergence problem in recent tree ring proxies. That Curry is still promoting that old falsehood, and now 'shoring it up' with new misrepresentations places her towards the bottom of the 'Scientific' Denier Credibility Scale. Somewhere around Spencer's level I'd say (i.e. higher than Singer / lower than Pielke). -
Bernard J. at 22:18 PM on 1 November 2011SkS Weekly Digest #22
Logicman's upcoming piece should be interesting, although with the current (and growing) furore over at WUWT, he might be forced into a few quick re-writings in order to keep up with the gathering pace of the spittle flying over there. And Watts might want to keep an eye on some of his sycophants. Some of their guff is skirting toward libel. -
Philip64 at 21:09 PM on 1 November 2011Baked Curry: The BEST Way to Hide the Incline
An excellent and timely piece. I think it's a good thing that Curry et al are nailing their tattered colours so firmly to the mast of warming having stopped. It's become increasingly obvious to everyone that it hasn't; and this conviction is likely to deepen with time. Curry and her ilk can only cherry pick these figures for so long before there are no cherries left on the tree - and no fig leaves either... -
Tom Curtis at 20:49 PM on 1 November 2011Baked Curry: The BEST Way to Hide the Incline
Rickoxo @41: 1) I am uncertain what Muller "admitted" about the last 13 years of BEST data, because the claim is made by David Rose who has a reputation for gross distortions and inaccuracy. Nor does Rose give us the complete quote, but only partial quotes as part of his narrative, a classic method of spinning quotes out of context to give a false impression. 2) Assuming Muller "admitted" that "world temperatures have not risen for about 13 years" (Rose's words), then he admitted a falsehood, which would strongly suggest he is not even familiar with his own data, which I find highly unlikely. Below is a detail of the last few years of the BEST temperature index taken from the methods paper (PDF): The BEST data is given in black, with HadCRU (blue), GISS (green) and NOAA (red) also shown. The grey vertical line is 2000. The inner yellow box shows the data plotted by the GWPF, while the outer yellow box shows the last 13 years. Very clearly, had the plot by the GWPF included data from 1997 (13 years), it would have shown a significant positive trend. Indeed, a termination at 2001 is the longest interval they could have included and still retained near zero trend. This gives the lie to David Whitehouse's claim that,
 "Incidently you could extend the graph back a few years before 2001 and it doesn't make much difference because the 'super el nino' of 1998 and the two subsequent cooler years of 1999 and 2000 do not show up as dramatically in the Best land data as they do in HadCrut3."
More importantly it shows that claims that "world temperatures have not risen for about 13 years" (David Rose) are simply false, whether Muller concurred or not. 3) Muller's purported claim that "this might not be ‘statistically significant’, although, he added, it was equally possible that it was" (David Rose) are hardly mystifying. If that is indeed what Muller said, it merely means he has not calculated the statistical significance of the trend for what ever interval of data Rose asked him about. If he has not made that calculation, or seen it done, his claims about global warming having stopped for 10 years are not made based on the full available evidence. But that is irrelevant to discussion here, because Tamino has made the calculation, and made the results publicly available so we know that Muller's claim (about the 10 years) was true regardless of whether he himself was justified in making it. These possibilities do not paint Muller in an attractive light, but his character flaws are nothing new in the climate change debate. Regardless of his known flaws, given the source of the truncated quotes, I would be very loath to assume Muller had not made the relevant analysis to justify his comments without verification from his own mouth. 4) Muller's statement about the 10 years was made on October 21 to the BBC. The purported statements about the 13 year period where made sometime on October 29th, or later. Therefore those later comments provide no context from which to understand his earlier comments. Any inference from the later comment that in the earlier comment he was speaking about the 10 years data to the exclusion of any other relevant information is unwarranted. 5) Curry's statement as quoted by the Mail (and explicitly not disavowed by her on her blog) was:"There is no scientific basis for saying that warming hasn’t stopped"
As copiously shown by Tamino, there is a scientific basis for saying the warming hasn't stopped. That scientific basis is that: a) The period 2001-2011 is a sub-period of an interval with a statistically significant positive trend of approx 0.27 degrees C per decade; and b) The period 2001-2011 is not a sub-period of any interval with a statistically significant zero or negative trend. (a) provides a sound scientific reason to believe the underlying trend in that period is positive, and near 0.27 degrees C per decade. (b) shows that the sound scientific reason in (a) is not defeated by any counter-evidence. The two combined give us a very sound scientific reason for saying the warming has not stopped. In fact, the case is stronger when known physics is included, but that is beside the point. Based purely on the statistics, Curry is not wrong. She is egregiously in error. Sufficiently so that we must either doubt her competence or honesty to explain the error. 6) (And finally), you are corect that Curry did not prepare the graph, and I apologize for my error. However, Curry was shown the graph, and does not disavow it. Further, her comments where made in reference to the graph. Consequently my points made above still stand. -
monkeyorchid at 19:01 PM on 1 November 2011Richard Milne separates skepticism from denial
@shibui, post 29 "you have to be able to prove the issue down to the last detail, not just expect that the public will take it on trust... because they won't, and rightly so." By this logic, there would not be a single criminal in prison, anywhere in the world. Hardly anything is ever proved down to the last detail, the phrase normally used is "beyond reasonable doubt" ... and climate change has certainly been proved to that degree. Mouncounter (38) is spot on - Shibui's statement is a manifesto for absolute paralysis. If you had a fatal illness and weeks to live, and doctors had a cure that they were 99% sure would work, would you say, "no thanks, I'll wait till they're 100% sure"? -
scaddenp at 18:14 PM on 1 November 2011Sorting out Settled Science from Remaining Uncertainties
You learn something everyday. I didnt know you could receive email from SkS. I found it now. Thanks/ -
Tom Curtis at 17:57 PM on 1 November 2011Baked Curry: The BEST Way to Hide the Incline
Rob Painting @40, short term trends are known to uninformative, but short term trends from start points carefully selected with a predetermined result in mind, from a carefully selected data set when other equivalent data sets do not show the same thing, and when the data set selected is known to be biased in favour of the view of the person selecting the data are even less informative. Consequently Thompson's carefully selected period of a CRU graph tells us far more about him than future temperature trends. -
Rickoxo at 17:55 PM on 1 November 2011Baked Curry: The BEST Way to Hide the Incline
Tom, Ok, I get your take on #2, but near the end of the article, the Daily Mail wrote: However, he [Muller] admitted it was true that the BEST data suggested that world temperatures have not risen for about 13 years. But in his view, this might not be ‘statistically significant’, although, he added, it was equally possible that it was – a statement which left other scientists mystified. This is why it seems like his original statement was about this same period, that's why Curry picked and after Curry responded, he was challenged on what he had said earlier. Please don't hear me saying I know what the Daily Mail wrote was true. There seems to be some serious push back from both Curry and Muller that the various articles didn't faithfully report what they said. But no one has challenged Muller's original statement and his response fits with other things he said. So, it seems like the best evidence shows him talking about the same rough period Curry responded to. As for Curry not being technically right, what is inaccurate about what she said? There's no way to think she didn't mean statistically significant, it's the whole point she's trying to make and it's the exact point Tamino makes critiquing her. Data from last week doesn't prove or disprove global warming, it's stupid to ask if it does. Data from the last ten years doesn't prove or disprove global warming, it's too small of a period of time. But Muller made the first comment and Curry simply pointed out it was a stupid statement, as well as a few other stupid things he had said (now there's no cause for skepticism when there used to be ...) One last thing Tom, I don't know why you're attributing the graph the Daily Mail printed to Curry. She never mentions it on her blog, she makes comments on her blog that make it sound like she understood that the last two data points in the data set were problematic and she never presents that graph anywhere. I was just doing some checking and one of the articles attributes the second graph showing no temperature rise to "a report to be published today by the Global Warming Policy Foundation". So when you say Curry picked out that special under ten year window, she didn't pick that cause it's not her graph. Last, regarding your comment at the end, Curry specifically says the data set project has nothing to do with physics, El Nino's, La Nina's or anything else other than providing the most accurate and accessible record of land temperature data. She wrote, "Our study addressed only one area of the concerns: was the temperature rise on land improperly affected by the four key biases (station quality, homogenization, urban heat island, and station selection)?" To say she's wrong because she isn't referencing something that is entirely outside the scope of the BEST project isn't fair. -
Rob Painting at 16:31 PM on 1 November 2011Baked Curry: The BEST Way to Hide the Incline
garythompson @ 38- why do you comment on a post you don't even appear to have read? This is about the BEST global temperature data. Note Figure 4 and comment @ 1 by Dikran Marsupial. Simply put: short-term trends aren't very informative of long-term trends. What happens when the surface oceans switch to a warm phase (El Nino), or the dimming effect of pollution aerosols is overwhelmed by greenhouse gases? That's why a mechanistic understanding is important too, and why SkS stresses the importance of looking at the whole picture. -
Stevo at 16:17 PM on 1 November 2011Baked Curry: The BEST Way to Hide the Incline
garythompson @38 Simple, by looking at the long term data and reconciling it with observations such as ENSO and solar cycle. How can you say warming has stopped when the Arctic ice cap has melted to its smallest extent in recorded history twice in the last five years? How can sea level rises in Tuvalu and Kiribati be explained if warming has stopped. Please read the article and comments in full. -
cliffeking at 16:09 PM on 1 November 2011Sorting out Settled Science from Remaining Uncertainties
@ John Hartz#4 Seeing as I signed up to receive e-mails from this very site and have not signed up to any of the far-too many denier sites, I think that, yes, the e-mail links are from SKS. Anyway, HTH has provided an explanation for this above. -
garythompson at 16:02 PM on 1 November 2011Baked Curry: The BEST Way to Hide the Incline
You guys are really < -snip ->. how can you look at this graph and say that warming has not stopped.Moderator Response:[DB] Please note that posting comments here at SkS is a privilege, not a right. This privilege can and will be rescinded if the posting individual continues to treat adherence to the Comments Policy as optional, rather than the mandatory condition of participating in this online forum.
Moderating this site is a tiresome chore, particularly when commentators repeatedly submit offensive or off-topic posts that demonstrate that they have not bothered to read the OP of the thread that they are commenting on. We really appreciate people's cooperation in abiding by the Comments Policy, which is largely responsible for the quality of this site.
Finally, please understand that moderation policies are not open for discussion. If you find yourself incapable of abiding by these common set of rules that everyone else observes, then a change of venues is in the offing.Please take the time to review the policy and ensure future comments are in full compliance with it. Thanks for your understanding and compliance in this matter.
-
Albatross at 15:09 PM on 1 November 2011Baked Curry: The BEST Way to Hide the Incline
Hi Rick @34, I'm sorry, but you seem to be under the impression that repeating claims makes them true. It doesn't. The primary subject of this thread is Judith Curry, not Dr. Muller. Additionally, the only people posting the alleged comments made by Dr. Muller are some "skeptic"/denier sites, David Rose and you here. So I have to question the validity of the alleged statement by Muller and would like to see a transcript of the radio interview before accepting what he is alleged to have said. The fact remains that that Tamino offered a detailed statistical analysis to make his points. In stark contrast, Curry has not offered any scientific or statistical evidence to support her assertion that: “There has been a lag/slowdown/whatever you want to call it in the rate of temperature increase since 1998.” I do agree with you that Curry's claim that "There is no scientific basis for saying that warming hasn’t stopped.", is "meaningless and useless for intelligent discussion." Someone has already explained the logical fallacy of your claim that Muller's and Curry's claims are logically identical here, you might also wish to read this post by Tom Curtis. "Curry called him on it, argued that the exact same data he cited could be used to say the exact opposite of what he said" Not true. Curry has "called" Muller other things too, at least she suggested that he tried to hide the decline. A serious allegation that is not supported by the data and proper statistical analysis. As has been shown here and at Tamino's that claim is not true. If you have not yet read Tamino's post (it seems that you have not, at least not in detail) then I suggest that you do so. You can find it here. "she was embarrassed he would put out such a misleading statement." Judith Curry has a great deal many other very real reasons for which she should be embarrassed, and they pertain to her own musings and actions. "Her position was simply, don't over-speak, we just put out the most accurate, reliable data set to date, let it speak for itself." That is not true either. Her position is to caste doubt and inflate uncertainty, and she is not letting the data speak for itself, she is making unsubstantiated and demonstrably false claims about the data. As Tamino noted though, "It looks like the “uncertainty monster” decided to turn around and bite her on the ass.". That statement by Tamino really does sum things up nicely about Judith Curry on this one. Have you tried to make these same arguments to Tamino? I'd be interested to see what he has to say about your claims. "It seems seriously inconsistent to hammer on Curry but not put the blame on Muller who started it. " This is now beginning to sound like a schoolyard tiff-- "but he started it first!". Except the basis for that claim is only traceable back to highly questionable sources-- I would not believe anything that David Rose writes Rick. That we are having to "debate" this BS is beyond me, and why you feel compelled to try and distract from Dr. Curry's despicable and unprofessional behavior is also beyond me. Or is this your attempt to fabricate debate and controversy and/or derail the thread Rick? -
Tom Curtis at 14:51 PM on 1 November 2011Baked Curry: The BEST Way to Hide the Incline
Rickoxo @34, taking your questions in order: 1) Yes, Muller made his statement first. 2) No, Muller was (probably) talking about the whole body of evidence. The trend from 1975 to current is just as much evidence about what will happen in the future as the trend from 2000 to present. Muller chose not to ignore that evidence, and to make his statement based on the whole of the evidence before him. 3) No. Curry explicitly only talks about the period from January 2001 to May 2010, a period of just under 10 years. It is important to her case that she uses just under 10 years, rather than 10 years or 12 years. Had she used either of the longer periods, a clear (but not statistically significant) positive trend would have been present. Finally even if we confine ourselves to consideration of just the last 12 years data, we can only conclude that global warming has stopped by ignoring the physics. We know from evidence in the last 12 years that early in that period we had frequent El Nino's, whereas since 2008 ENSO has tended to La Nina's. We know that El Nino's result in warmer years, and La Nina's result in cooler years. We know that solar activity has reduced over the last 12 years to levels not seen since 1910, so much so that some solar physicists are predicting a new maunder minimum. Therefore we know that without an significant warming factor temperatures would have declined drastically over the last 12 years, instead of remaining fairly constant. That they have not is clear evidence of a countervailing warming force that will restore warming once the ENSO cycle switches to neutral or El Nino's. In essence, Curry has taken a line with troughs and peaks, and drawn a line from a peak to a trough and insisted that that is the trend. We don't need to know statistics to know that that is garbage. -
Tom Curtis at 14:35 PM on 1 November 2011Baked Curry: The BEST Way to Hide the Incline
muoncounter @33, with respect, I believe I was making the same logical point that Tamino made with his entire post, not just one graph. Using Tamino's preferred ARMA(1,1) model, the uncertainties of successive trends to March 2010 in BEST data are as follows: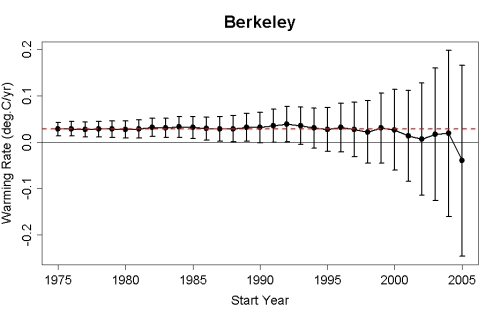 You can see from that that if we only had the data from 1993 onwards, we could not say with certainty that the underlying trend was positive, let alone that it was close to 0.27 degrees C per decade. Given that, we would still be in the position to say that "not one single start year gives an estimate which contradicts" a rate of 0.27 degrees C per decade. But we would also be in a position to say that "not one single start year gives an estimate which contradicts" a rate of -0.01 degrees C per decade.
As it happens, we are in a position to say something far stronger than that, ie, that the underlying trend is very likely (greater than 0.95 probability) to be close to 0.27 degrees per decade. We are in that position because the trend from 1992 to May 2010 is also evidence regarding that underlying trend. And so on for the years that go back. (We can also say that for reasons of physics, which are more important that mere statistical reasons, but that is beside the point here.)
Perhaps it would be more accurate to state Tamino's point this way:
1) We have strong evidence from medium term trends (greater than 17 years) that the temperature trend is close to 0.27 degrees C;
2) No short term trends provide evidence significant enough to bring suggest the evidence in (1) is misleading about the future temperature trend.
I believe you are focusing on (2), but logically, without (1), (2) is largely irrelevant.
(I do not exclude the possibility that we are merely talking at cross purposes.)
You can see from that that if we only had the data from 1993 onwards, we could not say with certainty that the underlying trend was positive, let alone that it was close to 0.27 degrees C per decade. Given that, we would still be in the position to say that "not one single start year gives an estimate which contradicts" a rate of 0.27 degrees C per decade. But we would also be in a position to say that "not one single start year gives an estimate which contradicts" a rate of -0.01 degrees C per decade.
As it happens, we are in a position to say something far stronger than that, ie, that the underlying trend is very likely (greater than 0.95 probability) to be close to 0.27 degrees per decade. We are in that position because the trend from 1992 to May 2010 is also evidence regarding that underlying trend. And so on for the years that go back. (We can also say that for reasons of physics, which are more important that mere statistical reasons, but that is beside the point here.)
Perhaps it would be more accurate to state Tamino's point this way:
1) We have strong evidence from medium term trends (greater than 17 years) that the temperature trend is close to 0.27 degrees C;
2) No short term trends provide evidence significant enough to bring suggest the evidence in (1) is misleading about the future temperature trend.
I believe you are focusing on (2), but logically, without (1), (2) is largely irrelevant.
(I do not exclude the possibility that we are merely talking at cross purposes.)
-
Bob Loblaw at 14:34 PM on 1 November 2011Pielke Sr. and SkS Dialogue Final Summary
A few odds and ends - it has been a busy day, so time is limited. Tom: I'd disagree that OHC content has no implications for future climate. Sea Surface Temperature (SST) is strongly linked to ocean temperature - at least for the mixed layer. How and where in the ocean the heat accumulates affects SST, which affects large parts of the climate system during the period of transition as TOA radiation returns to balance. I agree with your statement of the importance of TOA radiation, and the importance of SST on climate, but personally I think it is unlikely that increased flux of energy into the ocean surface would be exactly balanced by increased flux to depth, so that SST would remain the same. I would more expect that SST would rise, leading to increased flux of heat into the ocean - even if there is increased mixing by factors such as wind. Just a hunch, though. Tom and Victull: one aspect of the idea that OHC be the "primary" metric is that OHC is really mainly answering just one question: where does the heat that accumulates due to the TOA imbalance end up? Measuring OHC really doesn't help a lot to find out how the heat gets into the ocean, and that is the fundamental question for understanding the climatology of the issue, which is what we need to know to make predictions and improve models. To make what might be a bad analogy: the indicator that tells you what illness you have may not tell you what to do to cure it or prevent it - for that you need additional information that helps you understand the disease, not just test for it. -
Rickoxo at 14:12 PM on 1 November 2011Baked Curry: The BEST Way to Hide the Incline
I had posted about this over on the no warming since 1998 thread but this specific argument seems to be taking place here. I posted a question there (124) that while it got a number of responses, it at least seems to me that they missed the basic point. According to the daily mail article, Muller made the following statement before Curry made any public statement. When asked about recent data showing global warming has stopped, Muller answered, "There is no evidence of it [global warming] having slowed down." The first part of this is timing. At least from what I understand, Muller made his comment first, before Curry, so Curry's comment is a response to Muller. Is that accepted as true? Second, Muller said there is no evidence of global warming having slowed down, is it accepted that he meant that statement in relation to recent climate data (i.e. roughly the last 12 years)? When Curry responded to Muller, is it accepted that when she says, ‘There is no scientific basis for saying that warming hasn’t stopped’ that she's talking about roughly the last 12 years? So Muller spoke first and said: there is no statistically significant scientific evidence looking at data from the last 12 years proving global has slowed down. Curry responded saying: there is no statistically significant scientific evidence looking at data from the last 12 years proving global warming hasn't stopped. 1. From what I can tell, those two statements are accurate restatements of what they said. 2. Those two statements are logically identical. 3. Both are technically true. 4. As Tamino and many others point out, both are meaningless and useless for intelligent discussion. Whatever people think about Curry or other things she may have said, Muller spoke first and made the first meaningless, misleading statement. Curry called him on it, argued that the exact same data he cited could be used to say the exact opposite of what he said and that she was embarrassed he would put out such a misleading statement. Her position was simply, don't over-speak, we just put out the most accurate, reliable data set to date, let it speak for itself. No matter what you think about the bigger argument, Muller made a technically true but meanignless statement in talking to the Daily Mail reporter. He could have simply said 10-12 years is too small of an amount of time to know anything about what's happening with global warming, he could have talked about decadal fluctuations, but he started the "there is no evidence" ball rolling. It seems seriously inconsistent to hammer on Curry but not put the blame on Muller who started it. -
muoncounter at 14:05 PM on 1 November 2011Baked Curry: The BEST Way to Hide the Incline
Tom C#26: "the point of Tamino's post." I find that tamino is making a much stronger point than you've highlighted. In the text surrounding this graph, he speaks directly to Dr. C:
"The red dashed line shows the trend rate from 1975. Note that not one single start year gives an estimate which contradicts that rate. That is evidence — damn strong evidence in fact — that the underlying trend rate has not changed since 1975. Hey Judith: there’s a REAL scientific basis for you."
--emphasis in originalI think that's the key point: The uncertainties in the trends calculated from the more recent data values are so large that we cannot say with confidence that any such change has occurred. In other words, we have no evidence of that change; on the contrary, we have evidence that it has not changed. This is still a signal processing problem. Until we can separate the signal (the trend) from the noise (short term variations), we should not be fooled into thinking that noise is signal. That was exactly what Dr. Pielke insisted we should be doing: to ignore the obvious that the warming of the lower troposphere has halted, when averaged over the time period 1998 (or 2002) to the present, ignores the obvious signal in the data. That's only true if you like the noise more than you like the signal.
-
Tom Curtis at 14:05 PM on 1 November 2011Baked Curry: The BEST Way to Hide the Incline
NewYorkJ @29, yup, his retrodiction that in April 2010, the globe would shrink so that it would only include Antarctica was right on the money. -
actually thoughtful at 14:02 PM on 1 November 2011Sorting out Settled Science from Remaining Uncertainties
I fear a return of solar activity, as the deniers will then say it is the sun now, it was the sun, and it will always be the sun. A little bit of luck could turn this either way (ie a heat wave/El Nino in the US before the next election would put global warming back on the agenda; a strong solar showing could feed the deniers for years). -
Stevo at 13:55 PM on 1 November 2011Baked Curry: The BEST Way to Hide the Incline
scaddenp @30 Thankyou for that. I'll refer any further questions to the appropriate thread. -
scaddenp at 13:45 PM on 1 November 2011Baked Curry: The BEST Way to Hide the Incline
Note that there are several sub-heading articles on "temperature record in unreliable" covering proxy records. Thermometer records have issues with screens, time of day, recording interval, height etc. For the GHCN stations are homogenised by procedures which are linked at GISTEMP site. A tougher call is why would it show a warming bias? However, this is best discussed on the appropriate thread. The point of BEST is that the best effort by skeptics have yet to show reason to reject GISTEMP. If warming is just an instrumentation problem, then explain the satellite MSU readings, glacier retreat and sealevel rise which broadly agree. -
NewYorkJ at 13:40 PM on 1 November 2011Baked Curry: The BEST Way to Hide the Incline
Wow, look at that decline. Maybe that McLean fellow was right after all... -
Stevo at 13:26 PM on 1 November 2011Baked Curry: The BEST Way to Hide the Incline
scaddenp @27, I used the "temperature record is unreliable" thread yesterday. I suspect I might be being "trolled" but have passed on your request for exact claims and specific sources and thank you very much for your kind offer to assist. An article I was refered to was at WUWT entitled 'the metrology of thermometers'. Of course it read to me as sounding like "we reserve the right to ignore any instrument readings we dislike because they were probably inaccurate". -
scaddenp at 13:05 PM on 1 November 2011Baked Curry: The BEST Way to Hide the Incline
Stevo - go here (taxonomy) and look at articles around "temperature record is unreliable" right at the top. If you dont find the answers you want there, how about some more exact claims (and their source) and we could look at it.
Prev 1416 1417 1418 1419 1420 1421 1422 1423 1424 1425 1426 1427 1428 1429 1430 1431 Next


