


 Arguments


Recent Comments
Prev 1420 1421 1422 1423 1424 1425 1426 1427 1428 1429 1430 1431 1432 1433 1434 1435 Next
Comments 71351 to 71400:
-
dana1981 at 14:05 PM on 30 October 2011SkS Weekly Digest #20
The content of the post contradicts the "scientific robustness" claim too, trying once again to blame global warming on the all-but-dead galactic cosmic ray hypothesis. Basically calling Dr. Muller stupid while themselves making a really dumb argument. -
Albatross at 13:14 PM on 30 October 2011SkS Weekly Digest #20
Another defamatory depiction of Dr. Muller curtesy of Dr. Pielke Senior's friend and colleague Anthony Watts at WUWT. Yet, Dr. Pielke continues to assure us that Anthony Watts is "devoted to the highest level of scientific robustness".
-
muoncounter at 12:41 PM on 30 October 2011The BEST Kind of Skepticism
BEST's FAQ page tackles the meme we've heard a lot lately: Has Global Warming Stopped? The graph shows the results of our analysis with 1-year averaging (to smooth it) for the last 6 decades
Their conclusion: the decadal fluctuations are too large to allow us to make decisive conclusions about long term trends based on close examination of periods as short as 13 to 15 years.
The graph shows the results of our analysis with 1-year averaging (to smooth it) for the last 6 decades
Their conclusion: the decadal fluctuations are too large to allow us to make decisive conclusions about long term trends based on close examination of periods as short as 13 to 15 years.
-
Tom Curtis at 12:27 PM on 30 October 2011Pielke Sr. and SkS Dialogue Final Summary
Camburn @35, Dana noted above Dr Pielke's abuse of imprecision about statistical significance. You show the same pattern. In particular, while it is possible to draw a line from a point inside the 2004 1 sigma error bars and a point inside the 2011 1 sigma error bars which is flat, trend lines are not determined by drawing a line from peak to peak, still less from peak to trough as is so often done by so-called "AGW skeptics". Because of the relatively low 2006 values on that graph, a trend line from 2004 to 2011 would rise. -
Tom Curtis at 12:18 PM on 30 October 2011Pielke Sr. and SkS Dialogue Final Summary
Camburn @24, I have responded to your points elsewhere, where the comments are on topic. In brief, I show a graph of the BEST temperature results for CONUS showing a positive linear trend over the last 100 years. The graph matches the pattern shown inline by DB @24. I also point out the need for spatially homogeneous sub-samples to avoid distortions, a requirement not met by the BEST sub-sample on which you relied. Please respond on the other thread. -
Tom Curtis at 12:13 PM on 30 October 2011The BEST Kind of Skepticism
Elsewhere Camburn is trying to maintain that BEST shows that temperatures have not risen in the contiguous states of the United States (CONUS). Unfortunately for him the BEST program includes a paper analyzing the difference in trends between OK and Poor climate stations as rated by Anthony Watts'Surface Station Project: As can be clearly seen, CONUS shows a warming trend over the 20th century. There are three statistically significant phases - a warming trend from 1900 to the 1930's, a cooling trend from 1940's to the 1970's, and a warming trend since then. The three warmest periods all fall within the last 15 years.
What is not so clearly seen, because their patterns are so close, is that the poor stations as rated by Watts show a smaller warming trend than do the OK stations. That is something worth noting.
Also worth noting is that Camburn's discussion of CONUS was a distraction after he was shown to incorrectly describe the BEST results for the entire world. On that point he defends himself by saying:
As can be clearly seen, CONUS shows a warming trend over the 20th century. There are three statistically significant phases - a warming trend from 1900 to the 1930's, a cooling trend from 1940's to the 1970's, and a warming trend since then. The three warmest periods all fall within the last 15 years.
What is not so clearly seen, because their patterns are so close, is that the poor stations as rated by Watts show a smaller warming trend than do the OK stations. That is something worth noting.
Also worth noting is that Camburn's discussion of CONUS was a distraction after he was shown to incorrectly describe the BEST results for the entire world. On that point he defends himself by saying:
"GISSTEMP tells us that the number of sites used is not important. The BEST data in the reconstruction that you are talking about should match fairly closely the other sites used."
Of course, what GIStemp shows us is that reasonably sized spatially homogenous sub-samples of the data will show the same pattern. The BEST data set on which Camburn based his claims (a randomly chosen sample of 2000 stations excluding all stations used by GHCN, Hadley/CRU, or GISS) is not a spatially homogenous sub-sample. On the contrary, it shows significant spatial bias because of the very heavy bias in the station quantities towards North America and Western Europe, a bias exacerbated by the exclusion of the overlapping stations. -
michael sweet at 11:45 AM on 30 October 2011The BEST Kind of Skepticism
Why do the BEST results seem to stop at the start of 2010 instead of going up to the present like all the other data sets? That makes the graph end on a cold month instead of the hottest year. Since GISS and NCDC both have 2010 as the hottest year, this ending month biases the BEST graph low, especially to lay people using their eyecrometers. Since everyone else has the data presumably BEST had it also. -
dana1981 at 11:42 AM on 30 October 2011Pielke Sr. and SkS Dialogue Final Summary
Even Dr. Pielke has admitted that the upper 700 meters of OHC warmed since 2003, and of course when we include the deeper layers, the warming is even larger. All of this is discussed in the post above. Camburn seems determined to deny this, but the thing about denial is that it doesn't change reality. -
dana1981 at 11:28 AM on 30 October 2011Hansen's 1988 prediction was wrong
dging, see the final figure in this post (although it uses 3°C sensitivity, not 3.4°C. As you can see, the result is that the projection is a bit low). -
Composer99 at 10:52 AM on 30 October 2011Pielke Sr. and SkS Dialogue Final Summary
Camburn: The Skeptical Science team has carefully laid out the remaining points of disagreement between themselves and Dr Pielke. If you have anything to add to this post pertaining to those points of disagreement which you feel bolsters Pielke's position, please share it. Assuming, of course, that you have the goods (empirical evidence or solid statistical reasoning). There are, if memory serves, three other threads on BEST. Please take any quibbles regarding the BEST results to them. -
Bob Loblaw at 10:52 AM on 30 October 2011Pielke Sr. and SkS Dialogue Final Summary
Re: Camburn @ 35 when you enlarge the photo, you will see that a flat reading is very possible within the error bars of the 0-2000M readings. ...and it is also possible to place a very steep line within the same short period of data (with error bars) - much steeper than the long-term statistically-significant trend. But that would be cherry-picking, not science. At the very least, it's good to know that you know about errors bars on regression slopes. Please stop abusing them. -
Bob Loblaw at 10:47 AM on 30 October 2011Pielke Sr. and SkS Dialogue Final Summary
Although I've been reading SkS for a while, I've only recently begun posting here, and the discussions with Dr. Pielke have been interesting. (I've also been involved with discussions with him at RealClimate, which followed similar patterns, but we'll stick to the discussion at SkS here.) As a general comment on the exchanges with Dr. Pielke, I find it particularly illuminating that he so frequently avoided direct questions, and so frequently dealt with repeated questioning by saying things like "let's agree to disagree" or "let's move on". I once went through a mediation session with someone who would make unsupported (and in my mind, incorrect) claims about stuff (the stuff that we were in mediation about). I would of course challenge these claims, which would lead to a period of discussion about why we each held the views that we held, and nearly every time it looked like I was correct, he would stop this discussion before it could be finalized. He would say things like "let's agree to disagree", or "well, it looks like we won't be able to resolve that now" - basically anything to prevent ending up at a point where he would be clearly shown to be wrong. The key elements of this behaviour were two-fold: 1) his method of ending discussion made it very difficult to actually resolve anything, because he was a) usually wrong, and b) unwilling to let the discussion go to places that would show he was wrong. 2) he had a habit of going back to the same point later, treating it as if he was correct, and pretending there had never been any discussion that questioned his correctness. He would hold that view because I had not proven to his satisfaction that he was wrong. This, of course, led to us having the same debate again... I have no idea whether he thought this pattern was a clever debating strategy, a reasonable way to discuss things, or a sub-conscious psychological method of avoiding admitting he was wrong, but it surely was not a constructive process. At times, he would actually lose his temper, and I suspect that the "agree to disagree" type statements were a way of ending the discussion before he lost his temper. As for Dr. Pielke, he exhibits some of the same traits. Clearly, he seems more comfortable in an environment where his statements are not examined critically. His tendency to leave the discussion to return to his own blog where he can say what he pleases without opposition is quite telling. He is, or course, free to do so - his blog, his rules - but it makes him look (to me) as someone that wants a soapbox, not a scientific discussion. The fact that he thinks that SkS has "an argumentative manner of debate" and snarky comments, but sees nothing particularly wrong with WUWT, says to me that he only looks at tone when the comments disagree with him. It's just a way of avoiding substantive discussion that isn't leading where he wants it to lead. Overall, his participation here has not left me with a favorable impression of him, science-wise. -
Camburn at 10:45 AM on 30 October 2011Pielke Sr. and SkS Dialogue Final Summary
Thank you Albatross:when you enlarge the photo, you will see that a flat reading is very possible within the error bars of the 0-2000M readings. The same can be said of the 0-700M readings.Response:[DB] This is off-topic on this thread. Take it to one of the OHC threads.
-
Albatross at 10:39 AM on 30 October 2011Pielke Sr. and SkS Dialogue Final Summary
SkS readers, Here is what the oceanic heat content (OHC) data look like, with error bars. [Source]
Regarding uncertainty of the full depth Argo data, this is what von Shuckmann and Le Traon (2010), found [my bolding]:
"Annual mean GOIs from the today’s Argo sam[p]ling can be derived with an accuracy of ±0.10 cm for GSSL, ±0.21×10^8 Jm-2 for global OHC, and ±700 km^3 for global OFC. Long-term trends (15 yr) of GOIs based on the complete Argo sampling (10–1500m depth) can be performed with an accuracy of about ±0.03mmyr-1 for steric rise, ±0.02Wm-2 for ocean warming and ±20 km^3 yr-1 for global OFC trends."
Those readers, are the facts, the statistics.
[Source]
Regarding uncertainty of the full depth Argo data, this is what von Shuckmann and Le Traon (2010), found [my bolding]:
"Annual mean GOIs from the today’s Argo sam[p]ling can be derived with an accuracy of ±0.10 cm for GSSL, ±0.21×10^8 Jm-2 for global OHC, and ±700 km^3 for global OFC. Long-term trends (15 yr) of GOIs based on the complete Argo sampling (10–1500m depth) can be performed with an accuracy of about ±0.03mmyr-1 for steric rise, ±0.02Wm-2 for ocean warming and ±20 km^3 yr-1 for global OFC trends."
Those readers, are the facts, the statistics.
-
Albatross at 10:21 AM on 30 October 2011Pielke Sr. and SkS Dialogue Final Summary
Everyone, Camburn is clearly trying to derail the thread in an attempt to shift the attention away from Pielke, there is a name for doing that. Discussing (and misrepresenting) the BEST data is off-topic, and can be done on that thread. Can we please try and keep our eye on the ball? Thanks.Response:[DB] "Camburn is clearly trying to derail the thread in an attempt to shift the attention away from Pielke, there is a name for doing that. Discussing (and misrepresenting) the BEST data is off-topic, and can be done on that thread."
Agreed. Take the details to the pertinent threads. This thread is about Pielke Sr. and SkS Dialogue Final Summary. And the word you referred to is "trolling".
-
JMurphy at 10:19 AM on 30 October 2011Pielke Sr. and SkS Dialogue Final Summary
Camburn : "OHC has leveled off since 2003, temps have dropped as confirmed by BEST." Oh, but I thought BEST confirmed that the globe was warming ? Better check what they actually stated :In so doing, we find that the global land mean temperature has increased by 0.911 ± 0.042 C since the 1950s (95% confidence for statistical and spatial uncertainties). This change is consistent with global land-surface warming results previously reported, but with reduced uncertainty. Berkeley Earth Temperature Averaging Process
That's strange : BEST actually reckon the globe is significantly warming and Camburn reckons that BEST 'confirm' that temperatures have dropped. Now, who to believe and rely on... -
Camburn at 10:17 AM on 30 October 2011Pielke Sr. and SkS Dialogue Final Summary
muoncounter: No, I have not had enough time yet to fully digest BEST results. Their press release indicated that CONUS had not warmed, which is correct. With that statement, I think the rest of the results will be accurate. Bob: Yes, slopes of regressions have error bars. Albatross: I have not read anything that can establish with certainty a warming of the OHC to 2000M. The quality of the data with XBT was not good. ARGO is much much better, but the length of time is not sufficient to state that a genuine warming has occured. I will agree with many things concerning AGW. I will not agree with statements made with a certainty that is not there. -
muoncounter at 10:11 AM on 30 October 2011Pielke Sr. and SkS Dialogue Final Summary
Camburn#22: "Best has a cooling bias since 2003." Already addressed here. Statistically insignificant. -
Bob Loblaw at 10:10 AM on 30 October 2011Pielke Sr. and SkS Dialogue Final Summary
Rob @20: This is why I tend to agree on Dr Pielke on this one issue, OHC is a great metric of global warming, but only if we can measure right down to the bottom. Um, my recollection is that Dr. Pielke has a much stronger position on this one: he keeps arguing for using OHC as the primary metric. I would agree that it is a good one, but his attempt to discount everything else seems unwise. Camburn @25: Dr. Pielke Sr. saying the OHC has been flat since 2003 is totally correct Only if you ignore the error bars (and stick to the 0-700m layer), which you claim to look at. Slopes of regressions have error bars, too. -
muoncounter at 10:08 AM on 30 October 2011Pielke Sr. and SkS Dialogue Final Summary
Camburn#24: "BEST shows that CONUS has not warmed in the past 100 years." So that must mean you have not looked at anything related to the BEST data? -
Albatross at 10:08 AM on 30 October 2011Pielke Sr. and SkS Dialogue Final Summary
Camburn, "Dr. Pielke Sr. saying the OHC has been flat since 2003 is totally correct with the information and length of credible measurements that we have today. " That is simply not true. Please, these antics are getting offensive, they really are. The oceans are not 700 m deep. And, regardless, the 0-700 m OHC has most definitely not "been flat" since 2003 as we have shown here at SkS: "However, we examined the data from several studies on the subject (provided by NOAA), and found that between 2003 and 2009, the upper 700 meters accumulated between 1.1 x 10²¹ Joules (Levitus - though this reference may be slightly out of date), and 5.6 x 10²² Joules (Palmer), with Willis et al. falling in between at 5.1 x 10²¹ Joules. " You can verify that yourself by downloading the data and analyzing them. You are making demonstrably false and unsubstantiated claims, and defending Pielke's cherry picking with you very own cherry picking. Beautiful. In doing so, all that you have demonstrated is 1) your complete disregard for proper statistical analysis, 2) that you are ignoring internal variability in the climate system, and 3) that you are ignoring the fact that the Argo floats measure data down to 2000 m, and 4) that you believe the warming should be monotonic (which is has not been and will not be). -
dging at 10:08 AM on 30 October 2011Hansen's 1988 prediction was wrong
The article says "we find that in order to accurately predict the global warming of the past 22 years, Hansen's climate model would have needed a climate sensitivity of about 3.4°C for a doubling of atmospheric CO2." Can you show me those results. I'd love to see just how well the model worked for the 3.4 degree forcing. -
Camburn at 09:59 AM on 30 October 2011Pielke Sr. and SkS Dialogue Final Summary
Tom@19: No, I have not been accused of anything at WUWT. I seldom post there as I am not an ardent follower of that site. As far as the KKK, if someone made that accusation, that is intolerable. As far as you being insane?....mmmmm.....(Ok. I am laughing, that is a reallllly good one.)......I hope?...:) -
Camburn at 09:55 AM on 30 October 2011Pielke Sr. and SkS Dialogue Final Summary
Albatross: Long before Dr. Pielke Sr. stated that, I stated that. I look at the error bars of the metrics in question. Dr. Pielke Sr. saying the OHC has been flat since 2003 is totally correct with the information and length of credible measurements that we have today.Response:[DB] "Dr. Pielke Sr. saying the OHC has been flat since 2003 is totally correct with the information and length of credible measurements that we have today."
Actually, the only way your statement would be correct would be to word it as follows:
"Dr. Pielke Sr. saying the OHC of the 0-700m has been flat since 2003 is consistent with the information and length of measurements (which are admittedly incomplete as they do not monitor the full depths of the oceans) that we have today.
But of course, any time series of that short of length has no meaning anyway; therefore, Dr. Pielke's statement itself only serves to confuse those with a passing understanding of the science."
-
Camburn at 09:52 AM on 30 October 2011Pielke Sr. and SkS Dialogue Final Summary
Tom: GISSTEMP tells us that the number of sites used is not important. The BEST data in the reconstruction that you are talking about should match fairly closely the other sites used. From what I have been able to read so far, BEST shows that CONUS has not warmed in the past 100 years. I can agree wholeheartedly with that as that is what all of the temp data from the NOAA site indicates, and it is born out by old folks living here. Yes, antidotal, but true.Response:[DB] "From what I have been able to read so far, BEST shows that CONUS has not warmed in the past 100 years."
Perhaps you will need to re-read that passage. Of course, the experts at NASA/GISS would take issue with the veracity of your statement:

[Source]
-
Albatross at 09:52 AM on 30 October 2011Pielke Sr. and SkS Dialogue Final Summary
Dear "skeptics" and those in denial about "AGW", Please, instead of trotting out long debunked myths and cherry picking, could you focus instead on the scientific discourse between SkS and Dr. Pielke, and Dr. Pielke's misrepresentations and disregard for professional statistical practices. If you wish to try and defend those by using accepted statistical methods and the peer-reviewed scientific literature, then by all means go ahead. Thank you. Interestingly, the posts thus far by Pielke apologists and "skeptics" are only reinforcing the truth behind Dana's statement: "Dr. Pielke, on the other hand, seems to constantly try to feed these "skeptics" ammunition for their arguments. For example, as we have discussed here, Dr. Pielke cherrypicked data in an attempt to argue that TLT and OHC have not increased since 1998/2002/2003/etc. in an attempt to argue that the warming has stopped. The "skeptic" interpretation of these comments could not be easier to predict - "Dr. Pielke says that global warming stopped a decade ago." So a heartfelt thanks for so nicely proving our point. -
Camburn at 09:48 AM on 30 October 2011Pielke Sr. and SkS Dialogue Final Summary
Dana1981: Best has a cooling bias since 2003. Daniel: The quality of the deeper ocean readings is such that one can not make a case that they have warmed, nor cooled. The error bars are just to big as of yet. The 0-700 meter readings are basically flat, with a cooling bias since 2003. I agree, the time period since 2003 is to short to conclude that the trend of warming has stopped. One thing for sure tho is it has not accelerated.Response:[dana1981] First of all, the word you're looking for is "trend," not "bias." Secondly, when somebody shows you the data that proves you're wrong, and you still maintain that you're right, I think that's the very definition of denial.
-
Tom Curtis at 09:45 AM on 30 October 2011Pielke Sr. and SkS Dialogue Final Summary
actually thoughtful, in one BEST paper they show a temperature reconstruction from a random selection of 2000 sites, excluding all sites used by either the NCDC, GISS, or Had/CRU. That represents just 6.5% of all available stations. Because those agencies use the best available sites, and because there are few available sites not used by those agencies in many parts of the world, the reconstruction based on a limited selection of BEST only sites is very noisy (conspicuously so), and shows a decline in temperature over since 2002. Camburn is apparently quoting that reconstruction as being the full BEST reconstruction, which is of course incorrect. From his example, we can expect this to be a new denier meme in the near future. -
Rob Painting at 09:39 AM on 30 October 2011Pielke Sr. and SkS Dialogue Final Summary
It would absolutely weird if the global surface temperature trend wasn't following the trend of the surface ocean given that the oceans cover around 70% of the Earth's surface. But as the observations show, most of global warming is going into the oceans, and a large chunk of that is going into layers below 700 mtrs. This is why I tend to agree on Dr Pielke on this one issue, OHC is a great metric of global warming, but only if we can measure right down to the bottom. The 700 metre layer just doesn't cut it, even though it is largely responsible for surface temperature trends. -
Tom Curtis at 09:32 AM on 30 October 2011Pielke Sr. and SkS Dialogue Final Summary
Camburn, your comments merely show that you have not been accused of insanity or associated with the KKK at WUWT. I have (for both), the former by A Watts himself. When the latter was pointed out, A Watts first deleted the post, and the offending post, but then falsely accused me of being the only person to mention the KKK on the thread. -
Daniel Bailey at 09:31 AM on 30 October 2011Pielke Sr. and SkS Dialogue Final Summary
Dana, Camburn's bowl of cherries also included a leveling of OHC since 2003; a claim clearly refuted by Rob's graphics. Regardless, the "skeptics" (of whom Camburn is but one) love to focus on the noise in hopes of taking the focus off of the larger trend (which is significantly up). It would seem that the only thing significant about Camburn's 8-year trend is that "skeptics" simply choose not to understand what significance really means in science. -
dana1981 at 09:20 AM on 30 October 2011Pielke Sr. and SkS Dialogue Final Summary
BEST is actually dead flat since 2003, though as we all know, 8 years is too short of a timeframe to make any meaningful statements. -
actually thoughtful at 09:03 AM on 30 October 2011Pielke Sr. and SkS Dialogue Final Summary
Camburn at 14 - radical claims need to be supported. What is your source for stating: "temps have dropped as confirmed by BEST. A period of cooling overall is very evident."? -
Rob Painting at 08:43 AM on 30 October 2011Pielke Sr. and SkS Dialogue Final Summary
Ken in Oz - The upper ocean (down to 500 metres) is very strongly associated with ENSO due to the tilting of the thermocline. So the fact the 700 metre layer heat content has stagnated in the last 5 years, when La Nina has dominated, is hardly surprising. This is something Dr Pielke should be aware of, but apparently isn't. Regardless, as seen in figure 1, the oceans below 700 metres are readily warming up. More on this in an upcoming post. But note the interesting trend between the various ocean layers: SkS commenter jsquared broke down the NODC data into Northern & Southern Hemisphere components too:
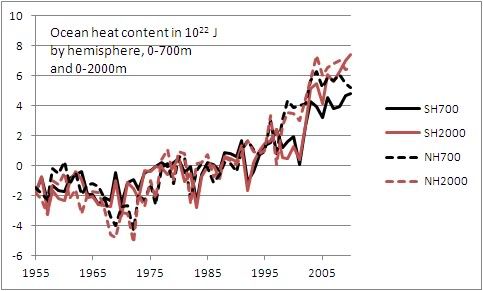 So just looking at the 700 metre layer really tells us little about the ocean warming as a whole. And that is the whole point of the SkS article Ocean heat content and the importance of the deep ocean.
-
Camburn at 08:39 AM on 30 October 2011Pielke Sr. and SkS Dialogue Final Summary
Ken in Oz: There is an acknowledged spliceing problem when ARGO data was incorporated with the XBT data in the 2000-2003 time period. OHC has leveled off since 2003, temps have dropped as confirmed by BEST. A period of cooling overall is very evident.Response:[DB] "OHC has leveled off since 2003, temps have dropped as confirmed by BEST. A period of cooling overall is very evident."
Umm, no. Incorrect, nonfactual and unsupported (take your pick).
-
Ken in Oz at 07:44 AM on 30 October 2011Pielke Sr. and SkS Dialogue Final Summary
On ocean heat content of upper 700m - following the ups and downs (with it's partial correlation to ENSO) it looks to me more like it hit a new high in 2003 that it failed to come back down from - which, in the absence of global warming would be anomalous. Interpreting that as levelling off or cooling doesn't strike me as warranted - now, had that steep rise been followed by a steep fall that took it to 2001-2 levels it might be properly interpreted as a levelling off. By the time the next el Nino assisted 'up' has come and gone any interpretion of levelling off or cooling over the few years from 2003 to 2011 will be shown to be natural variations on top of a clear warming trend. -
DMarshall at 06:39 AM on 30 October 2011Pielke Sr. and SkS Dialogue Final Summary
If snarky comments turned readers of climate blogs away, WUWT would be a 10-person (-snip-), instead of being one of the most-viewed. I'm continually impressed with the civility I find here after reading through some of Watt's threads. At least half the headlines in any given week should flunk Pielke's snarkiness test. If anything, upping the snark would only increase the readership, though it might be very, very stressful for the mods.Response:[DB] Inflammatory descriptive term snipped. This is not one of those blogs where such is allowed or even encouraged.
-
dana1981 at 06:37 AM on 30 October 2011SkS Weekly Digest #20
I have several thoughts on this caricature and Dr. Pielke's role in its creation. 1) It proves that contrary to Dr. Pielke's claims, Anthony Watts is not "devoted to the highest level of scientific robustness." 2) It proves that contrary to Dr. Pielke's claims, the tone at WUWT is both caustic and defamatory (unlike at SkS). 3) It proves that Dr. Pielke's behavior has far more negative ramifications than he realizes. 4) If you actually read the entire article in question, rather than just the quotes Dr. Pielke has mined, it says the exact opposite of the suggestion in the caricature (that the climate scientists are just blaming the short-term slowed warming on natural variability). In fact, the article has a quote from Trenberth saying that blaming it on "natural variability" is not good enough. It's also worth noting that, as SkS did in our critique of Dr. Pielke's comments, the climate scientists in the article pointed out that starting the analysis in 1998 is a clear-cut case of cherrypicking. Dr. Pielke conveniently omitted that part of the article from his blog post. In short, the behavior of Dr. Pielke and WUWT prove exactly what SkS has been saying. Do Not Feed the Delayers. -
dana1981 at 06:25 AM on 30 October 2011Yes, It's Still Us, and It's Still Bad
That's funny John H. I guess great minds think alike! -
Albatross at 05:25 AM on 30 October 2011SkS Weekly Digest #20
And the disingenuousness, defamatory comments and misinformation at WUWT continue, and this time Dr. Roger Pielke Senior is implicated, only days after lecturing and berating others on their snarky "tone". This is absolutely disgraceful and unacceptable behaviour. "Friday Funny – bonus Posted on October 28, 2011 by Anthony Watts Josh caricatures “team aerosols” thanks to Dr. Roger Pielke’s compilation of responses to this question: ‘Why, despite steadily accumulating greenhouse gases, did the rise of the planet’s temperature stall for the past decade?” Excuses, excuses." The timing of this is curious, as it appears the day after Pielke posted this quote mining exercise on his blog, and his post at WUWT (together with his cherry picked graph) appeared the very same day. Pielke is evidently very close to Watts, in fact it seems that they are conspiring together to defame climate scientists and trying to undermine their credibility. And Pielke has the audacity and gall to tone troll and lecture others on "tone" and attitude. This is not sticking to the science Dr. Pielke, this is rhetoric and hyperbole, and very personal stuff at that.
The above cartoon is reprehensible and constitutes a defamatory and juvenile attack on some of the world's leading climate scientists. Really, is this all WUWT have in their arsenal now, juvenile and mocking cartoons? In other words, they have nothing but innuendo and snark.
Now here is something interesting. On his blog Pielke Senior has the title "Candid comments from climate scientist"s, when he posts at WUWT this morphs to "Climate scientists and their excuses". This is a demonstrably false statement and gross mischaracterization of their positions. Also, on the one hand Pielke is suggesting they are being candid, while on the other hand he is saying that they are making excuses, the insinuation being that they are being dishonest and/or hiding something. That is defamatory, and in some countries is considered libel.
I do not, however, expect Dr. Pielke him to cede that or correct the misleading title at WUWT. Instead he seems to be egging on the peanut gallery. What Pielke and Anthony characterize as "excuses" are actually diligent and curious climate scientists trying to improve our understanding of the climate system and advance the science. Nit picking, distorting, mocking, defaming and misrepresenting does not achieve those goals in the least.
I wonder if Dr. Pielke will have the honor and integrity to demand that his friend and colleague Anthony Watts to pull the cartoon? We watch with interest, but without holding our breath.
The timing of this is curious, as it appears the day after Pielke posted this quote mining exercise on his blog, and his post at WUWT (together with his cherry picked graph) appeared the very same day. Pielke is evidently very close to Watts, in fact it seems that they are conspiring together to defame climate scientists and trying to undermine their credibility. And Pielke has the audacity and gall to tone troll and lecture others on "tone" and attitude. This is not sticking to the science Dr. Pielke, this is rhetoric and hyperbole, and very personal stuff at that.
The above cartoon is reprehensible and constitutes a defamatory and juvenile attack on some of the world's leading climate scientists. Really, is this all WUWT have in their arsenal now, juvenile and mocking cartoons? In other words, they have nothing but innuendo and snark.
Now here is something interesting. On his blog Pielke Senior has the title "Candid comments from climate scientist"s, when he posts at WUWT this morphs to "Climate scientists and their excuses". This is a demonstrably false statement and gross mischaracterization of their positions. Also, on the one hand Pielke is suggesting they are being candid, while on the other hand he is saying that they are making excuses, the insinuation being that they are being dishonest and/or hiding something. That is defamatory, and in some countries is considered libel.
I do not, however, expect Dr. Pielke him to cede that or correct the misleading title at WUWT. Instead he seems to be egging on the peanut gallery. What Pielke and Anthony characterize as "excuses" are actually diligent and curious climate scientists trying to improve our understanding of the climate system and advance the science. Nit picking, distorting, mocking, defaming and misrepresenting does not achieve those goals in the least.
I wonder if Dr. Pielke will have the honor and integrity to demand that his friend and colleague Anthony Watts to pull the cartoon? We watch with interest, but without holding our breath.
-
dhogaza at 04:35 AM on 30 October 2011Pielke Sr. and SkS Dialogue Final Summary
michael sweet: "Dr Pielke many times asserted that OHC should be the metric whereby AGW was measured. On the other hand, he claims that the deep ocean has not been accurately measured. How can these two statements be reconciled? If we do not know how much heat is going into the deep ocean, OHC cannot be used as the primary guage of AGW." The two statements can be easily reconciled if one's goal is to use one's influence to argue that uncertainty means we should delay action. Once scientists get a good handle on OHC trends he'll think of something else, I'm sure. -
John Hartz at 03:54 AM on 30 October 2011Yes, It's Still Us, and It's Still Bad
On the same day that Dana posted his excellent essay, Zachary Shahan over at PlanetSave posted, "Yes, Global Warming is Real AND Caused by Humans." This is not the first time that Dana and Zachary have posted parallel articles almost simultaneously. Are they channeling each other? To access Zachary's informative article, click here. -
John Russell at 03:37 AM on 30 October 2011Yes, It's Still Us, and It's Still Bad
@Ian Forrester writes: "There is still one AGW denier who is denying that temperatures have risen since 1940. In a recent comment to a Nature editorial Fred Singer claims:"But unlike the land surface, the atmosphere has shown no warming trend, either over land or over ocean..."
Isn't that a bit like claiming that 'unlike everything within the greenhouse, the glass has shown no warming trend'? -
Tom Smerling at 03:36 AM on 30 October 2011Bad, Badder, BEST
I absolutely love Peter Sinclair's work -- his careful research, editing, entertaining presentation and even tone so often "strike a blow below the waterline" at skeptical arguments. Yet I have to weigh in on the side of those arguing that it's better to leave out snarky references to the "Junior Woodchuck Society" etc. Climate Crocks are too good to squander solely on entertaining the already-converted. And the fun of name-calling is not worth the price of alienating partially-open-minded skeptics (yes, there still are some) out there. -
PeterS at 02:42 AM on 30 October 2011Yes, It's Still Us, and It's Still Bad
Dale @ 24: "Since BEST only used land data (30% of the surface) and also found 1/3 of all stations cooled, all they proved was that 20% of the planet's surface warmed. Is that reason for all your celebrations? ;)" Dale, do you believe in the ability of scientists to collective representative samples, or do you assert we need a temperature reading at every spot on the earth before making any conclusions? Is your medical doctor capable of taking a representative sample of your blood chemistry with a 5 ml vial? Or do you demand they drain every drop of your blood, when you get a blood test? -
John Russell at 02:37 AM on 30 October 2011Pielke Sr. and SkS Dialogue Final Summary
@Sphaerica,8 Thanks. It's also an effective explanation for why it's no good looking at just a few years of temperature records to claim warming has stopped. You need to record at least 30 years -- or in the case of the analogy, 30 waves -- to show a meaningful trend. If you want to take the analogy even further: by cherry-picking a series of waves between a high one and a subsequent lower one, you could even deny that the tide is coming in. And even, if you're so minded, maybe start a website to undermine the efforts of the 'tide-ists'? -
DrTsk at 01:59 AM on 30 October 2011Yes, It's Still Us, and It's Still Bad
I think that we should stop completely responding to any of their comments. Complete and utter shutdown of communication. As Mark(37) said, just continue the onslaught of good data and superb analysis. Similar to the flat earthers, data will soon change the tide. My only worry (and source of my immense frustration) is that the tide might change way to late on its own. -
muoncounter at 01:58 AM on 30 October 2011Continued Lower Atmosphere Warming
Bernard J#137: "a world where stupidity trumps parody," Nah, parody always wins. Or is at least more entertaining. The relevant cherrypick is the interval from 2002 forward.-- source A time period starting with an anomalous warm (2002) and ending on an anomalous cool (winter 2010) shows warming 'on hiatus'? Shazbot! Of course, for parody to be effective, there must be a point of irony: Here, the BEST data do not include the summers 2010 - 2011, which (if memory serves) were quite warm. The August worldwide land surface temperature was 0.84°C (1.51°F) above the 20th century average of 13.8°C (56.9°F)—the second warmest August on record, behind 1998.
-
adelady at 01:18 AM on 30 October 2011Pielke Sr. and SkS Dialogue Final Summary
I also like the analogy of stairs. Anyone can walk straight up the steps without hesitation. But plenty of people will hesitate or pause for no particular reason. Tourists might spend considerable time getting the best possible photo angle of a building or a fountain in the area on their relaxed walk up to another attrction. Children will fool about or fuss or choose to take a few steps back every now and again for no reason any observer can discern. And then there's Fred Astaire. -
Bob Lacatena at 01:09 AM on 30 October 2011Pielke Sr. and SkS Dialogue Final Summary
7, John, That's awesome. It is a perfect analogy, which fits superbly with virtually everyone's personal experience. I'll have to remember it.
Prev 1420 1421 1422 1423 1424 1425 1426 1427 1428 1429 1430 1431 1432 1433 1434 1435 Next


