


 Arguments


Recent Comments
Prev 1423 1424 1425 1426 1427 1428 1429 1430 1431 1432 1433 1434 1435 1436 1437 1438 Next
Comments 71501 to 71550:
-
Philippe Chantreau at 05:43 AM on 14 November 2011Sober up: world running out of time to keep planet from over-heating
Will strategic and political considerations constrain the relaiance on imported electricity more than they constrain reliance on imported oil and coal? I don't see that the situation will be much different. The truth is that, as long as tepid attitudes and reluctance to change like that displayed here by lancelot are widespread, no change can happen. There is also the option of waiting until FF are so scarce that change, and its modalities, is no longer a matter of choice. -
skept.fr at 05:20 AM on 14 November 2011Extreme Events Increase With Global Warming
Michael : I consider the Tom’s argument, and in #20 I finally conclude in the same way when looking at Figure 2 (an overall increase of combined event). I’m please to read Hansen paper. Tom : my initial point was not that hot events are limited to heat waves (nor extreme events to temperature break-records), just that the shift of the mean to the right you describe logically implies a lesser probability for extreme cold events – a quite consensual conclusion from IPPC AR4. But you get the point for the overall increase. Again, my ultimate concern is to correctly estimate the present and future carbon cost for society : I hope we all have the same agenda. -
WheelsOC at 05:15 AM on 14 November 2011New tool clears the air on cloud simulations
Alright! More realistic physics and better resolution for cloud modelling! This should make Dr. Spencer happy, right? ... right? Hmmm, this news has been out for almost three weeks and he's been pretty quiet about it. Wasn't his major beef with climate models the idea that they had unrealistic and backwards cloud simulations? -
lancelot at 05:01 AM on 14 November 2011Sober up: world running out of time to keep planet from over-heating
I should add: the other 70% will still have to come from fossil or nuclear, or be imported, as it is done already from France. However, strategic and political considerations will constrain the reliance on imported electricity. That is just a fact of life. -
lancelot at 04:49 AM on 14 November 2011Sober up: world running out of time to keep planet from over-heating
John Hartz, (author of this topic): in the intro: "a recent study in Energy Policy found that fossil fuels could be wholly abandoned by 2050 with the world's energy needs met by electricity produced 90 percent from wind and solar sources alone" That would be wonderful if true, but is very hard to believe. Firstly. Do you have a link to that study? Secondly, even if theoretically possible globally, in a country such as the UK it is not likely to be possible locally. The often quoted limit for renewables is about 30%. So it would seem that the other 70% will have to still have to come from fossil or nuclear. This must surely apply to many other countries. Thirdly, some calculation should be done of the amount of carbon likely to be produced in the transition period, for building such a massive energy infrastructure, using energy which comes from current sources. I am not saying that the quoted target is not desirable, just questioning the practical side.Moderator Response: [John Hartz] The article was written by Jeremy Hance and was originally posted on Mongabay.com. See Jeremy Hance #73 for links to the Energy Policy paper. -
cynicus at 04:28 AM on 14 November 2011The BEST Summary
Tristan, it figures that Jo Nova rants about percentages: deniers hate percentages and love numbers. See, the Oregon Petition has over 30.000 signers who earn a BS degree or equivalent, so we -the public- are supposed to think: "Gee that's a lot of knowledgeable people, they must be right". Now, we can discuss endlessly if the Spice Girls have BS degrees or not, or that there really exists someone called Donald Duck, but of the people with a BS degree (or equivalent) alive, much less then 3% signed the petition! Hmm, now it doesn't sound that impressive anymore, does it? Another example is that famous list of 900 papers skeptical of AGW. Now, we can discuss endlessly if these papers are really sceptical about AGW or not (many of them aren't), or that some of these papers are not to be taken serious (many of them aren't, e.g. the paper in the Dog Astrology Journal). But when we take a look at the number of papers published each year on AGW, it turns in the order of 2000+ papers are published year after year of which less then 5% is sceptical about AGW. Hmm, 900 papers doesn't sound so impressive anymore, right? Deniers hate percentages but love numbers. Note: Figures are not exact, it's just to make the point -
Lazarus at 04:17 AM on 14 November 2011Sober up: world running out of time to keep planet from over-heating
Typo: "r. The other study predicts that pats of Europe,"Moderator Response: [John Hartz]Typo fixed. Thanks. -
michael sweet at 04:09 AM on 14 November 2011Extreme Events Increase With Global Warming
Muoncounter, Since this an Australian web site I am surprised you said JJA is a summer only time;). In the paper Hansen also shows DJF data and it looks very similar. The primary difference is in winter the standard deviation of temperature is greater. This means a stronger conclusion can be drawn from the JJA data. -
muoncounter at 03:57 AM on 14 November 2011Extreme Events Increase With Global Warming
Tom C#21: "the information in the inline graphs @13. The distribution of temperatures shown in those graphs not only shifts the mean to the right, but broadens the distribution." Of course, those are summer (JJA) graphs, so they do not deal with cold extremes in any way. But in dealing primarily with heat, this post does not explicitly exclude its broader effects. No such exclusion is in any way logical. Anyone who lived through this summer in the southwestern US saw little separation between heatwave-drought-fire; the latter two are symptoms of prolonged extreme heat. All are connected: in fact, it was the passage of Hurricane Irene to the east of Texas that brought winds turning local fires into wildfires. There is also ample evidence, at least on a local scale, that a bad fire season leads to a higher probability of flooding in the following wet season: Water quickly saturates the thin layer of permeable soil above the hydrophobic zone not being slowed by a vegetative canopy. Slower infiltration rates result in an increased intensity of surface runoff and erosion. But we've already seen a 'trifecta' of extreme behavior: National Weather Service forecast offices and River Forecast Centers have been gearing up for the third leg of a triple crown of disasters consisting of continuing drought and wildfires in the west, a record-breaking tornado outbreak in the South and record flooding along the Lower Mississippi River. And if tropical cyclones (TCs) are more frequent or more intense due to warming, you can add in the associated heavy Predecessor Rain Events (PREs) described by Galarneau and Bosart 2010: PREs are high-impact weather events that can often result in significant inland flooding, either from the PRE itself or from the subsequent arrival of the main rain shield associated with the TC that falls onto soils already saturated by the PRE. Further along the scale, consider what may be a changing winter pattern towards more frequent extreme snowfall totals: There will still be colder than average winters in a world that is experiencing warming, with plenty of opportunities for snow. The more difficult ingredient for producing a record snowstorm is the requirement of near-record levels of moisture. Global warming theory predicts that global precipitation will increase, and that heavy precipitation events--the ones most likely to cause flash flooding--will also increase. Our prior extreme weather threads (and here) addressed these connections. -
michael sweet at 02:32 AM on 14 November 2011Extreme Events Increase With Global Warming
Hansen's most recent paper shows 2009 with 7% Extreme heating over land, 2010 as 17% Extreme heating and 2011 as 10% Extreme heating (See figure 6 in linked study). All these years had 0% Extereme cold and in fact 0% Very cold, the next warmer bin (Very hot was 20, 20, and 17%). From 1950-1980 less than 0.5% of land area was either Extremely hot or Extremely cold. I do not think that there is a problem with minimizing the side effects of cold weather, compared to current issues with extraordinary heat, drought and flooding. Perhaps you could site an example of a scientist "minmimizing the deleterious effects of a cold event"? We are all aware of the deleterious effects of cold following extreme volcanic erruptions, those are beyond human control. Consider Toms argument also. We want to be honest but not minimize the danger. -
Tom Curtis at 02:30 AM on 14 November 2011Extreme Events Increase With Global Warming
skept.fr @20, while I admire a commitment to truth in any person, your reduction of the issue to heatwaves only obscures truth rather than reveals it. As already noted by other commentators, by that formula you exclude from consideration the drought and fires that accompany the heatwaves. Indeed, you also exclude the droughts (such as those in the Amazon, and in the South West corner of Australia) which are largely independent of heat waves. You also exclude from consideration the many floods in recent years several of which have a high probability of having been caused, or made worse by global warming. You also draw attention away from the information in the inline graphs @13. The distribution of temperatures shown in those graphs not only shifts the mean to the right, but broadens the distribution. That means the reduction in cold wave events is nowhere near as large as the increase in heatwave events. So, contrary to your 16, this is not a case of an equal number of extreme events, with increase in hot events compensated for by a decrease in cold events. There is an overall increase in the combined total of hot and cold events, even though cold events are becoming rarer. -
Tom Curtis at 02:16 AM on 14 November 2011New tool clears the air on cloud simulations
"Additionally, COSP has shown that climate change leads to an increase in optical thickness and increases the altitude of high clouds and decreases the amount of low and mid-level clouds."
This is very interesting. Cloud albedo is a function of optical thickness, but the greenhouse effect is a function of cloud altitude. Specifically, the higher the altitude of the top of the cloud, the greater the greenhouse effect from that cloud. That means that an increase in the altitude of high clouds, and a decrease in the amount of low and mid-level clouds translates out as a positive cloud feedback, ie, that the effects of increased warmth on clouds tend to further increase the warmth, rather than reduce it. -
skept.fr at 02:08 AM on 14 November 2011Extreme Events Increase With Global Warming
Michael : « you want to minimize the deleterious effects of these type of events » I would like the negative effects of AGW (including unique extreme events) to be precisely detected, attributed, evaluated. As a true skeptic (or I hope so), I’v no sympathy for those who try to distort the results of science (in a maximizing or minimizing sense) in order to influence public opinion and promote an ideological or economic agenda. And as a citizen, I’d like to know the true externalities of carbon-based energy systems. But ‘true’ means simply… true : we need to assess costs of climate-related hazards with and without AGW in order to make the optimal choices, at least if we favour an evidence-based policy. You are right for the other side-effects of hot temperatures (fires, drought), but do you mean that there is no side-effects of extreme cold temperatures too, in Russia or elsewhere ? If so, hem, I would conclude that ‘you try to minimize the deleterious effects of these type of events’ ☺ But after all, if hot extreme events in a warming climate are more numerous than cold extreme events in a stable climate (as it seems to be according to Figure 2), the choice for the title is justified. -
pauls at 01:03 AM on 14 November 2011The BEST Summary
'...the 0.95 amplification "upscaling" factor has been incorporated into the satellite trends to estimate the surface trend.' I think this Climate Audit thread demonstrates that Gavin got his calculation wrong on that figure. However, it turns out that the multi-model ensemble mean for land amplification is ~1.0, with a long-term spread of 0.9-1.1 so conclusions aren't radically altered. The thing I pointed out was that the discrepancy in UAH & RSS over land (Using GISS model output, TLT:Surface expected = 1.1:1; TLT:Surface observed = 0.7:1; Difference = 1.1/0.7 = 1.57) is almost exactly the same as the discrepancy over oceans (TLT:Surface expected = 1.6:1; TLT:Surface observed = 1.0:1; Difference = 1.6/1.0 = 1.6) so inferring an urbanisation component from the comparison doesn't work. In fact the comparison provides further evidence for a negligible influence of urbanisation on surface temperature records. -
michael sweet at 00:11 AM on 14 November 2011Extreme Events Increase With Global Warming
Skept, While the lead post deals primarily with heat records, in Moscow this summer they also suffered record fires and drought. These were caused by the heat. Should we leave out any reference to these related effects? It seems to me that you want to minimize the deleterious effects of these type of events. I do not think we should minimize the event. -
Tristan at 00:01 AM on 14 November 2011The BEST Summary
Ahh, excellent, thanks JM. -
skept.fr at 23:15 PM on 13 November 2011Extreme Events Increase With Global Warming
michael sweet: As far as I understand it, Rahmstorf and Comou 2011 deal with temperature series and distribution of extreme temperatures. So, technically, their conclusion cannot be extended to precipitation – even if we know that intensity of precipitation events is projected to increase in IPCC models. -
chriskoz at 23:11 PM on 13 November 2011How to Avoid the Truth About Climate Change
Barry's presentation is so invaluable, because it talks to those people who don't necessarily have time to learn the scientific details (as most of us visiting SkS do) but still want to understand the issue of the denial we are facing. The couple of proofs given here, perfectly complements the presentation by Richard Milne, recently posted by John here. These two presentation are now my handy resources of arguments while talking to my 'skeptic' friends. I feel like the world of denial is opening now. Thanks again, Barry. Good luck with your book. -
michael sweet at 22:50 PM on 13 November 2011Extreme Events Increase With Global Warming
Skept: Since many of the extreme events in the USA (and Australia) this year were floods, it would be illogical to restrict the title to heatwaves. -
JMurphy at 22:48 PM on 13 November 2011The BEST Summary
Tristan, it is 75 out of 77, or 97-98% - the latter with a larger sample. (By the way, for admin information, the "97% of Scientists is a small sample" link I found while doing the following search, doesn't go anywhere.) -
Tristan at 22:25 PM on 13 November 2011The BEST Summary
Jo Nova had a ranty post about klein's article. It seemed to stem from the fact that Klein purported to be right about climate change without addressing 'skeptic' claims. Nova went on to say that Klein has a problem with numbers because the 97% statistic is illogical. 'It's not 97%, it's 75 scientists'. I agree that the way 97% is thrown around is a bit misleading. 75/77 makes 'over 90%' a more defensible statement. -
skept.fr at 21:32 PM on 13 November 2011Extreme Events Increase With Global Warming
Shouldn't your title be : "Heatwaves Increase With Global Warming"? I suppose that the probability of some "extreme events" like cold waves are decreasing, for the same reason their warm counterpart is increasing. -
OPatrick at 21:16 PM on 13 November 2011The BEST Summary
A brief, off topic, note on behalf of my wife, who has a particular (professionally motivated) concern about these things: The use of the term "schizophrenic" to describe sceptics who appear to hold contradictory positions is questionable in two ways. FIrstly, although the etymology of 'schizophrenic' is 'split-mind' the condition itself does not involve this - dissociative identity disorder would be a closer match. (Actually, looking at the first paragraph on schizophrenia at Wikipedia the real manifestations of schizophrenia seem to be an even better description of much sceptic thought, but now I'm undermining my second point....) Secondly, the use of any medically recognised condition to describe the behaviour of people who choose to act in these ways is disrepectful to those with genuine mental disorders who cannot control their patterns of thinking. -
RobertLeven at 20:41 PM on 13 November 2011Luxembourgish translation of The Scientific Guide to Global Warming Skepticism
Generally speaking, the acceptance to protect the environment in Lxembourg is very high. But when it comes to realize actions against climate change, such as installing wind turbines, discussions arise, including the way to put climate science into doubt. The mentality is reserved. So there's a hidden discussion including a rather unimportant skeptic lobby. I see the promotion of the document in two ways: to prevent arise of wrong and faulty arguments of the skeptic on climate change and to give people information on hand telling them about the many different ways climate change is happening. This is a part of the puzzle to enhance the knowledge here in Luxembourg about climate change, my way to promote further action against climate change and take responsibility. -
John Russell at 20:28 PM on 13 November 2011The BEST Summary
@Doug H I don't think it helps those seeking action on climate to label all capitalists as being in denial. While it's true that many multinational companies with a vested interest in the energy status quo are actively spinning propaganda to deny climate change, there are many multinationals -- particularly those in food -- who recognise the problems climate change will have on their supply chains in the future. If we are to win this argument we need capitalists to come in from the cold. If you look, for instance, at the insurance industry you'll see that denial is not really a function of being a capitalist. Here in the UK climate change is not so much a left/right thing and in my experience those in denial -- leaving aside the just plain uninformed -- are just as likely to be on the extreme left as the extreme right. Your mainstream Conservative is generally as concerned about this issue as the mainstream Labour supporter. -
alan_marshall at 19:52 PM on 13 November 2011Australia Legislates an Emissions Trading Scheme
Patrick Kelly @ 56 In a post that discusses how nations are acting to mitigate climate change, making reference to the views of decision-makers would seem to be unavoidable. The SkS comments policy does not prohibit discussion of politics per se, but rather "political rants". I committed myself to a nonpartisan presentation, commending both sides of politics when they acknowledge the consensus science. If you are offended by my little aside about a party in denial, I hope that my above acknowledgement @ 57 of real differences on climate change between the Republican candidates, which we have previously examined on SkS, is helpful. -
alan_marshall at 19:33 PM on 13 November 2011Australia Legislates an Emissions Trading Scheme
… someone who acknowledges climate change will be elected President in 2012 I sure hope so, Eric. I must admit that I have shed no tears for Perry and Cain as they have faltered in their campaigns. Both seem to have a predisposition to deny global warming, whereas Romney does not. While he shifted his position for the Republican primaries, I don’t think he has closed his mind to the science. Still, if you can judge by his books, Obama is passionate about doing something about climate change, with or without the help of congress. He would still get my vote, except that mine doesn’t count! In any event, whoever wins the next presidential election is likely to be faced with undeniable evidence of AGW within their first term if the trend for Arctic ice loss continues. I have used graphs like this one with Australian politicians and believe them to be effective. I think it surprises politicians to learn that the current loss of 286 billion tonnes per year from Greenland alone is more than enough to fill Sydney’s massive harbour 500 times over! -
Patrick Kelly at 19:32 PM on 13 November 2011Australia Legislates an Emissions Trading Scheme
For a site that pleads a policy of "Poitical comments.... will be deleted," there are an awful lot of political comments posted! -
Lloyd Flack at 16:35 PM on 13 November 2011The BEST Summary
John Hartz #6, I think Klein does see the antipathy towards environmentalists. And she does see the cornucopian wishful thinking about resources. But she does not see how the denialism is mostly rooted in things that are far stronger in the US than elsewhere. I think unlike most other Western countries, secular conservatism is weak in the US. You mostly have either religious conservatives or you have libertarians. The secular conservatism of most other Western countries has comparatively little difficulty making the compromises and adjustments that are necessary to mitigate climate change. But the religious conservatism of the US seems obsessed with its opponents. It seems to be unwilling to allow itself to see any good in the other side. I wonder whether they really support free enterprise so much as they want to use it a club to beat the secular with. The libertarians are scared of any form of compromise. I think it is because they want a system that is the logical consequence of a few principles. They do not like the idea of a system based of balancing conflicting goals none of which get completely accomplished.. They believe such systems will always collapse so that they are based on only a few principles. They think that a mixed economy must tend towards socialism. Klein is just as self righteous as her opponents and with her aims and sanctimoniousness she fuels the denialists. She is telling them that their fears are correct. She needs marginalizing just as much as they do. -
David Lewis at 15:52 PM on 13 November 2011Sorting out Settled Science from Remaining Uncertainties
A significant additional factor to the ones you mention which is almost as large as the effect of declining solar irradiance is described by Hansen in his Earth’s Energy Imbalance and Implications paper. Hansen calls this the Pinatubo “rebound”. His discussion is in section 12-4, i.e. page 26. “Volcanoes cause a negative planetary energy imbalance during the 1-2 years that the aerosols are present in the stratosphere, followed by a rebound to a positive energy imbalance. This rebound is most clearly defined after the Pinatubo eruption, being noticeable for more than a decade, because of the absence of other volcanoes in that period” I hacked a portion of his Figure 18(f) chart from page 27, and added a red arrow over the decade he’s talking about. This is a second negative impact on the planetary energy imbalance that can be attributed to the eruption of Pinatubo, in addition to the initial -2 W/m2 spike that goes away after a few years. Pinatubo’s “rebound” effect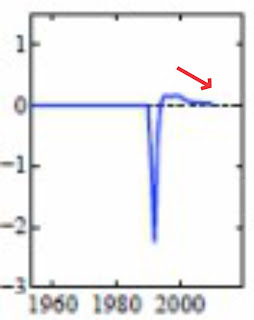 The blue line shows the eruption immediately imposing a bit more than -2 W/m2 forcing on the planetary system which rapidly heads back towards zero as the PInatubo aerosols settle out of the stratosphere. But because -2 W/m2 even over that short period is enough to cause the global ocean to cool slightly, after the Pinatubo aerosols are gone the Earth is left radiating less heat than it otherwise would be radiating to space for a period afterward. This amounts to a slight positive forcing, that as it declines toward zero reduces the planetary energy imbalance. Hansen calls this the “rebound”. He doesn’t supply a number for the peak. My estimate from his chart is that the peak was about 0.16 W/m2.
Compare that 0.16 W/m2 to the number Hansen puts on the effect of the cyclical declining solar irradiance during almost the same period , i.e. about 0.14 W/m2. This factor is almost as large.
The blue line shows the eruption immediately imposing a bit more than -2 W/m2 forcing on the planetary system which rapidly heads back towards zero as the PInatubo aerosols settle out of the stratosphere. But because -2 W/m2 even over that short period is enough to cause the global ocean to cool slightly, after the Pinatubo aerosols are gone the Earth is left radiating less heat than it otherwise would be radiating to space for a period afterward. This amounts to a slight positive forcing, that as it declines toward zero reduces the planetary energy imbalance. Hansen calls this the “rebound”. He doesn’t supply a number for the peak. My estimate from his chart is that the peak was about 0.16 W/m2.
Compare that 0.16 W/m2 to the number Hansen puts on the effect of the cyclical declining solar irradiance during almost the same period , i.e. about 0.14 W/m2. This factor is almost as large.
-
Susanne at 15:50 PM on 13 November 2011How to Avoid the Truth About Climate Change
Thank you people. that's what I call rapid response :) -
Bibliovermis at 15:42 PM on 13 November 2011How to Avoid the Truth About Climate Change
Susanne, Double-click the video to load the full youtube page. Copy the youtube link. Go to Keep Vid. Download the video and watch it uninterrupted. -
Utahn at 15:33 PM on 13 November 2011How to Avoid the Truth About Climate Change
Susanne, Barry's more likely to see this on his blog (linked up top). Inquire there, he's very accommodating and could probably email you his PowerPoint slides or something... -
Susanne at 15:23 PM on 13 November 2011How to Avoid the Truth About Climate Change
I don't suppose there's any chance of a transcript or a podcast? This sounds bang on topic for a group I'm working with, but my crummy wireless broadband choked at about the 3rd minute and wouldn't get through this even at 3am. I usually just sigh and pass videos by, but this time... ???Response:[DB] Over at Barry's blog Anna Haynes has posted her notes from the presentation, if that helps. Look at the November 11, 8:46 pm mark.
-
Doug Hutcheson at 13:35 PM on 13 November 2011The BEST Summary
John Hartz#6 Thank you for the link to "Capitalism vs the Climate" by Naomi Klein. As a newbie trying to get to the truth, it explains to me why the capitalists of this world are also the deniers, in large part. I had thought their abuse of scientific knowledge was from sheer bloody-mindedness, but now see it is a deeper and more sinister association. No wonder sites like this have such a hard time gaining traction where it counts. Sigh. At least I am developing an informed view of the world, which is different from the view I once held. -
Dennis at 13:19 PM on 13 November 2011How to Avoid the Truth About Climate Change
This video is excellent. If you can't get a book out in time, at least consider distributing the presentation around. -
Eric (skeptic) at 12:22 PM on 13 November 2011Australia Legislates an Emissions Trading Scheme
I am surprised to learn we have a second political party here in the USA :) IMO there is little doubt that someone who acknowledges climate change will be elected President in 2012. However the House will not acknowledge it unless the people do (may take a while) and the Senate will not propose effective legislation due to disproportionate farm state representation (it would basically be a big farm bill with some windmills and solar). I would support tax and rebate to gain popular support and remove some of the offset fluff. -
Tristan at 12:03 PM on 13 November 2011Australia Legislates an Emissions Trading Scheme
Romney abandoned his acknowledgment of climate change when it became clear that he wouldn't win the primaries otherwise -
Eric (skeptic) at 11:49 AM on 13 November 2011Increase Of Extreme Events With Global Warming (Basic Version)
Muoncounter, that's a assuming that 1995 cutoff date is meaningful. I could set the cutoff date to 1980 (half way back to 1950) and the ratio is still 62/38. The most accurate description is that there was a lull from 1970 to 1995. -
muoncounter at 11:12 AM on 13 November 2011Increase Of Extreme Events With Global Warming (Basic Version)
Additional evidence of increasing Euro heat. “The reduction in days of extreme cold is due to an increase in the average minimum temperature from 0.5ºC to 1ºC during the analysis period, while for days of extreme heat, the increases in the average maximum temperature were from 0.5ºC to 2ºC” And evidence of more frequent Euro drought. "The magnitude and frequency of the drying that has occurred is too great to be explained by natural variability alone," said Martin Hoerling, Ph.D. of NOAA's Earth System Research Laboratory ... "This is not encouraging news for a region that already experiences water stress, because it implies natural variability alone is unlikely to return the region's climate to normal." These are connected: Dry Winters In North Mediterranean Stoke Hot European Summers From an analysis of meteorological records spanning the past 58 years, Vautard et al. determine that parched conditions around the northern Mediterranean create a mass of anomalously warm, dry air that spreads northward in early summer. -
muoncounter at 10:59 AM on 13 November 2011Increase Of Extreme Events With Global Warming (Basic Version)
Eric#21: "(8/13 is still too close to 50/50 IMO)." That's 62% of the hyperactives in the last 16 years. The remaining 38% are spread over 1950-1995 or 45 years. Even if the ratio was 50/50, that would still be a very asymmetric distribution. -
Eric (skeptic) at 09:35 AM on 13 November 2011Increase Of Extreme Events With Global Warming (Basic Version)
Sphaerica and muoncounter, thanks for the feedback. The 10-15 years of stronger and more frequent storms is still a bit short to draw strong conclusions. My impression from the landfalling storms (links in #15) is that decades were heavily clustered and almost every decade will bring forth a new pattern. But that may be more applicable to landfall than all tropical storms. My view on the frequency vs strength is that increasing strength seems like a no-brainer, but frequency requires both warmth and dynamics, warmth alone is not enough to spawn tropical storms. "Hyperactive" ACE trends (last link in #20) seem to reflect that increase in strength which could still use a little more evidence (8/13 is still too close to 50/50 IMO). -
Rob Honeycutt at 08:13 AM on 13 November 2011How to Avoid the Truth About Climate Change
Dr Bickmore... IMO you are hitting on exactly the right issue. It's one thing when Chris Mooney writes his book on why conservatives have a hard time accepting science. It falls on deaf ears with regards to the people who most need to understand the challenge. When a conservative such as yourself writes a book on this topic it's a different matter. It means more of the people who need to be reconsidering their position will actually be able to hear what's being said. -
actually thoughtful at 07:22 AM on 13 November 2011Australia Legislates an Emissions Trading Scheme
I can't help but look at this through the lens of US policy (but very fun to get the insider view on Australian politics). At this point, I base my hopes on the fact that US politics often change on a dime. If we get a hot summer in 2012 (even in a La Nina this could happen) leading up to the elections, and these effective policies in Australia, Europe, Scotland, BC are highlighted - we could end up with a rational policy in the US. As much as Obama has given lip service to climate change, the facts remain that he made health care his primary issue, and completely botched the effort in the US Congress to get cap and trade passed. It could be true that a Romney election is the path to an effective US response, just as only Nixon could go to China. For all the noise in the US - there are only 20% firmly against, and another 20% doubtful. The rest of us have a pretty firm grasp of reality (perhaps only on this issue...). -
Utahn at 07:01 AM on 13 November 2011How to Avoid the Truth About Climate Change
I can't recommend this enough for a certain moderate or conservative in your life who has been deceived. I think the tone is perfect for that type... -
chuckbot at 07:00 AM on 13 November 2011CO2 Problems: Parallel concerns breed parallel denial
re 25 (chriskoz): My understanding is that basicity is defined by the concentration of OH- ions in the same way that acidity is defined in terms of the concentration of H+ ions. A solution is basic when its basicity outweights its acidity - that is to say, there are more OH- ions than H+. When this happens, the pH is greater than 7 (7 being the pH of a neutral solution.) One thing that I didn't know about before researching OA is that alkalinity and basicity, which I had previously treated as synonymous, are actually distinct concepts. Acidity, alkalinity, and CO2 are related in the ocean, and the Gazeau 2007 paper I mention used this interrelationship to study the effects of high CO2 on shellfish calcification in a way I thought was clever. So I think that it is fine to describe a pH change from 9 to 8 as acidification of a solution that remains basic. Your discussion in #26 seems right on though :) -
chuckbot at 06:38 AM on 13 November 2011CO2 Problems: Parallel concerns breed parallel denial
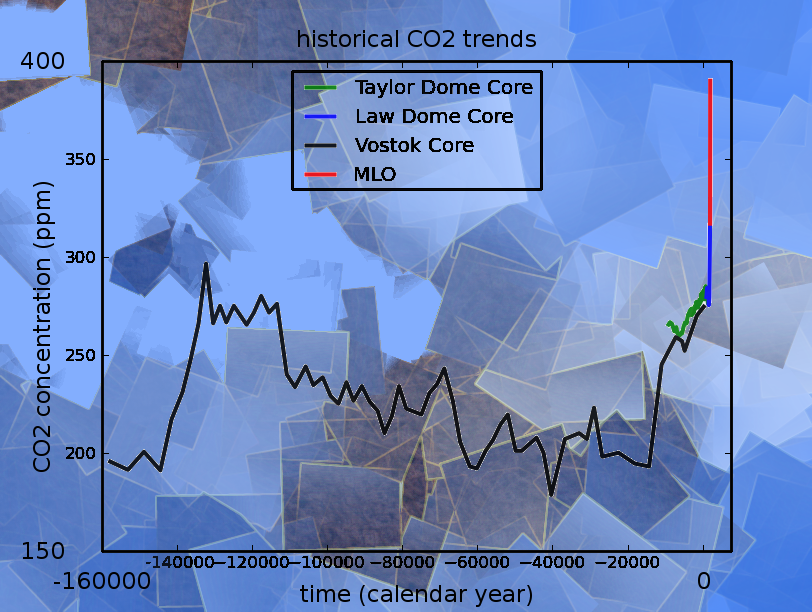
Images fixed and captioned! re:23 (Bruce) I have thought about a logarithmic time axis - it would be a neat way of comparing events over different time scales. Unfortunately that collapsing of scales can be a conceptual barrier to people who aren't used to thinking with logarithms. For example, I have shown people this image: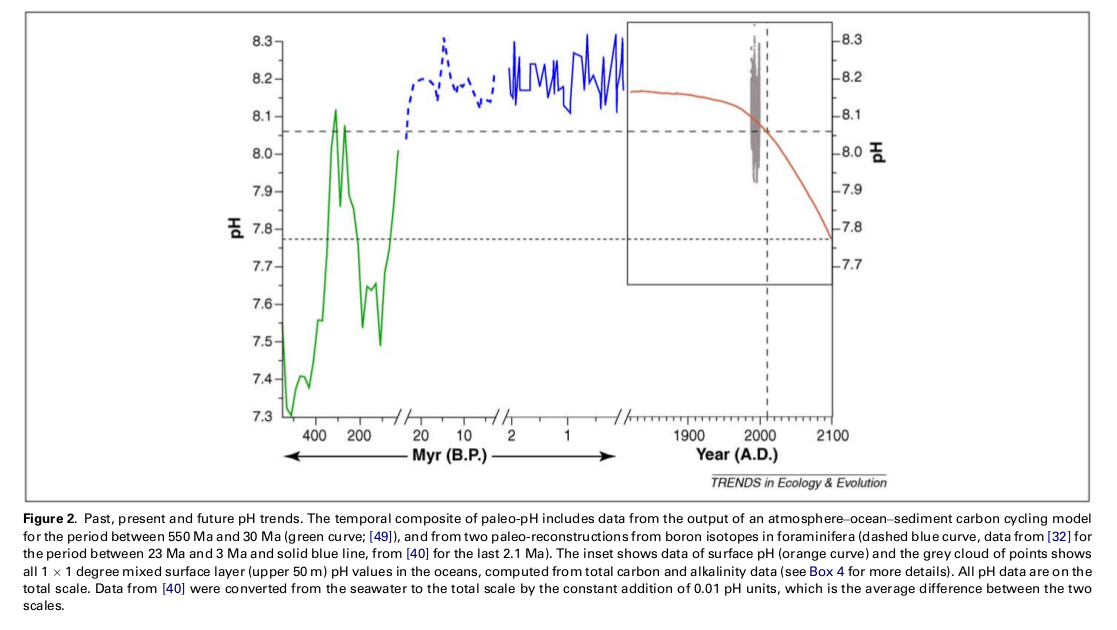 and even after explaining that the changes are taking place on very different time scales, they still see the current event as being comparable to the 100myear scale oscillations. It would be neat though. I made some fancy backgrounds for some of my graphs and the one I did for the Vostok/Taylor/Law/MLO concentrations was my favorite. I was reading a lot of HP Lovecraft at the time and especially liked the story At the Mountains of Madness, which is set during a geological research expedition to Antarctica. I based it a lot on how that story felt to me
-
Riccardo at 06:36 AM on 13 November 2011How to Avoid the Truth About Climate Change
Oh yes, they are definitely "trying too hard to avoid the truth". Good job Barry, thank you for sharing your lecture. -
Steve L at 05:29 AM on 13 November 2011The BEST Summary
Hi Brent, feel free to quote of course. I'm just a biologist, though, and not someone with any special insight on the underlying physical processes your engineers are interested in or the relevant psychology regarding how that information is (mis)interpreted. My tentative conclusions in comment 1 are based on things I learned here at SkS. But what to do with those conclusions? How do we move on? I'm not sure that a discussion with people whose professional opinions of their opponents include such characterizations is a good way to do it. Your idea to point them here is a good one, if they're interested in science. I think your efforts are laudable. Best of luck. -
Tristan at 05:06 AM on 13 November 2011Australia Legislates an Emissions Trading Scheme
Unlike the USA, China is not burdened by a major political party in denial. Haha. Or a 2nd political party.
Prev 1423 1424 1425 1426 1427 1428 1429 1430 1431 1432 1433 1434 1435 1436 1437 1438 Next


