


 Arguments


Recent Comments
Prev 1432 1433 1434 1435 1436 1437 1438 1439 1440 1441 1442 1443 1444 1445 1446 1447 Next
Comments 71951 to 72000:
-
Bob Lacatena at 00:48 AM on 22 October 2011CO2 lags temperature
Briago1, This is in response to your point 4 here.4) I keep reading that ice cores show in increase in temperature after an increase in CO2 (this is debatable, but I'll skip that). This tid bit is then being used to say that since CO2 has risen x amount in 30 years, that now we are going to have a temperature rise in the next decade
No, this information is not being used in that way. Our understanding of physics and myriad other observations tell us what increases in CO2 will do. The ice cores (and other proxies, and other periods of time besides the ice ages) simply confirm this understanding by demonstrating that increasing CO2 levels did affect global temperatures (as would be expected) in the past. But the ice core inference is not the source of the conclusion, but rather simply one of many sources of confirmation. -
bugai at 00:45 AM on 22 October 2011Human CO2 is a tiny % of CO2 emissions
Antwort an Bibliovermis. The Suess effect does not show that the CO2 increase is due to emissions. It only shows that we do emit CO2. This we perfectly know without Suess. Antwort an Dikran Marsupial. Your claim is that the mankind influences the natural CO2-sinks via CO2 emission. This is very shaky as the antropogenic source is negligibly small. Why should it so drastically change the natural sink? Especially around 1850 when the antropogenic source was even some 10 times smaller. It is much more reasonable to assume the change in the CO2 sink is due to a different, more powerful influence, like pollution with fertilizers. For this, there is no more balance between NATURAL CO2-sources and CO2-sinks. And - the 5 years IS the relaxation time for extra CO2 (experimentally proven). Concerning the 74 years or 1000 years for thermocline - this is only if you neglect photosynthesis by phytoplankton. -
Bob Lacatena at 00:41 AM on 22 October 2011Positive feedback means runaway warming
Briago1, A response to the first part of your question here.1) ...as the atmosphere warms that will release more carbon dioxide from the oceans making the atmosphere even warmer. This can not be the case otherwise if the atmosphere ever got a little warm, it would be doomed to continue to heat up.
You are confusing a runaway scenario with a simple positive feedback. If the CO2 released by the ocean warms the atmosphere less than the amount that caused the CO2 release, then as things warm, the ocean will release less CO2 in response. In math it is a simple convergent series, like 1 + 1/2 + 1/4 + 1/8 ... → 2. -
Tristan at 00:35 AM on 22 October 2011A Scientific Guide to the 'Skeptics Handbook'
Has there been a rebuttal to JoNova's response? Her claim: "Indeed when I have bothered to debunk Cook, Cook had no reply, and didn’t apologize for all his errors, or his use of a flagrantly deceptive graph either." -
Rob Painting at 00:20 AM on 22 October 2011How Increasing Carbon Dioxide Heats The Ocean
Sphaerica - fair comment. I'll go over it in the next day or two and tweak a few things to make it clearer. I did produce a graphic but wasn't happy with it - I'll reassess that too, but I'm in the middle of writing a few other posts which rate higher on my agenda. -
Hyperactive Hydrologist at 00:16 AM on 22 October 2011Sea levels will continue to rise for 500 years
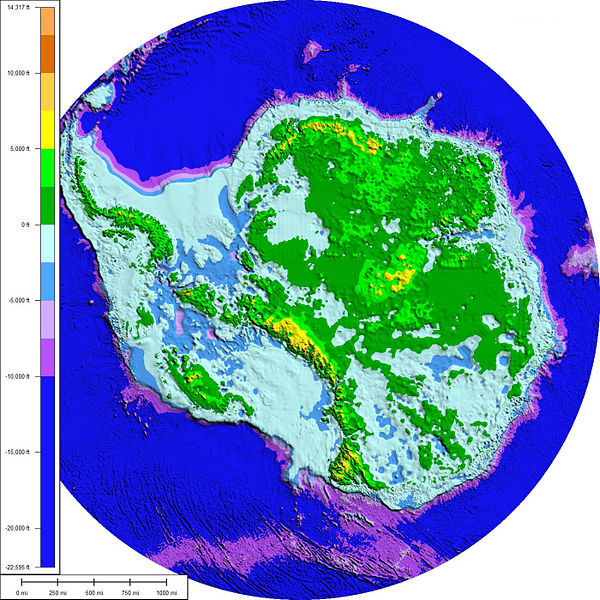
I still feel catastrophic collapse of the Greenland ice sheet is unlikely. If you look at a topographic bedrock map of Greenland the central region is lower than the surrounding perimeter especially on the eastern side where there is a mountain range. I think once the glaciers retreat from the sea we could see a slow down in ice loss. The central region, which contains the majority of the ice, should be relatively stable.
However, Antarctica shows a very different picture,especially for the Western Antarctic Ice sheet. Much of this region is actually below sea level and a large increase in ocean warming could potentially destabilise the ice sheet.
I think once the glaciers retreat from the sea we could see a slow down in ice loss. The central region, which contains the majority of the ice, should be relatively stable.
However, Antarctica shows a very different picture,especially for the Western Antarctic Ice sheet. Much of this region is actually below sea level and a large increase in ocean warming could potentially destabilise the ice sheet.
-
Bob Lacatena at 00:03 AM on 22 October 2011How Increasing Carbon Dioxide Heats The Ocean
30, Rob, I have to admit, as a result of guinganbresil's comments, I went back to the post and started to try to work things out, and realized there's some ambiguity that led me to a state of mild confusion. I think my problem lies primarily in that there are two gradients involved (ocean/air and deep-ocean/cool-skin) and it's not always clear which is being discussed. I think at most points that when you talk about the gradient being decreased, you are referring to the latter (ocean/cool-skin), not the former (ocean/air), but it's not always clear in the text. For example, when you talk about GHGs warming the cool-skin layer, this will increase the ocean/atmosphere gradient (the ocean being warmer) which implies the ocean will cool faster, but it decreases the deep-ocean/cool-skin gradient, which I think is the real issue, because it blocks heat loss from the bulk of the ocean through the cool-skin layer. But that's not always clear. In addition to this, there are obviously different states in different time frames (e.g. during the day, temperatures are X, Y, and Z, and the system is dominated by solar radiation, while that changes at other times and under other conditions). Is it possible to clarify all of this? Perhaps a diagram showing the relative temperatures and net flows in different situations? [In my mind the system has 5 possible components, the deep ocean, the cool-skin layer, the atmosphere, and then one of two sources of radiation, either the sun or clouds/atmosphere/GHGs.] I think that guingabresil's problems come from focusing on the ocean/atmosphere interface rather than the more important (in this situation) deep-ocean/cool-skin interface... or so I think. Again, I haven't completely wrapped my head around it enough to say this with authority (it's Friday, and it's been a very long week!). -
Rob Painting at 23:24 PM on 21 October 2011How Increasing Carbon Dioxide Heats The Ocean
guinganbresil -..... but the paper you link to in the text above the figure was published in 2001 The paper linked to is a description of MAERI, the measuring instrument, and it details how measurements are carried out. "Unfortunately Minnett does not source his graph" I believe the data were obtained during a survey with a different purpose in mind. I don't think this has ended up in the peer-reviewed literature, but Professor Minnett informed me he has a postdoc taking up work on it. "Looking more closely at the orders of magnitude..........." I can see you're not really following this, sorry but its a very complex subject and not easy to put into layman terms (at least not for me) but I hope this helps: - The ocean cool skin is a surface layer where molecular processes dominate, i.e conduction is the form of heat transfer. Therefore a temperature gradient needs to exist (confirmed by Khundzhua [1977]) . - Greenhouse gases, such as CO2, warm the cool skin and lower its gradient. The lowered gradient slows the heat flow of heat out of the ocean into the atmosphere. This mechanism allows the oceans to build up heat. - This mechanism is pervasive because the increased greenhouse effect is a global phenomenon. In other words, all parts of the ocean surface are subjected to its influence. - Changes in heat associated with changing winds, humidity, evaporation etc, can indeed be much larger on short timescales, but are local effects, causing the ocean to either store more or less heat over these shorter intervals. However, the greenhouse gas effect on the skin layer gradient is still toiling away in the background, it's ever-present 24 hours a day (except for those rare occasions when it breaks down momentarily), and is global in scale. So any heat headed for the atmosphere has to run the gauntlet of this greenhouse gas-warmed ocean cool skin layer, and in the process a little bit of heat is stolen away and stored in the ocean. - Because of the very long-lived nature of carbon dioxide, it can affect the cool skin layer temperature gradient for hundreds to thousands of years. Of course in Earth's deep past, higher levels of carbon dioxide corresponded with higher ocean temperatures. So the whole conceptual framework shows coherency - elevate carbon dioxide, and the oceans warm - just like they did in the past, and just like they are now. - Now what you, and a couple of earlier commenters, seem to be inferring doesn't make any sense whatsoever. If wind speed, humidity etc (there's a bunch of other factors) were the long-term controls on the cool skin layer, wouldn't the ocean temperature just fluctuate within a set boundary determined only by those factors? (windspeed etc). - In your hypothesis (?) how could you account for the 20,000 year ocean warming that took place in the Paleocene-Eocene termal Maximum (PETM)? Windspeed? How are the oceans warming now? -
Jeffrey Davis at 23:22 PM on 21 October 2011Berkeley Earth Surface Temperature Study: “The effect of urban heating on the global trends is nearly negligible”
re: 10 and Muller's past Luke 15:3-7 -
Hyperactive Hydrologist at 23:18 PM on 21 October 2011Berkeley Earth Surface Temperature Study: “The effect of urban heating on the global trends is nearly negligible”
Surely now this issue can be put to bed. It would be nice to see Watts admit this and move on. I won't be holding my breath. Kudos to Muller and hopefully he has learned to keep his mouth shut until he has published papers to back up his claims. Extraordinary claims require extraordinary evidence one of the basic principals. -
John Russell at 23:07 PM on 21 October 2011Berkeley Earth Surface Temperature Study: “The effect of urban heating on the global trends is nearly negligible”
[I just posted the following elsewhere and thought it worth posting here as it might trigger ideas.] Given that the BEST study uses the data gathered by other studies -- the results of which generally agree with one another -- to produce the 'graph of graphs', I'm at a loss to understand how the result could have turned out to be be anything other than a general confirmation of the previous studies. It could only have been different if all the original scientists had carried out their work fraudulently, or the BEST team had been fraudulent. Of course, neither had. I for one have enough trust in scientists to believe that whenever you put a large group of them together, they can't do anything other than arrive at an honest answer. Only the occasional individual scientist has ever been exposed as a charlatan. So, as sure as eggs is eggs, the denial argument will now turn to, "OK it's getting warmer -- but it's not caused by humans". As a response perhaps the sceptics should be asked to recommend/approve a large team of qualified climate scientists to answer that question. Then we can put that one to bed and move on to the next. A.s.a.p, please. Tempus fugit and climate change just ain't going away. -
Dikran Marsupial at 22:51 PM on 21 October 2011Human CO2 is a tiny % of CO2 emissions
bugai wrote: "1. It is assumed, the "natural" sources/sinks of CO2 are still in a perfect equilibrium. Who has proven that? No, the natural sources and sinks were in approximate equilibrium prior to the industrial revolution. Anthropogenic emissions have disturbed this equilibrium and hence the natural carbon cycle is in a state of imbalance in an attepmt to restore the equilibrium. This is demonstrated by the fact that atmospheric CO2 is rising at a rate of about half anthropogenic emissions, which implies that the natural environment is a net sink, taking in more CO2 than it emits. 2. The humans emit just 5% of the total CO2 influx. This is nothing and could increase the CO2 percentage in the air by the same 5%, no more. The flaw in this argument is that while humans emit only 5% of the total CO2 influx, the natural environment is responsible for 100% of the outflux, which we know to be in excess of natural emissions. The annual growth in atmospheric CO2 depends on the difference between total emissions and total uptake. Anthropogenic emissions are large comparted to the natural net flux, and hence are what currently governs the increase or decrease of atmospheric concentrations. where tau is the relaxation time. We know that tau is somewhere between 5 and 10 Years." This is incorrect, the residence time is about 5 years, but for CO2 the residence time and relaxation time (known as "adjustment time" in climatology) are not the same. For the initial response (governed by uptake into the thermocline) the adjustment time is of the order of 74 years, the full response takes much longer. See the articles on residence time for discussion (an advanced version is in preparation). -
CBDunkerson at 22:44 PM on 21 October 2011Berkeley Earth Surface Temperature Study: “The effect of urban heating on the global trends is nearly negligible”
Muller is, no doubt, speaking of himself (and possibly others) when he describes those who were "properly sceptical". The problem is that there was nothing 'proper' about it. As MA Rodger notes, the idea that surface temperature anomalies were significantly off had been overwhelmingly disproven long before the BEST study even began. Multiple different organizations using different data and methodologies had found consistent results. Surface and satellite records were in close agreement. Numerous studies had conclusively shown that UHI effects were negligible. Yet Muller mouthed off that Anthony Watts was a 'hero' for showing the 'serious doubts' about these values. He went around spreading one obviously false claim after another (e.g. 'not a single polar bear has died due to global warming'). He was not 'properly sceptical'. He accepted pure nonsense at face value and promoted it as 'established truth' despite overwhelming evidence to the contrary. Muller deserves credit for not allowing his bias to infect his work and accepting reality once he had himself done the research to confirm it. This places him a step above many other 'skeptics' (e.g. Roy Spencer). However, the fact remains that Muller assumed things which were untrue and promoted them as 'fact'. The UHI and 'inaccurate surface temperature record' myths were not the only false claims Muller promoted. Maybe this experience will cause him to re-examine those biased assumptions and/or avoid making unsubstantiated claims in the future, but for him to now say that he was 'properly sceptical', rather than owning up to his false statements even after his own research has (again) disproven them suggests that the denial continues. Muller has shown that he still does actual science, and thus I'll look at his work in the future. However, his failure to accept responsibility for the misinformation he promoted will prevent me from considering anything he says on the subject of climate change until he has published research to support it. -
Bibliovermis at 22:31 PM on 21 October 2011Human CO2 is a tiny % of CO2 emissions
Bugai, Look up Suess effect, in reference to the work of Hans Suess, for independent, empirical confirmation that the CO2 is from fossil fuel combustion. I apologize for not providing a direct link, as this is being tapped out on the phone. -
John Russell at 21:56 PM on 21 October 2011Berkeley Earth Surface Temperature Study: “The effect of urban heating on the global trends is nearly negligible”
@Lassesson writes: "What happened around 1865-1870 in figure 3 and where did the huge peak around 1880 come from?" The 'huge peak around 1880' was probably a legacy of Krakatoa or the sun's activity or some some other natural event at the time. Human-caused warming sits on top of any natural variation in temperature. @TScanlon. I don't believe this news is going to put the nail in the coffin of denial; it will just move denial on to the next -- and more difficult to prove to non-scientists -- argument. Namely, that "OK, the warming is real; but it's caused by natural processes". The argument is certainly far from over. -
MA Rodger at 21:14 PM on 21 October 2011Berkeley Earth Surface Temperature Study: “The effect of urban heating on the global trends is nearly negligible”
Watts did say on his site when the BEST project was announced "It (BEST) may very well turn out to agree with the NOAA surface temperature record, or it may diverge positive or negative. We just don’t know yet." This was after giving a pretty strong approval of the project and its methodology. So if Watts doesn't accept the findings, he will have a hard time presenting a rational reason for doing so. Of course, the key word here is "rational". Watts' Urban Heat Island complaints, even the BEST project, is plain irrational. Do we not have 30 years of satellite records that already give independent confirmation of the surface temperature records? -
panzerboy at 20:39 PM on 21 October 2011Berkeley Earth Surface Temperature Study: “The effect of urban heating on the global trends is nearly negligible”
I'm always ready to counter the "Its the Urban Heat Island effect" with the following. The Urban area of the Earth's surface is 1%. Average global temperature has increased by 0.8 degrees celsius. Do the math, urban areas need to have increased by 80 degrees celsius in order that 1% area to be responsible for the global temperature increase. Now, I'm sure that's an over-simplification please let me know if/how I've got things wrong. -
newcrusader at 20:03 PM on 21 October 2011Berkeley Earth Surface Temperature Study: “The effect of urban heating on the global trends is nearly negligible”
Dr.Muller set Anthony Watts and the Koch empire up like a 'Science'. They where expecting a data conclusion far different then this. Perhaps now some of the skeptics can be marginalized even further. -
bugai at 19:30 PM on 21 October 2011Human CO2 is a tiny % of CO2 emissions
Well, the story sounds inconvincing for me. 1. It is assumed, the "natural" sources/sinks of CO2 are still in a perfect equilibrium. Who has proven that? 2. The humans emit just 5% of the total CO2 influx. This is nothing and could increase the CO2 percentage in the air by the same 5%, no more. The CO2 concentration not far from equilibrium behaves as d(CO2)/dt = Source - (CO2)/tau where tau is the relaxation time. We know that tau is somewhere between 5 and 10 Years. The equilibrium concentration CO2 = Source*tau. If you add extra (antropogenic) source Sa, the equilibrium concentration changes to CO2_new = (Source + Sa)*tau Because Sa = Source*0.05, we have new equilibrium CO2_new = 1.05*CO2 (natural). That is a negligible change. Result: antropogenic emissions cannot possibly account for observed CO2 rise. No way. However, if there is a significant change in the relaxation time "tau", the CO2 concentration can change dramatically. The relaxation time is defined by the CO2 absorption by the ocean surface and its consumption in there by the phytoplankton. The biological consumption is very fast, comparable with the abiotic purely ionic exchange with the atmosphere! It is known that due to pollution with fertilizers and pesticides large regions of ocean lose phytoplankton. According to some "studies", we have already lost up to 40% of phytoplankton since mid-1900. If true, this has certainly a big influence on the relaxation time "tau" and can easily explain the CO2 rise. Another certain reason for CO2 rise is the observed warming of the last century, because the water temperature explicitely influences the relaxation time tau. These are the two main reasons for CO2 rise, not the tiny emission by the fuel combustion. When you bathtube is overflowing, you should either check whether you opened the tap too far, or you check the sink. And very often it is the case that you must call a plumber to clean the sink. -
jyyh at 19:26 PM on 21 October 2011Sea levels will continue to rise for 500 years
Is this the new lowest bound? anyway nice to see sigmoidal curves on a projection for they may be found also on the ice core record. -
JMurphy at 18:34 PM on 21 October 2011Berkeley Earth Surface Temperature Study: “The effect of urban heating on the global trends is nearly negligible”
"...purveyor..." -
JMurphy at 18:32 PM on 21 October 2011Berkeley Earth Surface Temperature Study: “The effect of urban heating on the global trends is nearly negligible”
Watts is not happy and is now trying to weasel out of his previous support for the study. This is final proof that (alongside his site's constant references to cold records and general lack of credible scepticism) he is indeed one of those whose doubt about global warming this project's results should silence - if he were truly sceptical. Reading him and his followers over on WUWT is to see the sort of hurt incomprehension evident from similar supporters of creationism. If Watts can't now accept reality, he deserves to be side-lined as an irrelevant anti-science pervayer. Pielke Sr isn't happy either, surpisingly enough...not. And Judith Curry is still trying to work out how to spin the results so she can still argue one way while trying to appear neutral, i.e. friendly to the so-called skeptics. "My hope is that this will win over those people who are properly sceptical," Richard Muller, a physicist and head of the project, said. "Some people lump the properly sceptical in with the deniers and that makes it easy to dismiss them, because the deniers pay no attention to science. But there have been people out there who have raised legitimate issues." Are any of those I have named "properly sceptical" ? -
Lassesson at 18:25 PM on 21 October 2011Berkeley Earth Surface Temperature Study: “The effect of urban heating on the global trends is nearly negligible”
What happened around 1865-1870 in figure 3 and where did the huge peak around 1880 come from? -
TScanlon at 16:31 PM on 21 October 2011Berkeley Earth Surface Temperature Study: “The effect of urban heating on the global trends is nearly negligible”
When a skeptic like Muller does a 180 and starts publishing data like this and the confirmation of long term trends you know that the argument about climate change is over. Saw some fantastic new technologies are available for energy production. And the windfarm near our town has been running non-stop for a few months now. -
guinganbresil at 15:12 PM on 21 October 2011How Increasing Carbon Dioxide Heats The Ocean
Rob - I noticed that the graph you show from RealClimate (Figure 2 above) is from R/V Tangaroa in 2004, but the paper you link to in the text above the figure was published in 2001. Unfortunately Minnett does not source his graph (was it published and peer reviewed?) - I am curious if the researcher controlled for wind speed or humidity - given that both are factors in the forced heat transfer case. Looking more closely at the orders of magnitude, I see that the effect of clouds shown in figure 2 above is ~100 W/m2 with a slope of ~0.002 K/(W/m2), so a 4 W/m2 change due to a doubling in CO2 would provide a 0.008K change in the skin layer temperature difference. Sun, wind, humidity and clouds jerk the value from -0.6 to +1 K - that is two orders of magnitude larger... -
Riduna at 14:30 PM on 21 October 2011Sea levels will continue to rise for 500 years
One should question the utility and verity of a model which ignores “what is happening with the climate, but … focuses exclusively on sea levels. Others have noted the obvious, that one can not purport to model future trends in SLR, be they in respect of 100 or 500 years without taking into account those factors most responsible for it, namely the rate at which land based ice is expected to melt and the causes for that melting. It is overly simplistic to assume that anthropogenic emission of greenhouse gases will be either the sole or even the major cause of ice melting over the next 100 years. Nor can one ignore the unprecedented warming of the Arctic and Southern Oceans and the effects this is having. It is a strange model which apparently ignores the potential for rapid increase in and massive loss of polar ice. Hansen and Sato 2011 hold the view that loss of this ice will double each decade this century, that in consequence SLR this century will be non-linear and, starting from a low base, will continue rising relatively slowly in the first half of this century but much more rapidly and with disastrous consequences in the second half – particularly during the last decades of the century. Their conclusions are consistent with those of Shakhova et al 2010 who draw attention to the dangers posed by the melting of permafrost, particularly on the seabed of the Siberian Central Continental Shelf, producing massive release of methane. They note that this is now occurring and warn that emission of 3.5 gigatonnes of methane, about 0.1% of Siberian methane deposits, would be sufficient to cause abrupt climate change. Antarctica is already being affected by warm ocean currents causing near collapse of the PIG and Thwaites glaciers, draining almost 30% of the WAIS, with capacity to cause SLR of ~1.5 metres. These currents have the potential to cause break-up of WAIS and EAIS shelves, causing major increase in the rate of glacier discharge. These events are now occurring and will continue for the rest of this century. Loss of mass from the Greenland ice sheet is, as predicted by Hansen, more than decadaly doubling, accelerating and shows no signs of slowing. Nor could it, since the Arctic Ocean is warming so rapidly that it is predicted to be seasonally ice free within 20 years with consequential loss of albedo and increase in the rate of future warming. Given these considerations, I find it extraordinary that the model used by Aslak Grinsted should be regarded as of any reliability in predicting SLR over the next 50 years, let alone the next 500. In this regard it should be treated, as is the IPCC 4AR, as very conservative because it largely ignores the causes and reality of polar ice loss – in other words, what is already happening. -
guinganbresil at 14:27 PM on 21 October 2011How Increasing Carbon Dioxide Heats The Ocean
Sphaerica - "The rate of flow of heat out of the ocean is determined by the temperature gradient in the 'cool skin layer'" [ - semantics/word-gaming snipped -] "Under cloudy conditions, the cloud cover radiates more heat back down toward the ocean surface than happens under clear sky conditions." Yes, so the heat loss from the surface goes down, and the temperature difference of the 'cool layer' goes down per Eq. (5) I notice that data from Minnett et al 2001, Figure 12 shows that under low wind conditions (during the day), the cool layer vanishes and becomes warm due to solar heating. So I should amend my previous statement - the long wave emission supports the cool skin layer at a dead calm, with clear skies, at night. -
scaddenp at 13:56 PM on 21 October 2011Sea levels will continue to rise for 500 years
Careful with those maps. Something above the sealevel might look okay but if it is on soft sediment, then it can still succumb to coastal erosion. Deltas, dunes, and dune barriers over former estuaries would be examples. Sealevel rise that effect longshore sediment transport can cause a switch in coastal processes from prograding to aggrading. If you already have issues with coastal erosion, then expect it to get a lot worse in next 100 years. -
Stevo at 13:49 PM on 21 October 2011Sea levels will continue to rise for 500 years
adelady, sorry, I was wearing my ironic/sarcastic hat when I wrote about ending up on the beachfront. In the case of Brisbane we are already at the stage where we are running out of land into which to accommodate our expanding population. I cannot see any action saving the homelands of many Pacific atoll dwellers and delivery of practical aid to these people is happenning way too slowly. Inevitably this will lead to displacement of these populations. How effectively do we expect we will prepare for and cope with SLR changes to our major cities, let alone the myriad other challenges posed by a changing climate when so far we have failed to supply enough sand bags to Kirrabati, and the "it isn't happenning" strain of denialism is still flourishing in this country? -
adelady at 13:37 PM on 21 October 2011Sea levels will continue to rise for 500 years
Stevo "... ending up on the beachfront.." The really disastrous Oz lifestyle consequence is that all that lovely sandy beach will disappear under the waters. It won't re-form on any historical time-scale. And, let's be honest, the geological time-scales needed to reestablish such landscape features are not terribly relevant to us or our several generations of descendants. -
Stevo at 13:26 PM on 21 October 2011Sea levels will continue to rise for 500 years
After looking at the map of Brisbane which DB provided I take no joy in the prospect of my home eventually ending up on the beachfront, while the airport, seaport and the business/industrial area in which I work becomming seabed in moreton Bay. I'm sure those displaced by such SLR will be consoled by the fact that they are only a minority. Before we even think of our own home towns I'm more concerned for the people in Tuvalu and Kirrabati. They are feeling the effects of SLR now. -
muoncounter at 13:19 PM on 21 October 2011Sea levels will continue to rise for 500 years
DB: "savvy investors should avoid Edam cheese futures..." Actually, the Dutch are probably better off than most. Due to climate change and relative sea-level rise, the dikes will eventually have to be made higher and wider. ... Currently, reinforcement of the dike revetments ... is underway. The revetments have proven to be insufficient and need to be replaced. This work started in 1996 and should be finished in 2015. In that period the Ministry of Public Works and Water Management in cooperation with the waterboards will have reinforced over 400 km of dikes. Imagine that ... a government that can do something -- with popular support. Guess it really does take a crisis to solve a problem. -
guinganbresil at 13:17 PM on 21 October 2011How Increasing Carbon Dioxide Heats The Ocean
Sphaerica - "Our discussion is based on a recognition that except for very light winds (perhaps less than 2 m/s) the Richardson number for the upper meter of the ocean is very small. As in the atmosphere immediately above the surface, heat transfer is forced or passive rather than free." The discussion that follows for the next two pages discusses the interaction of wind with the surface... forced heat transfer. On the bottom of page 271, Saunders discusses free convective loss case: "In a dead calm, when the Richardson number is very large..." At the top of page 272, he states: "If we suppose that the long-wave radiation to clear skies is the major agency for heat exchange between the ocean and the atmosphere... then the temperature difference derived from Eq.(4) is about 0.5C" So, free heat transfer vs. forced heat transfer. In one case, wind and humidity - the other dead calm and clear skies. -
Daniel Bailey at 12:55 PM on 21 October 2011Sea levels will continue to rise for 500 years
@ Michael Hauber above: "For instance I live in Brisbane, and I've looked at google maps of sea level rise to see what will be lost. At say 2 metres it is only a minority of the city that is lost." Tell that to those who live in the "minority" of Brisbane who get to experience that 2 meter SLR up close and personal: "A look at Sydney shows that the city will cope significantly better"
Looking at the same effects of 2 meters SLR one surmises the denizens of Sydney to be descendents of Prince Namor, the Sub-Mariner:
"A look at Sydney shows that the city will cope significantly better"
Looking at the same effects of 2 meters SLR one surmises the denizens of Sydney to be descendents of Prince Namor, the Sub-Mariner:
 But then, Australia is but a small place compared with the world as a whole. Expanding our viewpoint beyond the parochial pale (and ignoring the easy, low-hanging fruit of the Maldives or Bangladesh [and since Miami is so "been-there, done-that"]), a quick trip to the other side of the orb brings us to the Old Country, Europe:
 Meseems like savvy investors should avoid Edam cheese futures...
[Maps courtesy of the visualization tools from the Department of Geosciences, University of Arizona]
Meseems like savvy investors should avoid Edam cheese futures...
[Maps courtesy of the visualization tools from the Department of Geosciences, University of Arizona]
-
Dave123 at 12:49 PM on 21 October 2011Arctic Ice Volume is diminishing even more rapidly than Area
Sphaerica, I know it recovers. I was simply making a point about possibly needing better phrasing here. -
Michael Hauber at 12:01 PM on 21 October 2011Sea levels will continue to rise for 500 years
Paul D at #33 You state that most of the world's population is based in coastal cities. But just because a city is coastal does not mean that the entire city will be submerged, unless we are talking entire loss of Antarctica and 50 metre type sea level rises. For instance I live in Brisbane, and I've looked at google maps of sea level rise to see what will be lost. At say 2 metres it is only a minority of the city that is lost. Once you get past something like 10 metres much of the densely populated northern corridor is lost, and the CBD is under serious threat, but much of the densely populated western and southern corridors is still fine. It would take well over 2 metres, and something of the order of 10 metres before 'most' of Brisbane is lost. A look at Sydney shows that the city will cope significantly better, and a look at Melbourne looks similar to Brisbane, except the CBD and inner city will be threatened at only about 2-4 metres. On this small sample of cities, it seems quite unlikely that most (i.e. > 50%) of the population in these cities will be impacted within 100 years. And Australia is a very coastal nation, with a dry and arid interior, and a love affair with the beach. It will only ever be a minority of the population that will be required to pack up and move within any reasonable timeframe of say a century or two. And for nearly all of these cases there will be suburbs in the same city that are 50 or so metres above sea level. There will be a small minority of cities in the world that may require a more complete abandonment/relocation. And within such a timeframe the majority of the population will pack up and move somewhere else, often to a totally different city, and do so multiple times, simply because they are bored with where they currently live, or they have changing family or employment circumstances etc. And a quite a large number of the buildings they live in will be bulldozed because they are old and tacky and we'd rather build something shiny and new than maintain the old. Can anyone give a reasonable argument that the amount of dislocation and reconstruction that we will be forced to perform due to sea level rise will ever be comparable to the dislcoation and reconstruction that we perform simply due to convenience? -
Bob Lacatena at 11:40 AM on 21 October 2011Arctic Ice Volume is diminishing even more rapidly than Area
Dave123, Arctic ice recovers each year. The loss is not cumulative. -
DSL at 10:32 AM on 21 October 2011Continued Lower Atmosphere Warming
Bob, I second muon -- take it over to WUWT under a different name, and I guarantee it'll be trumpeted in the US Congress in three days. Curry will undoubtedly give it another "wow". -
Philippe Chantreau at 10:27 AM on 21 October 2011Arctic Ice Volume is diminishing even more rapidly than Area
A wealth of science papers contained in this post. Thank you, that is what SkS is really about. -
Dave123 at 09:26 AM on 21 October 2011Arctic Ice Volume is diminishing even more rapidly than Area
Do you really mean this:annual average ice mass loss is greater than 40% over a 30 year period
that means the present mass is M2011=(M0*0.6)30 Which is a vanishingly small number -
John Hartz at 09:14 AM on 21 October 2011Arctic Ice Volume is diminishing even more rapidly than Area
Excellent post. Thank you. -
ClimateWatcher at 08:39 AM on 21 October 2011Arctic Ice Volume is diminishing even more rapidly than Area
These animations demonstrate nicely the dynamic loss of sea ice, particularly MYI from Arctic to Atlantic. -
Bob Loblaw at 08:07 AM on 21 October 2011Continued Lower Atmosphere Warming
re: dana @131 If you take it as an hypothetical, then it seems harmless. But why would he choose that as his hypothetical? Whenever I read that comment of Dr. Pielke's, I keep tripping over the phrase "but it [is] certainly not "noise" as long as the measurements are robust". What does he mean by "robust"? [Typing in my best Church Lady voice] Could it be -Satanstatistical significance? Going back to the observations/interpretations/conclusions distinction, "robust" is a conclusion. How does he know it is robust? Dr. Pielke keeps presenting interpretation as if it is a conclusion. [Note: apologies if anyone is offended by the reference toSatan- no reference to anyone in this discussion is intended. if you're not familiar with Saturday Night Live of years ago, the quote may not make sense.]Response:[DB] Maybe this will remind them.
-
Rob Painting at 05:56 AM on 21 October 2011How Increasing Carbon Dioxide Heats The Ocean
Guiganbresil - clearly wind and solar radiation are important factors over short timescales, that much is discussed in the literature cited. But think about it, how would they alone cause long-term warming? How did the oceans get much warmer than they are now during the Paleocene-Eocene Thermal Maximum (PETM) 55 millions years ago, when radiation from the sun was weaker than it is now? Readily explained by the higher levels of greenhouse gases (in the PETM) altering the gradient in the cool skin layer. -
dana1981 at 04:33 AM on 21 October 2011Continued Lower Atmosphere Warming
Dr. Pielke continues to confuse me, saying @88"If, for example, there are no more Joules in the climate system after one year, the heating (in terms of an annual average) there is no accumulation of heat that time period"
However, Dr. Pielke has also admitted that he was wrong to say 'no Joules' had accumulated in the climate system, and even when looking exclusively at the upper 700 meters of OHC. So why give an example of something which has not happened? It seems like Dr. Pielke is simultaneously arguing that global warming has and has not stopped. The latter argument is the correct one. -
Albatross at 04:17 AM on 21 October 2011Continued Lower Atmosphere Warming
All I can say Sphaerica is: "Wow! This could revolutionize AGW science". That reminds me, whatever happened to Salby's "paper" that Judith Curry was fawning over? PS: You make an excellent point with that graph @ 125 though, well done. -
Bob Lacatena at 04:13 AM on 21 October 2011Continued Lower Atmosphere Warming
127, Dikran, 128, muoncounter, I don't make the numbers up, I merely bend them to my will. To paraphrase Humpty Dumpty:`And only one for birthday presents, you know. There’s
glory57 for you!’ ‘I don’t know what you mean by “glory57”,’ Alice said. Humpty Dumpty smiled contemptuously. ‘Of course you don’t — till I tell you. I meant “there’s a nice knock-down argument for youthe globe is not warming!”’ ‘But “glory57” doesn’t mean “a nice knock-down argumentthe globe is not warming”,’ Alice objected. ‘When I use awordnumber,’ Humpty Dumpty said, in rather a scornful tone, ‘it means just what I choose it to mean — neither more nor less.’ ‘The question is,’ said Alice, ‘whether you can makewordsnumbers mean so many different things.’ ‘The question is,’ said Humpty Dumpty, ‘which is to be master — that’s all.’ -
muoncounter at 04:07 AM on 21 October 2011Continued Lower Atmosphere Warming
Sphaerica: How long before your graph starts showing up in the usual places with the headline 'the new SkS temperature reconstruction shows no warming'? -
Bob Lacatena at 03:21 AM on 21 October 2011Sea levels will continue to rise for 500 years
43, MA Rodger, Because I was lazy. Here's your graph inline: (Oh, and thanks!)
-
Dikran Marsupial at 03:18 AM on 21 October 2011Continued Lower Atmosphere Warming
Sphaerica you are a very naughty person indeed! ;o) "If you torture the data enough, nature will always confess." Ronald Coase (quoted from Coase, R. H. 1982. How should economists chose? American Enterprise Institute, Washington, D. C.)
Prev 1432 1433 1434 1435 1436 1437 1438 1439 1440 1441 1442 1443 1444 1445 1446 1447 Next


