


 Arguments


Recent Comments
Prev 1433 1434 1435 1436 1437 1438 1439 1440 1441 1442 1443 1444 1445 1446 1447 1448 Next
Comments 72001 to 72050:
-
Bob Lacatena at 03:14 AM on 21 October 2011Continued Lower Atmosphere Warming
[In case anyone missed the perhaps too subtle point, if you hand pick a short enough time series and the exact right data set(s), you can make the data say anything.] -
Bob Lacatena at 03:06 AM on 21 October 2011Continued Lower Atmosphere Warming
I think everyone should recognize the rather startling conclusion that I have discovered... there has been no appreciable warming whatsoever since 1980. None. In fact, the globe seems to have cooled by about 0.1˚C. To recognize this, since we all know that any one particular data set is subject to assumptions and errors, I have instead used all four major global mean temperature sources: HADCRUT, GISTEMP, UAH and RSS. I have used a different data set for a different time period (selected based on an arcane and intricate use of my eyecrometer that I don't have the space to go into here... I will discuss it in my soon to be published peer-reviewed paper, as well as the ever so informative and accurate press release that will announce its publication). Since the data sets do not share the same baseline, at the breaks I have "homogenized" the data by lining up the start of each new series with the old one. The result is rather startling. As I said. No warming at all since 1980! In fact, I see clear cooling! How can anyone argue with this? (Wow! Being skeptical is easy.)
-
Composer99 at 02:58 AM on 21 October 2011Sea levels will continue to rise for 500 years
MA Rodger: I was asking FundME to provide a link to his quote from the Dutch Environment Assessment Agency, not inquiring about any graph(s). My apologies if my comment was capable of being misinterpreted in that light. -
MA Rodger at 02:44 AM on 21 October 2011Sea levels will continue to rise for 500 years
Composer99 @39 I'm not sure why #40 & #41 cannot give a more useful looking graph. A link to such a graph (of my own authorship) is here (hoping it works). Graph of sea level rise & IPCC prediction ranges 1880-2100 -
SRJ at 02:42 AM on 21 October 2011Sea levels will continue to rise for 500 years
# 40 Paul from VA Taminos graph shows the trend rate as function of starting year, so you are actually comparing trend rates over periods of different lengths. That may be fine if you want to investigate how many years of data ou need to establish a significant trend (as Tamino does in the post "How long"). If one wants to demonstrate that the trend rate is increasing I think it would be better to calculate trends over e.g. a period for 30 years all for all 30 years period in the data and then plot these to se how they change over time. -
Bob Lacatena at 01:35 AM on 21 October 2011How Increasing Carbon Dioxide Heats The Ocean
24, guinganbresil, I do not see anything in the provided paper that supports your statement that "long wave radiation loss is a significant factor only in a dead calm, with clear skies." I think you are misreading the paper. Can you quote the passages which you believe lead to that interpretation? Also, please note that your supplied paper discusses the ocean-air interface in the top centimeters of the ocean only. Even if your interpretation were correct, it would only relate to how energy is exchanged between the ocean surface and the atmosphere. It would in no way change any statements or conclusions drawn in the post above:- The rate of flow of heat out of the ocean is determined by the temperature gradient in the 'cool skin layer'
- Despite being only 0.1 to 1mm thick, on average, this skin layer is the major player in the long-term warming of the oceans.
- The same concept applies to the cool skin layer - warm the top of the layer and the gradient across it decreases, therefore reducing heat flowing out of the ocean.
- Under cloudy conditions, the cloud cover radiates more heat back down toward the ocean surface than happens under clear sky conditions.
- The effect of greenhouse gases on ocean heat isn't confined to daylight hours however, they toil away around the clock.
- Given the atmospheric lifetime of carbon dioxide is many hundreds to thousands of years, we can now understand that long-lived greenhouses will also continue to exert a warming influence on the worlds oceans for a very long time.
- Because of their effect on lowering the temperature gradient of the cool skin layer, increased levels of greenhouse gases lead to more heat being stored in the oceans over the long-term.
- This ocean warming mechanism has been observed experimentally, and is also supported by numerical modeling.
- So although greenhouse gases, such as carbon dioxide, don't directly warm the oceans by channeling heat down into the oceans, they still do indeed heat the oceans, and are likely to do so for a very long time.
-
Bob Lacatena at 01:15 AM on 21 October 2011Sea levels will continue to rise for 500 years
38, Sasquatch, As I explained in comment 27 you are not going to "see" the real acceleration at this point in time (except for the abrupt seemingly linear acceleration at the advent of warming around 1979). We are in that early part of the curve where it looks flat. It is going to accelerate. We know it is because we are thinking human beings and we can put together 2 + 2. Here is the part of the curve we can see now, representing just the first 3 decades of global warming: If we zoom out a bit, here is the part we have to wait to see, the next couple hundred years:

-
Paul from VA at 00:56 AM on 21 October 2011Sea levels will continue to rise for 500 years
@38 Sasquatch, Tamino did some of his usual statistical excellence and showed strong evidence for accelerating sea level rise using tide gauge data going as far back as 1880.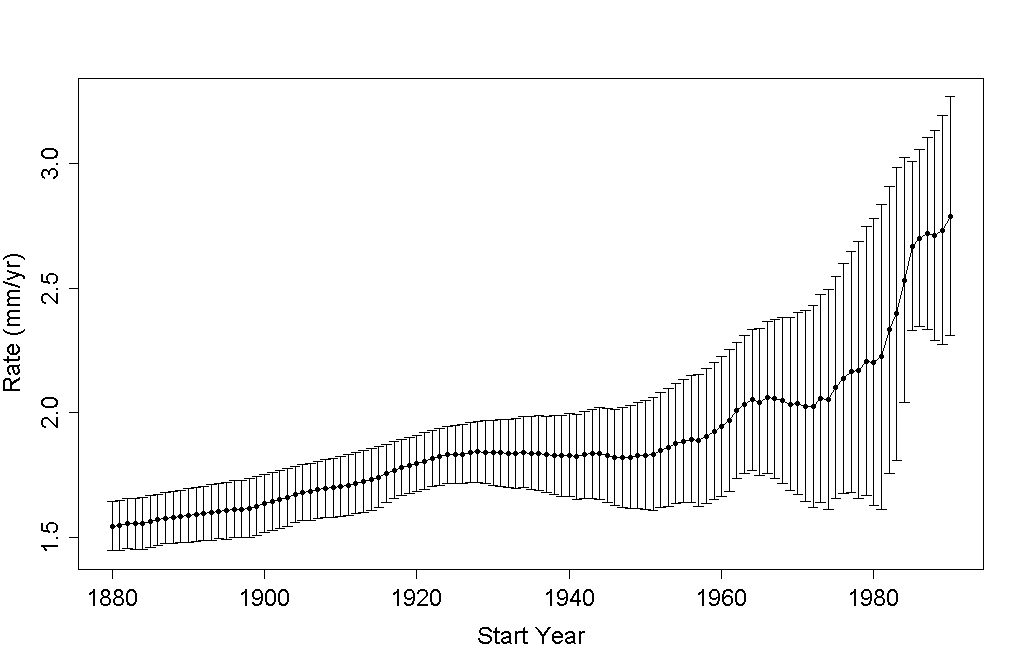
-
Composer99 at 00:51 AM on 21 October 2011Sea levels will continue to rise for 500 years
FundME: Do you have a link to the pertinent document? -
Sasquatch at 00:22 AM on 21 October 2011Sea levels will continue to rise for 500 years
Is there a way to look at this information further back? I am interested in seeing the acceleration referenced.
-
guinganbresil at 00:18 AM on 21 October 2011How Increasing Carbon Dioxide Heats The Ocean
From what I read from Saunders, Peter M., 1967: The Temperature at the Ocean-Air Interface. J. Atmos. Sci., 24, 269–273, the long wave radiation loss is a significant factor only in a dead calm, with clear skies - otherwise wind and insolation are the dominant factors... Ever been to sea? -
FundME at 00:10 AM on 21 October 2011Sea levels will continue to rise for 500 years
What is realy amazing is the level of complacency shown by the Dutch. One would think that living in a country of which 25% is below sea level at the moment they would be a little more afraid of future sea level rise. This from their Environment Assessment Agency. ""For the Netherlands, being a country with one of the most densely populated deltas, one of the threats of climate change is sea level rise. This report reveals that the Netherlands will be able to cope with sea level rise, for many centuries to come, even in a worst-case scenario of 1.5 metres sea level rise per century."" Quite amazing realy. -
Glenn Tamblyn at 21:49 PM on 20 October 2011How Increasing Carbon Dioxide Heats The Ocean
victull @15 Sea ice is made up of the part that freezes and remelts in a year, and the longer lasting semi-permanent ice. By definition the annual ice cycle can't contribute to the heat balance on longer timesacles. In contrast the decline of older ice is taking up heat that would end up in some other part of the system, probably the ocean. However the slow circulation time of the oceans would mean that a change in this thermal distribution is more likely to be limited to the oceans in the vicinity of the ice rather than the entire planet. The other factor, probably larger than the energy involved in melting the ice, is the effect that the ice melt has on Albedo - how much sunlight gets reflected by the Earth rather than absorbed. Ice reflects 80-90% of sunlight depending on how dirty it is. In contrast water absorbs about 90% of sunlight. So a major factor is the change in total heat absorption by the environment due to net ice melt exposing open water. This is probably more significant than the actual amount of heat needed to melt the ice. -
Glenn Tamblyn at 21:41 PM on 20 October 2011Sea levels will continue to rise for 500 years
Michael Hauber, Rob Painting, Paul D "Rising sea levels in the coming centuries is perhaps one of the most catastrophic consequences of rising temperatures.", "What I am scared of is eco system disruption. ", "Or agriculture disruption. " What I am truly terrified by is 'The Sum of All Off It' It is easy to get into trying to compare the relative awfulness of each aspect. But it is the sum of all of them that matters, and particularly the way the differing threats intersect to produce compound threats. The external challenges are bad enough. But when we try to factor in how these external pressures impact on the internals - social cohesion, ongoing education levels, psychological pressures, civil disorder, war etc we start to move into really frightening territory. How they can degrade our capacity to respond to the externals, leaving us far less powerful to act than we think we are. -
Micawber at 21:23 PM on 20 October 2011How Increasing Carbon Dioxide Heats The Ocean
Bob Laidlaw @21 Thanks for the very helpful comments especially on evaporation. I am interested in heat and salinity partly because of its influence on CO2 absorption. It is sensitive to alkalinity and temperature. It therefore has a bearing on ocean acidification processes I believe. -
Dikran Marsupial at 21:19 PM on 20 October 2011Continued Lower Atmosphere Warming
Eric (skeptic) The noise is the natural variability, the unforced response of the climate. The signal is the forced response of the climate. At least that is the case if you are interested in looking at the response of the climate to a change in the forcings. However, if you are pursuing a strictly statistical approach, then the assumption is that the data can be resaonably modelled as a linear trend with additive autocorrelated noise (Tamino suggests an ARMA(1,1) noise model is appropriate). So statistically the estimate of the noise is the residuals of trend. If we actually could specify what was noise we would know the signal with no uncertainty. The problem is that we can't, so a statistical model is used. If it were always easy to decide what kind of model we should use, or which vraiables we need to control for or subtract of prior to analysis, there would be no need for statisticians (who spend several years of their life learning the basics). Perhaps it would be better if you were to state the hypothesis you want to test and state the dataset you intend to use and the time-period over which you want to perform the analysis, and perhaps it would be easier to provide some more concrete advice. -
Eric (skeptic) at 20:37 PM on 20 October 2011Continued Lower Atmosphere Warming
Skywatcher, I agree, just need to define noise in your hypothesis: all forcings and natural variation other than GHG forcing. Muoncounter, the concept is simple but not quantifying the statistical significance of various combinations of X and Y in your picture. A negative trend in Y of roughly 2 or less for an X of less than 4 or so doesn't seem significant. A flat trend in Y for an X of 30 may not be significant (has the low sample size caveat). -
Rob Painting at 20:01 PM on 20 October 2011Sea levels will continue to rise for 500 years
Michael Hauber - I find your sea level scenario wholly unrealistic. Paul D has only touched on a tiny portion of the logistical problems involved. As for CO2 fertilization - that's turned out to be a fizzer so far. The latest global forest inventory finds little evidence for it, and a recent peer-reviewed paper finds none. -
adelady at 19:53 PM on 20 October 2011Sea levels will continue to rise for 500 years
Paul D I think the other issue is about the rising level of water itself. Long before many cities or suburbs are under water, all the buffers will be gone. Admittedly, many cities and agricultural areas have already "reclaimed" low-lying marshes, wetlands and mangroves. Here in Adelaide there was once an area called 'Reedbeds', no need to wonder why it was called that. Nowadays, residents of suburbs beside the waterway called a river (it's really a seasonal creek) complain bitterly about occasional flooding. But more generally, mangroves and marshes as well as beaches serve as a buffer for high tides and storms. These very low lying areas will be the first to go under the merest advance of rising waters. And the adjacent landward areas will then be exposed to the full force of storms and tides. All buffering will be gone. I know it's true of this city and many others, I just don't know how many others, but on flat land near the sea we have the airport and the sewage processing plant, the major power generator is on an island - as well as the port and its associated train lines and road transport infrastructure. Urbanising agricultural land is one thing. Commandeering land for airports and other major infrastructure will put those problems in the shade. -
Paul D at 18:54 PM on 20 October 2011Sea levels will continue to rise for 500 years
Michael Hauber@23 I think your dismissal of sea level rises as a major issue is somewhat disturbing. The biggest issue is the fact that most of the Earth's population is based in coastal cities. Indeed, the most prosperous cities are located on coastal regions. It has taken a huge amount of effort and carbon emissions to build them. Meanwhile the surrounding rural areas are crucial for agriculture. Cut away even a small distance inland and the result is a massive migration of the most economically active people on the planet onto land that is already under strain trying to produce enough food. Firstly the abandoned cities would need to be sanitised before sea waters were allowed to engulf the cities, this would have to be done in parallel with moving people and building a new city inland. On top of that, you would have resistance from rural dwellers who would be against their land being urbanised. Meanwhile you would get sea water causing problems inland as it pushes up along rivers and 'polluting' farmland. Land erosion would increase making it dangerous for any stability in building communities near some coastal areas. -
jimspy at 18:15 PM on 20 October 2011Sea levels will continue to rise for 500 years
I think the biggest take-away for me, as a complete layman, is that the difference between the red line and the green line in that graph could be the difference between losing Tuvalu and losing Miami.Response:[DB] At one meter of SLR, Miami is effectively an island, impossible to defend from storm surges and vulnerable on the whole "back side"; much infrastructure will be inundated.
At 2 meters, even more so. Anything more and all of South Florida will be under the waves, not just Miami (click for larger image):

More details for other areas can be found here.
-
Glenn Tamblyn at 16:07 PM on 20 October 2011Sea levels will continue to rise for 500 years
Adelady Yep, that is what is expected to happen - hence more flooding, more uneven supply of water for agriculture. And a greater need for even more dams. Dams serve 2 purposes. They store water so if you are loosing a storage system supplied by Nature you need more man-made storage. In addition, dams perform a vital role in flood prevention. If Mother Nature isn't providing that service for us we need extra dams for that role as well. And that extra water increasing sea level - yep again. To date Glacial melt has added more to sea level rise than Greenland/Antarctica. In decades/centuries to come the 'big boys' will take on a larger role. But not so much yet. -
Glenn Tamblyn at 16:00 PM on 20 October 2011Sea levels will continue to rise for 500 years
PirateAt50. This post is about what long term sea level will be. One way of looking at this is to ask what has happened in the past. During the previous Inter-Glacial, the Eemian around 150,000 years ago surface temps peaked at about 0.5 DegC warmer than now. But they didn't stay that high for long, perhaps only 1-2 thousand years. In contrast since the peak of this current inter-glacial, although not as warm as the Eemian, they have stayed high for 10,000 years or so before we started elevating them recently. During the Eemian around 1/2 the Greenland Ice Sheet went and sea levels rose enough to flood Denmark and turn Scandinavia into an island - The Baltic joined up with the White Sea to form what has been named the Eemian Sea Many people seem to fixate on the models and computer predictions of Climate change as if they are the only evidence. I sometimes get a sense that they treat the idea of AGW with incredulousness, as if it is an outlandish proposition that has appeared out of left-field that only really originates in some 'models' Yet the best evidence for Climate Change is that it has happened before.Response:[DB] This is what it may have looked like:

(yet another fine graphic from jg)
-
John Hartz at 15:39 PM on 20 October 2011Sea levels will continue to rise for 500 years
“In another sense, though, the IPCC was acting too conservatively, giving an overly rosy picture of the rising oceans. In the years since the 2007 report, researchers have learned more about the dynamics of ice sheets and are converging on the view that we’re facing at least a one-meter rise by century’s end if emissions aren’t tamed.” Source: Climate scientists grapple with uncertainty (though not the kind you think), Era Klein’s Wonkblog, Washington Post, Oct 18, 2011 To access this article, click here -
Glenn Tamblyn at 15:23 PM on 20 October 2011Sea levels will continue to rise for 500 years
DaneelOlivaw @4. Applying the Zeroth Law of Robotics a bit, we have a responsibilty to care for the human race as a whole, now and as far as reasonable into the future. How far is reasonably into the future? That depends on the magnitude of the impact we have. Scenario 1. The Optimistic Scenario. Humanity makes it through this century without a catastophic collapse of civilisation. All the problems we face including AGW are managed, at leat well enough to allow a decent size, modern technology civilisation to continue. Growth of knowledge continues - Nuclear Fusion finally works for example. Our descendents are left with a damaged eco-system in which to survive but they still have the social tools to make that possible. Scenario 2. The Pessimistic Scenario. Humanity doesn't do well this century at all. The Hydrological Crisis, AGW, Depeleted resources, social upheavel and a major population crash down to 1 billion or so by centuries end. In such a world the possibility of a collapse to the equivalent of a Medieval level or lower in a SERIOUSLY eco-damaged world. And one of the biggest losses in all this would be the very knowledge base we have built up over the last couple of centuries. And the Technical/Industrial Capacity that goes with it. In a Medieval world things like Carbon Sequestration or Geo-Engineering activities aren't possible. So our descendents have to eke out an existance in a world much harsher than anything we saw during the last 10,000 years. And all they could do is hang on untill the cooling comes - millenia from now. What new Religions & cults will have sprung up over that time. Will Science become the great blasphemy, the cause of ancient woe? Yes humanity are intelligent, resourceful etc. Now! But what will H Sapiens evolve into after millenia of poor nutrition, poor hygene, low life expectancy, regular famines and disease, cannibalism, low education levels, superstitions etc. Evolution can work both ways. Our adaptation may well be to go back to an earlier form. Better adapted to a harsh environment. Since we can't be sure what the coming decades may hold in terms of the dgeree to which it is scenario 1 or 2, we probably need to assume the worst till we can be sure that we are coping well enough. And that may take several generations until we are sure. -
Bob Lacatena at 14:57 PM on 20 October 2011Sea levels will continue to rise for 500 years
22, pirate, Let me intervene before this becomes at all contentious. If your opinion is that AGW may not be happening and you will only trust blatant and indisputable observations of direct sea level rise to confirm these predictions, then these predictions will look silly to you. This is especially true since, like global mean temperatures, there is a lot of noise so that short term trends are meaningless. If you instead believe the science that predicts an acceleration in ice melt along with continued thermal expansion, then the conclusions are obvious (with huge error bars) and confirmation through observation will come in time. Most scientists put themselves in the latter position. "Wary skeptics" might put themselves in the former position. You can set yourself where ever you like, but the science projects an accelerated sea level rise, and has good reason not to use a too short and noisy record at this phase of climate change to make predictions fifty to one hundred years into the future. Logic and an understanding of the mechanisms involved serve much better. -
adelady at 14:46 PM on 20 October 2011Sea levels will continue to rise for 500 years
scaddenp, your response to apirate raises an issue for me. Can't decide whether it's from something I've read or an idea that I've previously had in passing. Apart from icesheets themselves, there are thousands of areas that are (or were) glaciers as well as all those regions which get regular heavy snow. With glaciers melting and snowmelt beginning earlier in spring (no, not every single year, but on average) does that not mean that the hydrological cycle will not only cause more frequent, severe flooding on land. But it could mean that waters are returned to the ocean much more quickly. Presuming that most of the vapour which precipitates as rain or snow came from the ocean originally. Put simply, ice and snow in a warming world will lose their historical function as a 'bank' of waters. When snow and ice don't accumulate year by year and gradually slip, slide and move towards the ocean but just form and melt seasonally, that must mean that there's just more water in the ocean on average. That water will adjust to the warmer temperatures and will expand along with the rest. If anyone knows where I got this idea please give me a reference. -
Composer99 at 14:17 PM on 20 October 2011Sea levels will continue to rise for 500 years
Here is a link to the paper itself (at least, I am pretty certain that this is the paper in question). Unfortunately for lay readers such as myself, it's behind a paywall. Might I suggest linking to the article in the OP (as well, perhaps, as a link back to the original press release)?Moderator Response: [John Hartz] I have added the links per your suggestions. You are correct, the paper itself is behind a paywall. -
Bob Loblaw at 14:17 PM on 20 October 2011How Increasing Carbon Dioxide Heats The Ocean
Glenn Tamblyn @ 12: Yes, the dynamics of heat transfer into the ocean are complex - much more so than land. On land, you just have simple conduction for the most part. As the surface heats, energy is conducted downwards (or if the surface cools, heat is conducted back upwards when the gradient reverses). Conduction is a slow process, so 20-30cm down you won't even see the daily cycle - it is damped out. At 10m depth, you won't even see the annual cycle. (Exact depths vary, depending on the conductivity and heat capacity of the soil.) Contrast with the oceans - the active mixed layer (forced by winds, mixing due to salinity or temperature gradients, whatever) is much thicker, as Glenn discusses. Water also has a much higher heat capacity than soil, so it takes a lot more energy to change the temperature of the ocean that is tied to surface temperature (compared to land). In the surface energy balance model I discussed in #9, an ocean will see a lot more of the net radiation (think of it as "available energy") end up in the ocean than would go into land in a similar situation (and thus also less sensible and latent heat is transferred to the atmosphere). The inertia in warming or cooling the ocean is what leads to reduced daily and annual temperature ranges compared to land - especially the further you get away from the coast. (Look up "continental climate".) As to comments about evaporation - technically, the flux of water vapour away from the surface into the atmosphere is controlled by the gradient of water vapour and the transfer coefficient in air (also dominated by turbulent mixing), not radiation input. The catch is, that to sustain a vapour flux, you have to convert liquid to vapour, and that takes energy. But you can get that energy from any of the other parts of the surface energy balance - radiation input, sensible heat transferred down from the atmosphere (warm air passing over cold water), or from the water (i.e., cool the water). Or any combination of the three. If you don't have radiative input, sucking heat out of the air will rapidly cool the air (nighttime inversions). When the air isn't warm, then you have to cool the water, which then drops the saturation vapour pressure at the surface, which reduces the vapour gradient between the surface and the air, and reduces the flux of vapour - a sort of feedback process. (Take a deep breath - what a long sentence!!) It's a mini-version of the earth radiative balance - where increasing CO2 upsets the balance with space and the system changes temperature to compensate. -
scaddenp at 14:16 PM on 20 October 2011Sea levels will continue to rise for 500 years
apirate - look at Fig 1 in Vermeer and Rahmsdorf. Not much expected for a while yet. However, estimating the response of icesheets to temperature change still seems a very uncertain part of the science. These seem to be rates comparable with peak meltwater pulse when there was a lot more ice; but on the other hand, the rate of temperature change was 10 times slower. I'm policy that errs on the side of caution. -
muoncounter at 13:09 PM on 20 October 2011Continued Lower Atmosphere Warming
sky#121: "We actually expect to see 'flat' episodes like the ones I've highlighted, even in the rising trend" I don't know why this is such a difficult concept to communicate. Perhaps a generic example will help; such as the time series analysis is presented here. The data clearly have a rising overall trend with conspicuous flat spots. The discussion that follows is quite straightforward, although DM could offer a more informed opinion. Nowhere in the discussion is there any mention of the flat spots as being significant indicators of changes in trend.
-
Michael Hauber at 12:50 PM on 20 October 2011Sea levels will continue to rise for 500 years
'Rising sea levels in the coming centuries is perhaps one of the most catastrophic consequences of rising temperatures.' I disagree. Look at a map of the world for even a 20 metre sea level rise and its not obvious at first glance what is different. Although on second glance you notice stuff like half of Florida gone. And look around you. How much of the roads and buildings etc has been built within the last 100 years? Most of it. How bad can it be if you have to rebuild a small percentage of our cities over the next 100 years? It may add up to scary figures if you try and put it in billions or trillions of dollar terms for the globe, but if you average it out as actual cost per person per year I doubt the cost would be all that dramatic. What I am scared of is eco system disruption. Warm the planet by 5 degrees and I'd expect that nearly every ecosystem on the planet will be unrecognisable compared to today. Now perhaps man will carry on mostly unconcerned except for the sense of morale outrage over mass extinctions and ecological disruption. Or perhaps there will be very real and nasty consquences. Something like the Pine Bark beetle that affects wheat. Or a human disease that does what the pine bark beatle does. Or agriculture disruption. If we get more bad luck with droughts and less good luck with adaptive breeding, Co2 fertilisation, increased warmth and precipitation we may find ourselves with significantly reduced agricultural capability. What percentage of the worlds population could that kill? 10%? 20%? Or consider that at a dew point of 35 degrees human exposure to the outside world for significant periods of time becomes unavoidably fatal. Look at a global map of which areas may experience conditions that require humans to air condition or die under a pessimistic warming scenario and the result is far more striking than a map of which areas are under water. -
apiratelooksat50 at 12:47 PM on 20 October 2011Sea levels will continue to rise for 500 years
The pessimistic scenario would require an average sea level rise of 12.36 mm/yr for the next 89 years. The optimistic scenario would require an average sea level rise of 6.74 mm/yr over the next 89 years. Where is the acceleration in SLR required to make either one of these scenarios realistic? -
skywatcher at 12:22 PM on 20 October 2011Continued Lower Atmosphere Warming
The point is that it is still unscientific to look at the noise in the dataset and mistake noise variations for trends. We actually expect to see 'flat' episodes like the ones I've highlighted, even in the rising trend (e.g. Santer). We are a very long way from saying 'warming has halted' precisely because such short-term flat trends due to noise, exist and are common. We are now and have been above the long-term trend for most of the past decade, hardly indicating that warming has decelerated in the slightest. You can add that to analysis such as Tamino's, highlighted in the OP, where you can quantify the extent and magnitude of the drivers producing the 'noise' around the 'signal' of GHG warming. You can add that these factors are consistent with the magnitude of the drivers causing the noise (ENSO, volcanic, solar), and consistent with the expected sensitivity variations of the different temperature series (surface vs TLT etc), and you have a compelling story. That story is not of warming "halting", or anything remotely like it. -
apiratelooksat50 at 12:14 PM on 20 October 2011Sea levels will continue to rise for 500 years
"In the 20th century sea has risen by an average of 2mm per year, but it is accelerating and over the last decades the rise in sea level has gone approximately 70% faster." What decades are being referenced and what figures were used to derive the 70% faster? -
Eric (skeptic) at 11:54 AM on 20 October 2011Continued Lower Atmosphere Warming
Yes scaddenp, pretty close. But I could even more easily detrend any series to get the same information I need (natural variations). The graph with various trends shown by skywatcher illustrates my point nicely. the more prior flattenings there are the less statistically significant the current one is. You could also combine the first two and show a longer flattening with similar slope to the present. The quantification still eludes me, but I would note that we are looking at a relatively small number of "independent" samples (the number of relatively non-overlapped 10+/- year trends in the data set depicted above), so not a lot of "rolls of the dice", and thus not a very meaty probability distribution. Also my hypothesis seems relatively weak, namely that 10 year flattenings are possible from natural variations (not well-defined). -
Stevo at 11:47 AM on 20 October 2011El Niño: Unaffected by climate change in the 21st century but its impacts may be more severe
HH, again, thanks. Interesting reading. -
skywatcher at 11:07 AM on 20 October 2011Continued Lower Atmosphere Warming
For your first point, how about the below graph? 10-year 'trends' as low as that between 2002 and present are not rare even in the past 30 years. A few are plotted below: Add to that the fact that we're presently above the long-term trend for UAH, and have been for most of the past decade, and you have some (non-significant) evidence that we're actually accelerating with respect to the long-term trend. This is supported by the increase in decadal average temperatures. Not only was the 2000s the hottest decade, it was hotter than you would have expected given the difference bewtween the 1970s and 1980s, and the 1980s to 1990s. With 2011's big La Nina not depressing temperatures all that much, is there any serious doubt that warming continues?
-
scaddenp at 10:53 AM on 20 October 2011Continued Lower Atmosphere Warming
Very close though - you are looking for changes in unaccounted variability. Remove the known causes of variation, then you can look for the significance of other natural variability. Seems Tamino's model could be used for that. -
Eric (skeptic) at 10:36 AM on 20 October 2011Continued Lower Atmosphere Warming
Scaddenp (#113), that's not quite the same problem. I'm looking for the statistical significance of trend changes based on their amplitude and length of time. If, for example, prior periods show longer "flattening" or whatever the 2002-present is called, then that lowers the statistical significance of the current flattening, it is really that simple, although calculating the actual significance is not. Skywatcher, your last link in #114 is more on target as it compares 10 year trends to 30 (the prior PCA is not relevant to the trend and error bars) but he doesn't fully explain why the 10 year trends are not statistically significant. It does appear that he is plotting two standard deviations of the 10 year (blue) and 30 series (red) correcting the std deviations by the autocorrelation of the 30 year series which seems reasonable. The link you were thinking of that Papy found is even better but needs a couple more steps. For one thing the Fourier transform only finds truly periodic signals but some other transform may find the quasiperiodic signals, perhaps wavelet transforms. Then that analysis has to be reconciled with the understanding of the real world mechanisms that cause the quasi-cycles. -
adelady at 10:23 AM on 20 October 2011Sea levels will continue to rise for 500 years
bill, I think its a translation issue. I tracked the item back to the university website .... but google translate didn't translate the graphics. So I couldn't pick up any headlines or other intros to check for certain. -
bill4344 at 10:03 AM on 20 October 2011Sea levels will continue to rise for 500 years
Small grammatic note:But how frightening of times are we facing?
Sorry - this sentence seems a bit clumsy to me (I was raised by schoolteachers!) May I suggest 'But how frightening are the times that we face?' or 'But how frightening are the times we are facing?'?Moderator Response: [John Hartz] I suspect that the awkward sentence that you have flagged is the product of translating the news release from Danish to English. -
Bob Lacatena at 09:53 AM on 20 October 2011Newcomers, Start Here
130, Charles, Unfortunately, even a huge hurricane will be written off by deniers as just a fluke (and they'll find anecdotal evidence of a 1743 hurricane that was even worse, or argue that while the wind speed was high, the actual loss of life and total precipitation were dwarfed by some MWP hurricane). The "asteroid impact" you are worried about will probably need to be something like a radical and unexpected sea level rise, or the abrupt transition of a huge swath of the Amazon to savanna as a result of repeated, extreme droughts... or maybe ten years of continuous, worsening water shortages in Texas (which would be a lamentable poetic justice for some, seeing as the state has enjoyed immense profits from fossil fuels in its history). But those events are unlikely in the near term, and only an uncertain maybe within 30 or 50 years. The sad fact is that AGW is more like lead poisoning than cyanide. If you want a good, approachable start to the science, though, I suggest to anyone and everyone that they start with Spencer Weart's : The Discovery of Global Warming -
skywatcher at 09:30 AM on 20 October 2011Continued Lower Atmosphere Warming
Yep, thanks Papy, that's the one I was thinking of! -
GFW at 09:27 AM on 20 October 2011Sea levels will continue to rise for 500 years
Even assuming that Hansen & Sato have exceeded physical limitations imposed by geography and physics, there's the excellent Vermeer & Rahmstorf 2009 that gives a central estimate of 1.24 meters by 2100 on the A1B emissions path - making the red line above slightly optimistic. -
Papy at 09:23 AM on 20 October 2011Continued Lower Atmosphere Warming
"Eric, I seem to recall Tamino doing a post about empirically determining cyclic behaviour in a timeseries. Can't find it now" Perhaps this one ? -
adelady at 09:17 AM on 20 October 2011Sea levels will continue to rise for 500 years
Sorry MAR. Too lazy to go and fetch my glasses earlier - so my reading suffers a bit. (I don't notice when I've skipped a line.) -
Rob Painting at 09:02 AM on 20 October 2011How Increasing Carbon Dioxide Heats The Ocean
Barry@ 14 - I understand the rationale, but it comes down to a values-based judgement I guess. Why only consider negative consequences that will unfold in the (relatively) short-term? Are those yet to be born in the next hundred years any more important than those born in following centuries? I wouldn't have thought so, but sea level, and it's attendant problems, will only get higher over the coming centuries. Micawber @17 - knock yourself out. Click on some of the links I've provided and chase up the cited peer-reviewed literature. I doubt much of it is of interest to a general audience. Karamanski @ 19 - Absolutely! Over 90% of global warming is going into the oceans.
-
Charles of the moderate consideration at 09:01 AM on 20 October 2011Newcomers, Start Here
Thank you Shaerica for the balanced point of view. I fear you are correct in the end. As individuals, we may only be able to inform the people whose respect and trust we enjoy and try to get them, in turn, to pass it on. I agree with your assessment---tomes of material to get mired in. I limit my exposure by studying the source first. That generally takes care of the great percentage of 'informed sources,'---a great time saver. I still think we need an 'asteroid'. First atlantic hurricane with of 200+ MPH when it hits a major city. I'm not hoping for it on compassionate grounds, but that ought to do the trick. -
MA Rodger at 08:57 AM on 20 October 2011Sea levels will continue to rise for 500 years
adelady @15 And if you read on... "With large increases in the rise due to melting land ice, there is a limit to the rise because of the latent energy required to melt the ice, a limit Hansen & Sato 2011 greatly exceed. But if enough land ice turns into icebergs..."
Prev 1433 1434 1435 1436 1437 1438 1439 1440 1441 1442 1443 1444 1445 1446 1447 1448 Next


