


 Arguments


Recent Comments
Prev 1435 1436 1437 1438 1439 1440 1441 1442 1443 1444 1445 1446 1447 1448 1449 1450 Next
Comments 72101 to 72150:
-
guinganbresil at 15:12 PM on 21 October 2011How Increasing Carbon Dioxide Heats The Ocean
Rob - I noticed that the graph you show from RealClimate (Figure 2 above) is from R/V Tangaroa in 2004, but the paper you link to in the text above the figure was published in 2001. Unfortunately Minnett does not source his graph (was it published and peer reviewed?) - I am curious if the researcher controlled for wind speed or humidity - given that both are factors in the forced heat transfer case. Looking more closely at the orders of magnitude, I see that the effect of clouds shown in figure 2 above is ~100 W/m2 with a slope of ~0.002 K/(W/m2), so a 4 W/m2 change due to a doubling in CO2 would provide a 0.008K change in the skin layer temperature difference. Sun, wind, humidity and clouds jerk the value from -0.6 to +1 K - that is two orders of magnitude larger... -
Riduna at 14:30 PM on 21 October 2011Sea levels will continue to rise for 500 years
One should question the utility and verity of a model which ignores “what is happening with the climate, but … focuses exclusively on sea levels. Others have noted the obvious, that one can not purport to model future trends in SLR, be they in respect of 100 or 500 years without taking into account those factors most responsible for it, namely the rate at which land based ice is expected to melt and the causes for that melting. It is overly simplistic to assume that anthropogenic emission of greenhouse gases will be either the sole or even the major cause of ice melting over the next 100 years. Nor can one ignore the unprecedented warming of the Arctic and Southern Oceans and the effects this is having. It is a strange model which apparently ignores the potential for rapid increase in and massive loss of polar ice. Hansen and Sato 2011 hold the view that loss of this ice will double each decade this century, that in consequence SLR this century will be non-linear and, starting from a low base, will continue rising relatively slowly in the first half of this century but much more rapidly and with disastrous consequences in the second half – particularly during the last decades of the century. Their conclusions are consistent with those of Shakhova et al 2010 who draw attention to the dangers posed by the melting of permafrost, particularly on the seabed of the Siberian Central Continental Shelf, producing massive release of methane. They note that this is now occurring and warn that emission of 3.5 gigatonnes of methane, about 0.1% of Siberian methane deposits, would be sufficient to cause abrupt climate change. Antarctica is already being affected by warm ocean currents causing near collapse of the PIG and Thwaites glaciers, draining almost 30% of the WAIS, with capacity to cause SLR of ~1.5 metres. These currents have the potential to cause break-up of WAIS and EAIS shelves, causing major increase in the rate of glacier discharge. These events are now occurring and will continue for the rest of this century. Loss of mass from the Greenland ice sheet is, as predicted by Hansen, more than decadaly doubling, accelerating and shows no signs of slowing. Nor could it, since the Arctic Ocean is warming so rapidly that it is predicted to be seasonally ice free within 20 years with consequential loss of albedo and increase in the rate of future warming. Given these considerations, I find it extraordinary that the model used by Aslak Grinsted should be regarded as of any reliability in predicting SLR over the next 50 years, let alone the next 500. In this regard it should be treated, as is the IPCC 4AR, as very conservative because it largely ignores the causes and reality of polar ice loss – in other words, what is already happening. -
guinganbresil at 14:27 PM on 21 October 2011How Increasing Carbon Dioxide Heats The Ocean
Sphaerica - "The rate of flow of heat out of the ocean is determined by the temperature gradient in the 'cool skin layer'" [ - semantics/word-gaming snipped -] "Under cloudy conditions, the cloud cover radiates more heat back down toward the ocean surface than happens under clear sky conditions." Yes, so the heat loss from the surface goes down, and the temperature difference of the 'cool layer' goes down per Eq. (5) I notice that data from Minnett et al 2001, Figure 12 shows that under low wind conditions (during the day), the cool layer vanishes and becomes warm due to solar heating. So I should amend my previous statement - the long wave emission supports the cool skin layer at a dead calm, with clear skies, at night. -
scaddenp at 13:56 PM on 21 October 2011Sea levels will continue to rise for 500 years
Careful with those maps. Something above the sealevel might look okay but if it is on soft sediment, then it can still succumb to coastal erosion. Deltas, dunes, and dune barriers over former estuaries would be examples. Sealevel rise that effect longshore sediment transport can cause a switch in coastal processes from prograding to aggrading. If you already have issues with coastal erosion, then expect it to get a lot worse in next 100 years. -
Stevo at 13:49 PM on 21 October 2011Sea levels will continue to rise for 500 years
adelady, sorry, I was wearing my ironic/sarcastic hat when I wrote about ending up on the beachfront. In the case of Brisbane we are already at the stage where we are running out of land into which to accommodate our expanding population. I cannot see any action saving the homelands of many Pacific atoll dwellers and delivery of practical aid to these people is happenning way too slowly. Inevitably this will lead to displacement of these populations. How effectively do we expect we will prepare for and cope with SLR changes to our major cities, let alone the myriad other challenges posed by a changing climate when so far we have failed to supply enough sand bags to Kirrabati, and the "it isn't happenning" strain of denialism is still flourishing in this country? -
adelady at 13:37 PM on 21 October 2011Sea levels will continue to rise for 500 years
Stevo "... ending up on the beachfront.." The really disastrous Oz lifestyle consequence is that all that lovely sandy beach will disappear under the waters. It won't re-form on any historical time-scale. And, let's be honest, the geological time-scales needed to reestablish such landscape features are not terribly relevant to us or our several generations of descendants. -
Stevo at 13:26 PM on 21 October 2011Sea levels will continue to rise for 500 years
After looking at the map of Brisbane which DB provided I take no joy in the prospect of my home eventually ending up on the beachfront, while the airport, seaport and the business/industrial area in which I work becomming seabed in moreton Bay. I'm sure those displaced by such SLR will be consoled by the fact that they are only a minority. Before we even think of our own home towns I'm more concerned for the people in Tuvalu and Kirrabati. They are feeling the effects of SLR now. -
muoncounter at 13:19 PM on 21 October 2011Sea levels will continue to rise for 500 years
DB: "savvy investors should avoid Edam cheese futures..." Actually, the Dutch are probably better off than most. Due to climate change and relative sea-level rise, the dikes will eventually have to be made higher and wider. ... Currently, reinforcement of the dike revetments ... is underway. The revetments have proven to be insufficient and need to be replaced. This work started in 1996 and should be finished in 2015. In that period the Ministry of Public Works and Water Management in cooperation with the waterboards will have reinforced over 400 km of dikes. Imagine that ... a government that can do something -- with popular support. Guess it really does take a crisis to solve a problem. -
guinganbresil at 13:17 PM on 21 October 2011How Increasing Carbon Dioxide Heats The Ocean
Sphaerica - "Our discussion is based on a recognition that except for very light winds (perhaps less than 2 m/s) the Richardson number for the upper meter of the ocean is very small. As in the atmosphere immediately above the surface, heat transfer is forced or passive rather than free." The discussion that follows for the next two pages discusses the interaction of wind with the surface... forced heat transfer. On the bottom of page 271, Saunders discusses free convective loss case: "In a dead calm, when the Richardson number is very large..." At the top of page 272, he states: "If we suppose that the long-wave radiation to clear skies is the major agency for heat exchange between the ocean and the atmosphere... then the temperature difference derived from Eq.(4) is about 0.5C" So, free heat transfer vs. forced heat transfer. In one case, wind and humidity - the other dead calm and clear skies. -
Daniel Bailey at 12:55 PM on 21 October 2011Sea levels will continue to rise for 500 years
@ Michael Hauber above: "For instance I live in Brisbane, and I've looked at google maps of sea level rise to see what will be lost. At say 2 metres it is only a minority of the city that is lost." Tell that to those who live in the "minority" of Brisbane who get to experience that 2 meter SLR up close and personal: "A look at Sydney shows that the city will cope significantly better"
Looking at the same effects of 2 meters SLR one surmises the denizens of Sydney to be descendents of Prince Namor, the Sub-Mariner:
"A look at Sydney shows that the city will cope significantly better"
Looking at the same effects of 2 meters SLR one surmises the denizens of Sydney to be descendents of Prince Namor, the Sub-Mariner:
 But then, Australia is but a small place compared with the world as a whole. Expanding our viewpoint beyond the parochial pale (and ignoring the easy, low-hanging fruit of the Maldives or Bangladesh [and since Miami is so "been-there, done-that"]), a quick trip to the other side of the orb brings us to the Old Country, Europe:
 Meseems like savvy investors should avoid Edam cheese futures...
[Maps courtesy of the visualization tools from the Department of Geosciences, University of Arizona]
Meseems like savvy investors should avoid Edam cheese futures...
[Maps courtesy of the visualization tools from the Department of Geosciences, University of Arizona]
-
Dave123 at 12:49 PM on 21 October 2011Arctic Ice Volume is diminishing even more rapidly than Area
Sphaerica, I know it recovers. I was simply making a point about possibly needing better phrasing here. -
Michael Hauber at 12:01 PM on 21 October 2011Sea levels will continue to rise for 500 years
Paul D at #33 You state that most of the world's population is based in coastal cities. But just because a city is coastal does not mean that the entire city will be submerged, unless we are talking entire loss of Antarctica and 50 metre type sea level rises. For instance I live in Brisbane, and I've looked at google maps of sea level rise to see what will be lost. At say 2 metres it is only a minority of the city that is lost. Once you get past something like 10 metres much of the densely populated northern corridor is lost, and the CBD is under serious threat, but much of the densely populated western and southern corridors is still fine. It would take well over 2 metres, and something of the order of 10 metres before 'most' of Brisbane is lost. A look at Sydney shows that the city will cope significantly better, and a look at Melbourne looks similar to Brisbane, except the CBD and inner city will be threatened at only about 2-4 metres. On this small sample of cities, it seems quite unlikely that most (i.e. > 50%) of the population in these cities will be impacted within 100 years. And Australia is a very coastal nation, with a dry and arid interior, and a love affair with the beach. It will only ever be a minority of the population that will be required to pack up and move within any reasonable timeframe of say a century or two. And for nearly all of these cases there will be suburbs in the same city that are 50 or so metres above sea level. There will be a small minority of cities in the world that may require a more complete abandonment/relocation. And within such a timeframe the majority of the population will pack up and move somewhere else, often to a totally different city, and do so multiple times, simply because they are bored with where they currently live, or they have changing family or employment circumstances etc. And a quite a large number of the buildings they live in will be bulldozed because they are old and tacky and we'd rather build something shiny and new than maintain the old. Can anyone give a reasonable argument that the amount of dislocation and reconstruction that we will be forced to perform due to sea level rise will ever be comparable to the dislcoation and reconstruction that we perform simply due to convenience? -
Bob Lacatena at 11:40 AM on 21 October 2011Arctic Ice Volume is diminishing even more rapidly than Area
Dave123, Arctic ice recovers each year. The loss is not cumulative. -
DSL at 10:32 AM on 21 October 2011Continued Lower Atmosphere Warming
Bob, I second muon -- take it over to WUWT under a different name, and I guarantee it'll be trumpeted in the US Congress in three days. Curry will undoubtedly give it another "wow". -
Philippe Chantreau at 10:27 AM on 21 October 2011Arctic Ice Volume is diminishing even more rapidly than Area
A wealth of science papers contained in this post. Thank you, that is what SkS is really about. -
Dave123 at 09:26 AM on 21 October 2011Arctic Ice Volume is diminishing even more rapidly than Area
Do you really mean this:annual average ice mass loss is greater than 40% over a 30 year period
that means the present mass is M2011=(M0*0.6)30 Which is a vanishingly small number -
John Hartz at 09:14 AM on 21 October 2011Arctic Ice Volume is diminishing even more rapidly than Area
Excellent post. Thank you. -
ClimateWatcher at 08:39 AM on 21 October 2011Arctic Ice Volume is diminishing even more rapidly than Area
These animations demonstrate nicely the dynamic loss of sea ice, particularly MYI from Arctic to Atlantic. -
Bob Loblaw at 08:07 AM on 21 October 2011Continued Lower Atmosphere Warming
re: dana @131 If you take it as an hypothetical, then it seems harmless. But why would he choose that as his hypothetical? Whenever I read that comment of Dr. Pielke's, I keep tripping over the phrase "but it [is] certainly not "noise" as long as the measurements are robust". What does he mean by "robust"? [Typing in my best Church Lady voice] Could it be -Satanstatistical significance? Going back to the observations/interpretations/conclusions distinction, "robust" is a conclusion. How does he know it is robust? Dr. Pielke keeps presenting interpretation as if it is a conclusion. [Note: apologies if anyone is offended by the reference toSatan- no reference to anyone in this discussion is intended. if you're not familiar with Saturday Night Live of years ago, the quote may not make sense.]Response:[DB] Maybe this will remind them.
-
Rob Painting at 05:56 AM on 21 October 2011How Increasing Carbon Dioxide Heats The Ocean
Guiganbresil - clearly wind and solar radiation are important factors over short timescales, that much is discussed in the literature cited. But think about it, how would they alone cause long-term warming? How did the oceans get much warmer than they are now during the Paleocene-Eocene Thermal Maximum (PETM) 55 millions years ago, when radiation from the sun was weaker than it is now? Readily explained by the higher levels of greenhouse gases (in the PETM) altering the gradient in the cool skin layer. -
dana1981 at 04:33 AM on 21 October 2011Continued Lower Atmosphere Warming
Dr. Pielke continues to confuse me, saying @88"If, for example, there are no more Joules in the climate system after one year, the heating (in terms of an annual average) there is no accumulation of heat that time period"
However, Dr. Pielke has also admitted that he was wrong to say 'no Joules' had accumulated in the climate system, and even when looking exclusively at the upper 700 meters of OHC. So why give an example of something which has not happened? It seems like Dr. Pielke is simultaneously arguing that global warming has and has not stopped. The latter argument is the correct one. -
Albatross at 04:17 AM on 21 October 2011Continued Lower Atmosphere Warming
All I can say Sphaerica is: "Wow! This could revolutionize AGW science". That reminds me, whatever happened to Salby's "paper" that Judith Curry was fawning over? PS: You make an excellent point with that graph @ 125 though, well done. -
Bob Lacatena at 04:13 AM on 21 October 2011Continued Lower Atmosphere Warming
127, Dikran, 128, muoncounter, I don't make the numbers up, I merely bend them to my will. To paraphrase Humpty Dumpty:`And only one for birthday presents, you know. There’s
glory57 for you!’ ‘I don’t know what you mean by “glory57”,’ Alice said. Humpty Dumpty smiled contemptuously. ‘Of course you don’t — till I tell you. I meant “there’s a nice knock-down argument for youthe globe is not warming!”’ ‘But “glory57” doesn’t mean “a nice knock-down argumentthe globe is not warming”,’ Alice objected. ‘When I use awordnumber,’ Humpty Dumpty said, in rather a scornful tone, ‘it means just what I choose it to mean — neither more nor less.’ ‘The question is,’ said Alice, ‘whether you can makewordsnumbers mean so many different things.’ ‘The question is,’ said Humpty Dumpty, ‘which is to be master — that’s all.’ -
muoncounter at 04:07 AM on 21 October 2011Continued Lower Atmosphere Warming
Sphaerica: How long before your graph starts showing up in the usual places with the headline 'the new SkS temperature reconstruction shows no warming'? -
Bob Lacatena at 03:21 AM on 21 October 2011Sea levels will continue to rise for 500 years
43, MA Rodger, Because I was lazy. Here's your graph inline: (Oh, and thanks!)
-
Dikran Marsupial at 03:18 AM on 21 October 2011Continued Lower Atmosphere Warming
Sphaerica you are a very naughty person indeed! ;o) "If you torture the data enough, nature will always confess." Ronald Coase (quoted from Coase, R. H. 1982. How should economists chose? American Enterprise Institute, Washington, D. C.) -
Bob Lacatena at 03:14 AM on 21 October 2011Continued Lower Atmosphere Warming
[In case anyone missed the perhaps too subtle point, if you hand pick a short enough time series and the exact right data set(s), you can make the data say anything.] -
Bob Lacatena at 03:06 AM on 21 October 2011Continued Lower Atmosphere Warming
I think everyone should recognize the rather startling conclusion that I have discovered... there has been no appreciable warming whatsoever since 1980. None. In fact, the globe seems to have cooled by about 0.1˚C. To recognize this, since we all know that any one particular data set is subject to assumptions and errors, I have instead used all four major global mean temperature sources: HADCRUT, GISTEMP, UAH and RSS. I have used a different data set for a different time period (selected based on an arcane and intricate use of my eyecrometer that I don't have the space to go into here... I will discuss it in my soon to be published peer-reviewed paper, as well as the ever so informative and accurate press release that will announce its publication). Since the data sets do not share the same baseline, at the breaks I have "homogenized" the data by lining up the start of each new series with the old one. The result is rather startling. As I said. No warming at all since 1980! In fact, I see clear cooling! How can anyone argue with this? (Wow! Being skeptical is easy.)
-
Composer99 at 02:58 AM on 21 October 2011Sea levels will continue to rise for 500 years
MA Rodger: I was asking FundME to provide a link to his quote from the Dutch Environment Assessment Agency, not inquiring about any graph(s). My apologies if my comment was capable of being misinterpreted in that light. -
MA Rodger at 02:44 AM on 21 October 2011Sea levels will continue to rise for 500 years
Composer99 @39 I'm not sure why #40 & #41 cannot give a more useful looking graph. A link to such a graph (of my own authorship) is here (hoping it works). Graph of sea level rise & IPCC prediction ranges 1880-2100 -
SRJ at 02:42 AM on 21 October 2011Sea levels will continue to rise for 500 years
# 40 Paul from VA Taminos graph shows the trend rate as function of starting year, so you are actually comparing trend rates over periods of different lengths. That may be fine if you want to investigate how many years of data ou need to establish a significant trend (as Tamino does in the post "How long"). If one wants to demonstrate that the trend rate is increasing I think it would be better to calculate trends over e.g. a period for 30 years all for all 30 years period in the data and then plot these to se how they change over time. -
Bob Lacatena at 01:35 AM on 21 October 2011How Increasing Carbon Dioxide Heats The Ocean
24, guinganbresil, I do not see anything in the provided paper that supports your statement that "long wave radiation loss is a significant factor only in a dead calm, with clear skies." I think you are misreading the paper. Can you quote the passages which you believe lead to that interpretation? Also, please note that your supplied paper discusses the ocean-air interface in the top centimeters of the ocean only. Even if your interpretation were correct, it would only relate to how energy is exchanged between the ocean surface and the atmosphere. It would in no way change any statements or conclusions drawn in the post above:- The rate of flow of heat out of the ocean is determined by the temperature gradient in the 'cool skin layer'
- Despite being only 0.1 to 1mm thick, on average, this skin layer is the major player in the long-term warming of the oceans.
- The same concept applies to the cool skin layer - warm the top of the layer and the gradient across it decreases, therefore reducing heat flowing out of the ocean.
- Under cloudy conditions, the cloud cover radiates more heat back down toward the ocean surface than happens under clear sky conditions.
- The effect of greenhouse gases on ocean heat isn't confined to daylight hours however, they toil away around the clock.
- Given the atmospheric lifetime of carbon dioxide is many hundreds to thousands of years, we can now understand that long-lived greenhouses will also continue to exert a warming influence on the worlds oceans for a very long time.
- Because of their effect on lowering the temperature gradient of the cool skin layer, increased levels of greenhouse gases lead to more heat being stored in the oceans over the long-term.
- This ocean warming mechanism has been observed experimentally, and is also supported by numerical modeling.
- So although greenhouse gases, such as carbon dioxide, don't directly warm the oceans by channeling heat down into the oceans, they still do indeed heat the oceans, and are likely to do so for a very long time.
-
Bob Lacatena at 01:15 AM on 21 October 2011Sea levels will continue to rise for 500 years
38, Sasquatch, As I explained in comment 27 you are not going to "see" the real acceleration at this point in time (except for the abrupt seemingly linear acceleration at the advent of warming around 1979). We are in that early part of the curve where it looks flat. It is going to accelerate. We know it is because we are thinking human beings and we can put together 2 + 2. Here is the part of the curve we can see now, representing just the first 3 decades of global warming: If we zoom out a bit, here is the part we have to wait to see, the next couple hundred years:

-
Paul from VA at 00:56 AM on 21 October 2011Sea levels will continue to rise for 500 years
@38 Sasquatch, Tamino did some of his usual statistical excellence and showed strong evidence for accelerating sea level rise using tide gauge data going as far back as 1880.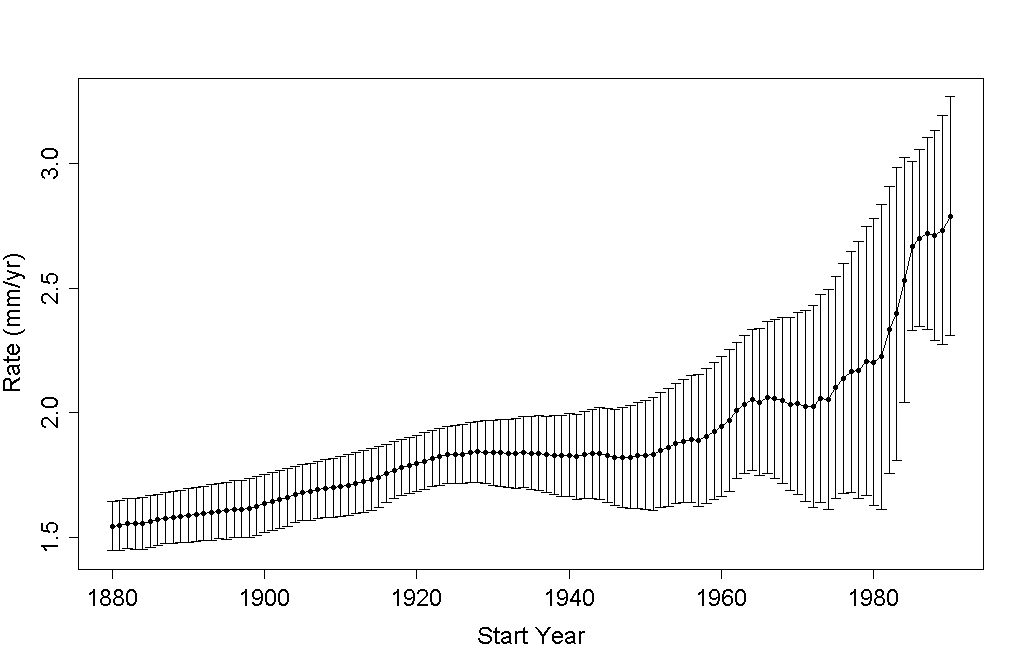
-
Composer99 at 00:51 AM on 21 October 2011Sea levels will continue to rise for 500 years
FundME: Do you have a link to the pertinent document? -
Sasquatch at 00:22 AM on 21 October 2011Sea levels will continue to rise for 500 years
Is there a way to look at this information further back? I am interested in seeing the acceleration referenced.
-
guinganbresil at 00:18 AM on 21 October 2011How Increasing Carbon Dioxide Heats The Ocean
From what I read from Saunders, Peter M., 1967: The Temperature at the Ocean-Air Interface. J. Atmos. Sci., 24, 269–273, the long wave radiation loss is a significant factor only in a dead calm, with clear skies - otherwise wind and insolation are the dominant factors... Ever been to sea? -
FundME at 00:10 AM on 21 October 2011Sea levels will continue to rise for 500 years
What is realy amazing is the level of complacency shown by the Dutch. One would think that living in a country of which 25% is below sea level at the moment they would be a little more afraid of future sea level rise. This from their Environment Assessment Agency. ""For the Netherlands, being a country with one of the most densely populated deltas, one of the threats of climate change is sea level rise. This report reveals that the Netherlands will be able to cope with sea level rise, for many centuries to come, even in a worst-case scenario of 1.5 metres sea level rise per century."" Quite amazing realy. -
Glenn Tamblyn at 21:49 PM on 20 October 2011How Increasing Carbon Dioxide Heats The Ocean
victull @15 Sea ice is made up of the part that freezes and remelts in a year, and the longer lasting semi-permanent ice. By definition the annual ice cycle can't contribute to the heat balance on longer timesacles. In contrast the decline of older ice is taking up heat that would end up in some other part of the system, probably the ocean. However the slow circulation time of the oceans would mean that a change in this thermal distribution is more likely to be limited to the oceans in the vicinity of the ice rather than the entire planet. The other factor, probably larger than the energy involved in melting the ice, is the effect that the ice melt has on Albedo - how much sunlight gets reflected by the Earth rather than absorbed. Ice reflects 80-90% of sunlight depending on how dirty it is. In contrast water absorbs about 90% of sunlight. So a major factor is the change in total heat absorption by the environment due to net ice melt exposing open water. This is probably more significant than the actual amount of heat needed to melt the ice. -
Glenn Tamblyn at 21:41 PM on 20 October 2011Sea levels will continue to rise for 500 years
Michael Hauber, Rob Painting, Paul D "Rising sea levels in the coming centuries is perhaps one of the most catastrophic consequences of rising temperatures.", "What I am scared of is eco system disruption. ", "Or agriculture disruption. " What I am truly terrified by is 'The Sum of All Off It' It is easy to get into trying to compare the relative awfulness of each aspect. But it is the sum of all of them that matters, and particularly the way the differing threats intersect to produce compound threats. The external challenges are bad enough. But when we try to factor in how these external pressures impact on the internals - social cohesion, ongoing education levels, psychological pressures, civil disorder, war etc we start to move into really frightening territory. How they can degrade our capacity to respond to the externals, leaving us far less powerful to act than we think we are. -
Micawber at 21:23 PM on 20 October 2011How Increasing Carbon Dioxide Heats The Ocean
Bob Laidlaw @21 Thanks for the very helpful comments especially on evaporation. I am interested in heat and salinity partly because of its influence on CO2 absorption. It is sensitive to alkalinity and temperature. It therefore has a bearing on ocean acidification processes I believe. -
Dikran Marsupial at 21:19 PM on 20 October 2011Continued Lower Atmosphere Warming
Eric (skeptic) The noise is the natural variability, the unforced response of the climate. The signal is the forced response of the climate. At least that is the case if you are interested in looking at the response of the climate to a change in the forcings. However, if you are pursuing a strictly statistical approach, then the assumption is that the data can be resaonably modelled as a linear trend with additive autocorrelated noise (Tamino suggests an ARMA(1,1) noise model is appropriate). So statistically the estimate of the noise is the residuals of trend. If we actually could specify what was noise we would know the signal with no uncertainty. The problem is that we can't, so a statistical model is used. If it were always easy to decide what kind of model we should use, or which vraiables we need to control for or subtract of prior to analysis, there would be no need for statisticians (who spend several years of their life learning the basics). Perhaps it would be better if you were to state the hypothesis you want to test and state the dataset you intend to use and the time-period over which you want to perform the analysis, and perhaps it would be easier to provide some more concrete advice. -
Eric (skeptic) at 20:37 PM on 20 October 2011Continued Lower Atmosphere Warming
Skywatcher, I agree, just need to define noise in your hypothesis: all forcings and natural variation other than GHG forcing. Muoncounter, the concept is simple but not quantifying the statistical significance of various combinations of X and Y in your picture. A negative trend in Y of roughly 2 or less for an X of less than 4 or so doesn't seem significant. A flat trend in Y for an X of 30 may not be significant (has the low sample size caveat). -
Rob Painting at 20:01 PM on 20 October 2011Sea levels will continue to rise for 500 years
Michael Hauber - I find your sea level scenario wholly unrealistic. Paul D has only touched on a tiny portion of the logistical problems involved. As for CO2 fertilization - that's turned out to be a fizzer so far. The latest global forest inventory finds little evidence for it, and a recent peer-reviewed paper finds none. -
adelady at 19:53 PM on 20 October 2011Sea levels will continue to rise for 500 years
Paul D I think the other issue is about the rising level of water itself. Long before many cities or suburbs are under water, all the buffers will be gone. Admittedly, many cities and agricultural areas have already "reclaimed" low-lying marshes, wetlands and mangroves. Here in Adelaide there was once an area called 'Reedbeds', no need to wonder why it was called that. Nowadays, residents of suburbs beside the waterway called a river (it's really a seasonal creek) complain bitterly about occasional flooding. But more generally, mangroves and marshes as well as beaches serve as a buffer for high tides and storms. These very low lying areas will be the first to go under the merest advance of rising waters. And the adjacent landward areas will then be exposed to the full force of storms and tides. All buffering will be gone. I know it's true of this city and many others, I just don't know how many others, but on flat land near the sea we have the airport and the sewage processing plant, the major power generator is on an island - as well as the port and its associated train lines and road transport infrastructure. Urbanising agricultural land is one thing. Commandeering land for airports and other major infrastructure will put those problems in the shade. -
Paul D at 18:54 PM on 20 October 2011Sea levels will continue to rise for 500 years
Michael Hauber@23 I think your dismissal of sea level rises as a major issue is somewhat disturbing. The biggest issue is the fact that most of the Earth's population is based in coastal cities. Indeed, the most prosperous cities are located on coastal regions. It has taken a huge amount of effort and carbon emissions to build them. Meanwhile the surrounding rural areas are crucial for agriculture. Cut away even a small distance inland and the result is a massive migration of the most economically active people on the planet onto land that is already under strain trying to produce enough food. Firstly the abandoned cities would need to be sanitised before sea waters were allowed to engulf the cities, this would have to be done in parallel with moving people and building a new city inland. On top of that, you would have resistance from rural dwellers who would be against their land being urbanised. Meanwhile you would get sea water causing problems inland as it pushes up along rivers and 'polluting' farmland. Land erosion would increase making it dangerous for any stability in building communities near some coastal areas. -
jimspy at 18:15 PM on 20 October 2011Sea levels will continue to rise for 500 years
I think the biggest take-away for me, as a complete layman, is that the difference between the red line and the green line in that graph could be the difference between losing Tuvalu and losing Miami.Response:[DB] At one meter of SLR, Miami is effectively an island, impossible to defend from storm surges and vulnerable on the whole "back side"; much infrastructure will be inundated.
At 2 meters, even more so. Anything more and all of South Florida will be under the waves, not just Miami (click for larger image):

More details for other areas can be found here.
-
Glenn Tamblyn at 16:07 PM on 20 October 2011Sea levels will continue to rise for 500 years
Adelady Yep, that is what is expected to happen - hence more flooding, more uneven supply of water for agriculture. And a greater need for even more dams. Dams serve 2 purposes. They store water so if you are loosing a storage system supplied by Nature you need more man-made storage. In addition, dams perform a vital role in flood prevention. If Mother Nature isn't providing that service for us we need extra dams for that role as well. And that extra water increasing sea level - yep again. To date Glacial melt has added more to sea level rise than Greenland/Antarctica. In decades/centuries to come the 'big boys' will take on a larger role. But not so much yet. -
Glenn Tamblyn at 16:00 PM on 20 October 2011Sea levels will continue to rise for 500 years
PirateAt50. This post is about what long term sea level will be. One way of looking at this is to ask what has happened in the past. During the previous Inter-Glacial, the Eemian around 150,000 years ago surface temps peaked at about 0.5 DegC warmer than now. But they didn't stay that high for long, perhaps only 1-2 thousand years. In contrast since the peak of this current inter-glacial, although not as warm as the Eemian, they have stayed high for 10,000 years or so before we started elevating them recently. During the Eemian around 1/2 the Greenland Ice Sheet went and sea levels rose enough to flood Denmark and turn Scandinavia into an island - The Baltic joined up with the White Sea to form what has been named the Eemian Sea Many people seem to fixate on the models and computer predictions of Climate change as if they are the only evidence. I sometimes get a sense that they treat the idea of AGW with incredulousness, as if it is an outlandish proposition that has appeared out of left-field that only really originates in some 'models' Yet the best evidence for Climate Change is that it has happened before.Response:[DB] This is what it may have looked like:

(yet another fine graphic from jg)
-
John Hartz at 15:39 PM on 20 October 2011Sea levels will continue to rise for 500 years
“In another sense, though, the IPCC was acting too conservatively, giving an overly rosy picture of the rising oceans. In the years since the 2007 report, researchers have learned more about the dynamics of ice sheets and are converging on the view that we’re facing at least a one-meter rise by century’s end if emissions aren’t tamed.” Source: Climate scientists grapple with uncertainty (though not the kind you think), Era Klein’s Wonkblog, Washington Post, Oct 18, 2011 To access this article, click here
Prev 1435 1436 1437 1438 1439 1440 1441 1442 1443 1444 1445 1446 1447 1448 1449 1450 Next


