


 Arguments


Recent Comments
Prev 1437 1438 1439 1440 1441 1442 1443 1444 1445 1446 1447 1448 1449 1450 1451 1452 Next
Comments 72201 to 72250:
-
Dikran Marsupial at 06:38 AM on 18 October 2011Warming causes CO2 rise
meznaric, El Nino causes big changes in the terrestrial biosphere around the pacific, so it isn't surprising that ENSO affects CO2. However, the sneaky thing in that plot is that it shows that ENSO changes the rate of change of CO2, not the level of CO2. If you look at a plot of CO2 itself, from Mauna Loa, you see a big exponential increase (due to anthropogenic emissions), an annual oscillation caused by the growth and die back of terrestrial plants (becuase there is more land in the north hemisphere than the south), the variations in the rate of change in CO2 due to ENSO result in the even smaller inter-annual variations on top of that, which are barely perceptable.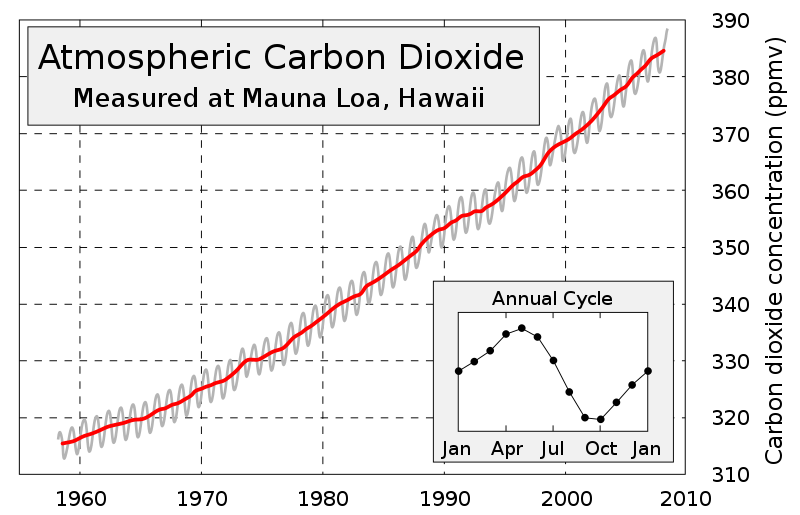 As the text explains, the differencing operation obliterates the linear trend in the data, which is essentially most of the increase due to anthropogenic emissions.
-
meznaric at 06:17 AM on 18 October 2011Warming causes CO2 rise
@Dikran, OK thanks for that. Having read much of this website, I am quite convinced that what you write is true. But what puzzles me is how do you explain the data in that graph (second from the top)? It's strange that even the El Nino would be in such good agreement. -
Dikran Marsupial at 06:04 AM on 18 October 2011Warming causes CO2 rise
meznaric If the natural environment were a net source of CO2 into the atmosphere, then atmospheric CO2 levels would be rising faster than the rate of anthropogenic emissions as both the natural environment and mankind were net sources. However this is not the case, atmospheric levels are only rising at a rate about half that of anthropogenic emissions, which shows that the natural environment is a net carbon sink and takes more carbon out of the atmosphere each year than it puts in. This is one of the relatively few things we know about the climate where we can be certain, beyond reasonable doubt. -
william5331 at 05:51 AM on 18 October 2011El Niño: Unaffected by climate change in the 21st century but its impacts may be more severe
What is the effect, if any, of both ends of the ENSO cycle on the melting of ice in the Arctic Ocean? -
CBDunkerson at 05:50 AM on 18 October 2011Warming causes CO2 rise
This Heidelberg stuff is the same silly argument that Beck used in disputing Callendar. When Callendar started collecting CO2 readings back in the 1930s and 40s he found alot which showed a slow consistent upward curve and then a bunch of outliers... all on the high side of the curve and all near major industrial centers. He reasoned that the outliers were due to local emissions which hadn't dispersed throughout the atmosphere yet. Beck argued that they were instead indicative of global changes (even though contradicted by other readings) and should be factored in to show atmospheric CO2 levels roller coasting up and down by huge margins. Of course, Keeling solved this problem in the late 1950s by taking readings at a location (Mana Loa) far removed from any local emissions... and getting results which proved that Callendar's steady curve conclusion was correct. This has subsequently been duplicated at dozens of other isolated sites around the world showing the same results. Arguing that higher readings in industrial areas are thus indicative of anything except the source of the increasing atmospheric CO2 levels is thus clearly specious. You might as well argue that temperature readings taken inside ovens should be factored into global trends... when the oven is off they display massive cooling! Clearly our global warming fears are misplaced! -
Albatross at 05:50 AM on 18 October 2011Comparing Global Temperature Predictions
KR @3, Indeed, comments policy "No accusations of deception". CharlieA has done this before and is doing it again now. The origin of the offset is clear if one actually invests the time to read the relevant post, something CharlieA has apparently not done. Lindzen has not gone the trouble to make his own projection/s. He loves to berate his colleagues and their efforts to predict what the future holds for a doubling of CO2, but he is either incapable or not willing to make his own predictions. So one has to make a best estimate based on what information Lindzen has volunteered in terms of climate sensitivity and expected temperature change. If one does that, one obtains very little warming for doubling CO2 because Lindzen believes (or has convinced himself) that climate sensitivity is unrealistically low. The huge problem for Lindzen (and his supporters) is that his own arguments have been contradicted by observations-- in fact, his bold proclamation made at MIT in 1989 was wrong the moment he said it. Now if Charlie A has a problem with what Dana did and wants to try and defend Lindzen's refuted claims, then he (and others) can argue that on the relevant thread (link provided by KR), but without suggesting deception. But CharlieA should note the bolded caveats provided by Dana. This post very nicely demonstrates who has had the better track record when making predictions about global temperatures, and it is not the "skeptics" and those in denial about AGW. -
Bob Lacatena at 05:10 AM on 18 October 2011Comparing Global Temperature Predictions
2, Charlie A, It would be great if so called skeptics would actually read and follow links for more detailed explanations (the relevant link is provided in the post above), rather than simply looking at the pretty pictures and jumping to unfounded conclusions (which seems to be pretty much how the skeptical mind consistently works on the subject of climate change -- it's oh so much easier to see what you want to see than to learn and consider the facts). Lindzen's proposal results in ridiculously inaccurate temperature predictions, even back to 1958, because that's how ridiculous his position is. A climate sensitivity as low as his requires that the climate be more stable than has been demonstrated in this entire century, let alone the last 30 years of AGW. -
Comparing Global Temperature Predictions
Charlie A - I would suggest looking at the Lindzen Illusion #2: Lindzen vs. Hansen - the Sleek Veneer of the 1980s, where dana1981 generated a prediction using Lindzen's numbers. Comments might be more appropriate there, with a link in this thread if desired. I will note that (IMO) your comments seem out of line, in that you appear to be accusing dana1981 of fudging the data to make Lindzen look bad. -
Charlie A at 04:38 AM on 18 October 2011Comparing Global Temperature Predictions
Dana, you could make your hypothetical version of Lindzen's predictions look even worse if you moved them down another arbitrary 0.25C or so. Or you could use the same baseline adjustment method you used for the other lines, in which case is would be relatively close to the observed temperatures. It's really a moot point, though, since you are the one that generated the data you claim to be Lindzen's prediction.Response:[DB] Please note that posting comments here at SkS is a privilege, not a right. This privilege can and will be rescinded if the posting individual continues to treat adherence to the Comments Policy as optional, rather than the mandatory condition of participating in this online forum.
Moderating this site is a tiresome chore, particularly when commentators repeatedly submit offensive or off-topic posts. We really appreciate people's cooperation in abiding by the Comments Policy, which is largely responsible for the quality of this site.
Finally, please understand that moderation policies are not open for discussion. If you find yourself incapable of abiding by these common set of rules that everyone else observes, then a change of venues is in the offing.Please take the time to review the policy and ensure future comments are in full compliance with it. Thanks for your understanding and compliance in this matter.
-
meznaric at 04:35 AM on 18 October 2011Warming causes CO2 rise
@Ned I think what you need to show is that if his conclusion can be true in short term why can it not be true in long term. (I am not very skeptical about anthropogenic climate change, I just think it's a good debate to have from a scientific perspective.) -
WheelsOC at 03:10 AM on 18 October 2011Comparing Global Temperature Predictions
While I like the visibility of how wrong the "skeptic" predictions have been, it would be nice to see the mainstream model predictions start at the point from when they were published instead of how far back they reach in hindcast. So the first IPCC assessment's models should start at 1990, the second in 1996, etc. -
DanaHicks at 02:12 AM on 18 October 2011El Niño: Unaffected by climate change in the 21st century but its impacts may be more severe
I agree with the assessment. Despite some claims about changes in ENSO patterns, no increase in frequency or magnitude can be attributed to AGW at this point, and unlikely in the near future. Both El NIno and La Nina events will occur as before, but changes in local impacts are possible. Most observed changes in ENSO can be tied to changes in the PDO whereby alternating cycles of greater and more frequent El Ninos are followed by greater and more frequent La Ninas. -
Kevin C at 01:08 AM on 18 October 2011Ocean Heat Poised To Come Back And Haunt Us?
JosHag@1: 4 of the 5 oscillations might correlate with a lagged response to volcanic eruptions and Chinese emissions: 1963: Mt Agung 1982: El Chicon 1991: Pinatubo 2000s: Chinese aerosols from coal I'm not aware of a physical mechanism that could account for such a link, however. -
Bob Lacatena at 00:51 AM on 18 October 2011El Niño: Unaffected by climate change in the 21st century but its impacts may be more severe
1, Martin, My read is that they're saying that they aren't ruling out future changes to ENSO events at any time (10, 20, 50, 100 years or more). They are simply saying that ENSO does not appear to have changed/be changing as a result of climate change at this point in time (which is pretty early in the game). What they are also saying, however, is that in spite of the fact that ENSO events are not changing, the far reaching impacts of those events are accentuated/worsened by the other changes that are taking place in the climate. So while the frequency and intensity of ENSO events are the same, how those events are impacting places like Australia, North America and South America is greater (possible/probable example: the current Texas drought). -
victull at 00:33 AM on 18 October 2011Ocean Heat Poised To Come Back And Haunt Us?
Jsquared@25 The cooling 1965-1975 could be instrumental as the coverage was poor in that era. Does the sharp rise after 2001 coincide with the changeover to temperature measurements from Argo floats? -
Martin at 00:17 AM on 18 October 2011El Niño: Unaffected by climate change in the 21st century but its impacts may be more severe
I'm not quite sure whether I have understood this correctly. Are they saying that over the next 100 years the El Nino frequency and magnitude will remain about the same, but they don't rule out changes in the 22nd century? -
Rob Painting at 23:34 PM on 17 October 2011Ocean Heat Poised To Come Back And Haunt Us?
Jsquared - thanks for that. Regarding the earlier data - Church (2011) found they could only close the sea level budget from 1972 onwards, and they suggest this may stem from poor global coverage prior to then. So it may not be real. Here's some papers on ocean gyres, which may be of interest to you (a bit of detail on how the gyres are affected): Decadal Spinup of the South Pacific Subtropical Gyre - Roemmich (2007) Super spin in the southern seas FundME - No worries. -
muoncounter at 23:24 PM on 17 October 2011An exponential increase in CO2 will result in a linear increase in temperature
BernardJ#3: "20th century aerosol release" Nope, the curves are CO2 radiative forcing only, calculated from a best fit to CO2 as a function of time and applying the usual formula. -
FundME at 22:25 PM on 17 October 2011Ocean Heat Poised To Come Back And Haunt Us?
RobPainting Thanks, so a huge oceanic gyre transporting heat to the abyss, much like a drain. Now there is an easily stored image for my brain, a lot easier than a giant funnel with its attendant and complicated compression mechanics. "Big whirls have little whirls that feed on their velocity, And little whirls have lesser whirls And so on to viscosity" LF Richardson. -
Fran Barlow2 at 21:58 PM on 17 October 2011Correction to the True Cost of Coal Power - MMN11
I find the discussion on the social costs of coal power implausibly optimistic. It's really quite simple. We now know that any addition to atmospheric Co2 inventories opens the door to uncontrolled climate change -- a catastrophic risk to human civilisation in the future. At best, we are likely to suffer a roiling series of human induced disasters. In the best case we get +2DegC by 2100 over pre-industrial after stabilising at 450ppmv (improbable on current trajectories). After 2100, we stabilise at theat level or start to slowly see declines in temperature over perhaps 300 years. That is an unacceptable set of risks. So the question must focus on who to stabilise at perhaps 400ppmv as soon as possible -- so as to minimise passing tipping points (assuming as we must but can't that we haven't already passed them). What would be the cost of a complete Co2 stewardship program from mine head to smokestack? Could this be had for even $36tCo2e? Of course not or we'd have had this on the table by now. Coal industry folks are quoting $100tCo2e for this. Of course Co2 emissions also affect the marine enviornment. But if we are talking coal we must throw in not merely Co2 but NOx, and toxic/radioactive aerosols. We must throw in the human costs of harvest, in deaths at mines and in loss of quality life years from black lung disease. We must factor in the costs that will follow if, within 50 years, coal starts becoming sharply more expensive as ABARE has predicted. And of course it's not just about coal. It's also about oil. What are the costs of maintaining military forces in the gulf, for example? How much would a well-to-wheel stewardship program cost for oil? How much would it cost to ensure no more "Rena" disasters, such as in NZ right now. Again, I'm guessing it would be a lot more than $36tCo2e. Perhaps $250tCo2e would get the job done. Professor David Mackay in "withouthotair.com" quotes $100 just for Co2. I think that is light too, but IMO it is certainly a lot closer. -
Jsquared at 21:35 PM on 17 October 2011Ocean Heat Poised To Come Back And Haunt Us?
Re #25 I should have said that the four curves are northern hemisphere, 0-700m (NH700), northern hemisphere, 0-2000m, (NH2000), and same for the southern hemisphere. The data are from ftp://ftp.nodc.noaa.gov/pub/data.nodc/woa/DATA_ANALYSIS/3M_HEAT_CONTENT/DATA/basin/yearly/ and are h22-w0-700m.dat and h22-w0-2000m.dat. -
Bernard J. at 21:27 PM on 17 October 2011An exponential increase in CO2 will result in a linear increase in temperature
The second plot in Muoncounter's post is the first time that I've actually seen the different sensitivities plotted against time, in the context of realised carbon emissions. It's interesting to consider that if the effect of 20th century aerosol release is as significant as some suggest, and if it is accounted for in the trajectory, then the actual climate sensitivity would seem to follow closely the path of a 3 degrees sensitivity that is usually given as the most likely response to a doubling of atmospheric carbon dioxide. -
Jsquared at 20:42 PM on 17 October 2011Ocean Heat Poised To Come Back And Haunt Us?
Re Rob Painting @ #14 Sorry this took so long - I needed to find a web host for the graphic. The heating of the deep ocean after 2001 or so is indeed mostly occurring in the southern ocean, as predicted by the models used by Meehl et al.
But the period from 1965-1975 or so is interesting: there's a net loss of heat in the northern ocean - almost monolithic with depth, if you believe the data, which is hard to understand if getting heat into or out of the deep ocean is supposed to take a lot of time. I wonder if it's instrumental rather than real?
The heating of the deep ocean after 2001 or so is indeed mostly occurring in the southern ocean, as predicted by the models used by Meehl et al.
But the period from 1965-1975 or so is interesting: there's a net loss of heat in the northern ocean - almost monolithic with depth, if you believe the data, which is hard to understand if getting heat into or out of the deep ocean is supposed to take a lot of time. I wonder if it's instrumental rather than real?
-
Eric (skeptic) at 10:34 AM on 17 October 2011Review of Rough Winds: Extreme Weather and Climate Change by James Powell
Norman, I think one of your posts was deleted, but here's a longer term look at corn yields in Iowa: http://holocene.meteo.psu.edu/shared/articles/MaloneetalAgForMet09.pdf Also I would distinguish the "terrible weather years" hypothesis from the trend in yield improvement The latter may have a lot of factors involved like fertilizers, harvesting methods, hybrid seeds, etc. Those are two different analyses. -
Philippe Chantreau at 10:31 AM on 17 October 2011Review of Rough Winds: Extreme Weather and Climate Change by James Powell
Every passing post shows Norman grasping at thinner and thinner straws with increasing desperation. I don't think I need to read more about this. -
Eric (skeptic) at 10:04 AM on 17 October 2011Continued Lower Atmosphere Warming
Climate models have two distinct uses that should not be confused, first they can predict the linear trend over long periods of time, and that can be done with a broad range of models including simple equilibrium models. Or, they can, as Santer showed, include a more comprehensive set of natural cycles to show the variances in the temperature trend over time. One result of the second use of models is a definitive statement about the length of real world time required to show a change in trend. Ger pointed out that the trend changes may depend on factors that are not in the model (but I would also point out that many models add volcanoes) and those factors may or may not change the statistics of temperature trend variances. An alternative to the modeling is, as I pointed out above, looking at a long time sample of temperature measurements to determine the variances of the temperature trend. This sort of analysis has been commonplace for many years, e.g. http://acacia.ucar.edu/cas/jhurrell/Docs/climchange.decvari.pdf It is not difficult for climate models to simulate the variances created by these decadal natural cycles, nor is it that difficult to add typical exogenous events like volcanoes, nor is the chaotic nature of weather a problem for deriving the statistics. Either climate models or long running temperature series can produce the required statistics to determine the period and amplitude of natural factors superimposed on the AGW trend. However, one or the other is necessary to determine the variances in the trend. The answer to the question of period of time for change in trend to be significant (i.e. 13, 17, 20 years) must come from the consideration of the periods of time of natural cycles be they modeled in GCMs or derived from long running temperature measurements. -
SRJ at 09:44 AM on 17 October 2011Antarctica is too cold to lose ice
Regarding my post #8 I am most interested in the first 2 points, I think that point 3 and 4 are well explained in Shepherd, Wingham and Rignot, 2002. Assumming my points 3 and 4 are correct my question then is if this is correct: 1) CO2 causes an increase in surface air temperature 2) From 1) an increase in ocean temperatures follow, specifially ocean currents at thee Western antarctic And points 3 and 4 as above -
skywatcher at 08:41 AM on 17 October 2011Review of Rough Winds: Extreme Weather and Climate Change by James Powell
And so the cherry picking goes on. Norman, take yourself over to the "Continued Lower Atmosphere warming" thread, where you'll see a whole series of graphs in which 1998 is a massive outlier, representing the highest or near-highest value, yet the trend, even when starting on that year, and most certainly in years prior to 1998 is up. According to your reasoning in #227, it should be down, as a trend can never be up when there is a large peak in the past. You avoid the conclusions of Peterson's exhaustive study by saying "Look at Oklahoma City", "Look at Nebraska". Well Peterson already did that, seeing as Oklahoma City and Nebraska are in the USA. The trends in extremes are up, the mechanism is clear. I would suggest that if all you can do is say "look at X, it didn't have recent extremes", then your argument is dead in the water and you should be ignored. -
Rob Painting at 08:17 AM on 17 October 2011Ocean Heat Poised To Come Back And Haunt Us?
Muon - like Roger Pielke Snr, I'd rather move on to more constructive discussions. -
Rob Painting at 08:12 AM on 17 October 2011Ocean Heat Poised To Come Back And Haunt Us?
John Bruno @ 20 - I've got a few posts lined up discussing ENSO, but note the post by John Hartz - El Niño: Unaffected by climate change in the 21st century but its impacts may be more severe. Because the background state is warming, the effects of ENSO can be more severe. I don't know of any studies suggesting ENSO will disappear, that's new to me, but I was aware of work indicating that we may end up with permanent El Nino (based on studies of the Pliocene). The prevailing view now, is that ENSO did in fact occur in the Pliocene, and may have even existed during the (much warmer) Eocene - so we expect it will continue into the future. Whether the intensity/frequency of ENSO itself will change, isn't yet clear. Something the study I linked to above (Stevenson 2011) affirms. As a coral reef scientist, such as yourself, those peaks in figure 2 are the periods that may give cause for concern - they suggest a dominant El Nino-like pattern in the warming decades. In other words they may be decades where there is a marked increase in coral bleaching events, as heat stored in deeper layers of the upper ocean (the top 500 mtrs) is brought to the surface. As for figures 1 & 2, they were prepared by another SkS member. -
dana1981 at 07:57 AM on 17 October 2011Correction to the True Cost of Coal Power - MMN11
AnotherBee @5 - that's the point of international climate negotiations, as in Kyoto and Copenhangen (the latter of which unfortunately failed). However, the EU has had a carbon cap and trade system in place since 2005. Australia is putting one in place, as is China by 2015. So at this point no nation can claim their carbon pricing scheme is purely unilateral. -
Rob Painting at 07:24 AM on 17 October 2011Ocean Heat Poised To Come Back And Haunt Us?
Karamanski @ 19 - See Trenberth (2002), a link to the full paper is provided in the post. -
scaddenp at 07:13 AM on 17 October 2011Continued Lower Atmosphere Warming
Ger, all we can say is that models so far are doing a very good job of predicting 30 year averages and trends which gives us some confidence that they are capturing the physics adequately. Who can predict if the next probe to Mars will go off-course because models so far have failed to capture some important aspect of gravity? If the facts change, then so will the science, but in planning for the future you have to work with best models of reality possible for the moment rather than depend on some wishful thinking that they are wrong. -
Michael at 07:12 AM on 17 October 2011Correction to the True Cost of Coal Power - MMN11
A) If one calculates the atmospheric life of an incremental ton of CO2 emissions on a First in First out Stock managment basis (CO2 now is only drawn down after the prior years airborne fraction e.g. form 1950) it is absolutely clear that each additional ton of CO2 emissions has an atmospheric life of many thousands of years....perhaps a hundred thousand years. B) Money is a medium of exchange for real goods e.g. wheat or land. C) So the financial discounting model is fatally flawed as it does not take into account the destruction of Earths ability to provide the real goods in exchange for money. It cannot be used for key environmental services as it implies impacts as severe as nuclear war on human population are economically Affordable. -
Ger at 07:10 AM on 17 October 2011Correction to the True Cost of Coal Power - MMN11
put the tax at the source of the fossils. It does relieve the renewables from the task of proving that their equipment and fuel used is really of the renewable kind. -
Paul D at 06:44 AM on 17 October 2011Correction to the True Cost of Coal Power - MMN11
Climate policy is not a left versus right issue. In mitigating climate change there is no guarantee that everyone will be equal, unequal or better off. If anything, in a truly low carbon world, poverty may well be inevitable for all, but then poverty is an emotive word designed to instil fear by the politically motivated. The biggest problem is that the continued war between left and right (especially in the US) is diverting attention away from re-writing economics and politics. There is a world outside the US. -
Ger at 06:40 AM on 17 October 2011Continued Lower Atmosphere Warming
I might have given the impression to talk on the workings of the model. Not intended in that sense. Pielke is refering to the models of which he doubts that all effects are taken into account to their proportion. The data-sets collected and checked did make him choose that time frame of a 13 years for his model and he was proven wrong by doing so: should be at least 17 years or more. Now with the doubts on the model set aside, is not the topic here, he gained another 4 years, lets move on. Not answering the statistical significant question indicates more or less the answer; it is not significant what he has found. But who can predict the dataset to come for the next 4 years to verify if the models are still correct? -
michael sweet at 06:34 AM on 17 October 2011Review of Rough Winds: Extreme Weather and Climate Change by James Powell
Norman: You accidently posted a two month old forecast. According the most recent forecast, Nebraska will not set a record, although they will have a good crop. The national forecast has also been lowered, due to heat and drought. Please try to give current information in the future. It only took me one Google to get current data, and I do not really care about Nebraska corn. -
michael sweet at 06:21 AM on 17 October 2011Review of Rough Winds: Extreme Weather and Climate Change by James Powell
Norman: it is terrific that Nebraska is doing so well. Unfortunately, according to your source!!! the rest of the country is not: "According to the USDA, corn production for 2011-12 is forecast 556 million bushels lower than previously expected, with a reduction in harvested area and lower expected yields. The national average yield is forecast at 153 bushels per acre, down 5.7 bushels from last month's projection, as unusually high temperatures and below-average precipitation during July across much of the Corn Belt sharply reduced yield prospects" (my emphasis). Perhaps we could all move to Nebraska. The price of corn, and meat, and ethanol, will go up this year due to crop losses caused by AGW. Nebraska will benefit htis year, what about next year? -
AnotherBee at 04:55 AM on 17 October 2011Correction to the True Cost of Coal Power - MMN11
@keithpickering At great risk of running off topic (from causes to remedies), the obvious immediate risk of your proposal is that applying such a tax unilaterally within one country would (be seen to) put products manufactured in that country at a disadvantage compared to those produced in a country without such a tax. For imports, one can imagine this being remedied by an import duty based on the ratio of fuel types consumed in the producing country. However exporters would still (be seen to) be at a disadvantage. What, in outline, would be your solution? -
paulchevin at 04:29 AM on 17 October 2011Models are unreliable
Thanks for the further links, DB. I've now located a paper which discusses the discrepancy in time-averaged global mean temperatures between the different GCM's: An Overview of Results from the Coupled Model Intercomparison Project (CMIP) The paper states: "Both flux-adjusted and non-flux-adjusted models produce a surprising variety of time-averaged global mean temperatures, from less than 12°C to over 16°C. Perhaps this quantity has not been the subject of as much attention as it deserves in model development and evaluation." However, given that we're dealing with energy flux here, the appropriate unit is surely the Kelvin. In this context, all of the models get within 2K of the actual global mean, which appears to be around 287K - that's within 0.7%!! I'd say that's pretty remarkable given all the various features which are incorporated into the models. Indeed, if they model the response to greenhouse gases anything like that well I'm sure the scientists will be delighted! Paul -
Anne-Marie Blackburn at 04:29 AM on 17 October 2011Review of Rough Winds: Extreme Weather and Climate Change by James Powell
Norman You are constantly cherry-picking areas you claim have seen no changes. But what about those places that have already seen changes in extreme event frequency and/or intensity? How do you explain those? And how do you explain that rising temperatures and water vapour levels have no impact on extreme weather? The US Global Change Research Program's report on National Climate Change highlights some of the changes that have already happened. How do you explain these without taking into account climate change? What mechanisms are responsible? How are the effects of rising temperatures and water vapour levels, and changing atmospheric circulation, for example, nullified? -
Bob Lacatena at 04:24 AM on 17 October 2011Review of Rough Winds: Extreme Weather and Climate Change by James Powell
228, Norman, Thank you for being the poster child for denial"...but in Nebraska there is no evidence..."
Everyone can relax because in your opinion Nebraska looks fine. -
Norman at 04:10 AM on 17 October 2011Review of Rough Winds: Extreme Weather and Climate Change by James Powell
muoncounter @222 You have suggested looking farther then out ones own window to get a sense if the climate is changing for the worse, but in Nebraska there is no evidence of this taking place. I do have good memory of several extreme weather events that have taken place in my local area and there is no evidence of an increasing number. Last 10 years of Corn Harvests in Nebraska have been very good. And 2011 looks just as good or better. Record Corn harvest expected for Nebraska in 2011. -
muoncounter at 03:58 AM on 17 October 2011Ocean Heat Poised To Come Back And Haunt Us?
RobP#18: "Except for a great many skeptics you mean" Please take both parts of my sentence as a whole: 'Skeptics' blindly make such claims because of their gross oversimplifications. "Statistical significance is a whole lot less intuitive to a public audience, ... " The discussion just concluded was very clear on this issue, both in Dana's introduction and subsequent comments.it's entirely possible that over such a short timeframe, short-term noise such as ENSO and solar cycles may have masked the continuing long-term global warming trend."
Quoting resident statistical significance guru Dikran M,
if you want to suggest there is any scientific interest in this hypothesis, then you need to show that the hypothesis test has meaningful power. So my question is, what is the statistical power of the test?
Conclusions drawn from short periods should be treated very carefully; that's neither complicated nor anti-intuitive. " ... than is examining why we have these hiatus periods." Here is Tom Curtis the last time this came up:
there has been ongoing global warming in the period 2001-1010 at a rate similar to the preceding two decades; There may have been a slight reduction in the rate of warming in the last three years due primarily to an unusually for the 2000's cold year in 2008, although an unusually warm year for any other decade of the instrumental record;
That post dealt with the 'hiatus' via Kaufmann et al 2011, in terms of the slight changes in radiative forcing. Quoting,
the cooling effect of sulfates nearly cancels out the warming effect of greenhouse gases, allowing natural processes to control the climate.... the small drop in sunlight reaching the Earth as part of the natural solar cycle, ... leads to a much smaller push in the direction of warming.
Those are legitimate reasons why radiative forcing would briefly decrease (as illustrated in Figure 2), taking global temperatures on ‘hiatus.’ Are we now saying that explanation was insufficient? Because Meehl’s heat storage model requires no such drop in energy flux, as shown by the twin bars in left hand of Figure 3 here). So I’m with Peru on this: let’s save this model for some hiatus to come. "let's just say we disagree and leave it at that." Now that phrase is awfully familiar. I'm arguing neither the model nor the data, but let us at least have some consistency in how we reconcile the two.
-
John Bruno at 03:52 AM on 17 October 2011Ocean Heat Poised To Come Back And Haunt Us?
Thank you Rob, great article. I have been struggling to understand when and how the heat being absorbed by the ocean - especially the deep ocean - will be "given back". I have a question about two alternate scenarios to those depicted in your wonderful graphics (Figs 1 and 2); how likely do you/the literature think they are. The first being an increase in the amplitude of the cycles (eg, more "severe" ENSO cycles) and in the second, the cycle gets washed out by the background temp rise and "disappear". A lot of scientists that don't specialize on climate change still assume ENSO will become more severe and when I was working at CSIRO last year, I heard a lot of talk about their models suggestion ENSO would be soon washed out and sort fo fade away. Thoughts? And how did you make those figures?! Cheers, JB -
Karamanski at 03:50 AM on 17 October 2011Ocean Heat Poised To Come Back And Haunt Us?
Thanks for the explanation for my question in comment #7. The increased or decreased evapotranspiration from ENSO does make sense in changing the temperatures in the tropics and subtropics, but the cooling and warming of El Nino and La Nina seem to reach the high latitudes too. For example, the winter of 2006-07(an El Nino winter) was the warmest winter on record by far in the northern hemisphere, with the warmth most pronounced in the high latitudes. A year later, the winter of 2007-08(a La Nina winter) was one of the coldest northern hemisphere winters of the decade, with the cooling most pronounced in the mid to high latitudes. Since EL Nino and La Nina occur in the tropics, one would expect their cooling effects to restricted to the tropics and subtropics. But they seem to have a strong influence on temperatures in the mid to high latitudes. Is there an explanation of how warming or cooling of equatorial pacific waters can cause warming or cooling, say in the arctic, northern Eurasia, and North America? -
SRJ at 02:09 AM on 17 October 2011Antarctica is too cold to lose ice
Based on the post, I get the impression that the causal connection between (CO2 driven) rising global temperature and the decline in Antarctic land ice can be summerazised as follows: 1) CO2 causes an increase in surface air temperature 2) From 1) an increase in ocean temperatures follow 3) The warmer ocean causes ice shelves at the terminus of the glaciers to thinnen, making them lighter and thus given less resistance to the ice flow of the glaciers 4) From 3) an increase in glacier velocity occurs and this removes more ice from the accumulation zone, the result being that the glacier shrinks. Is this an accurate summary of how more CO2 is leading to less antarctic land ice? Suggestions and corrections are more than welcome -
michael sweet at 23:43 PM on 16 October 2011Correction to the True Cost of Coal Power - MMN11
I should have said "How some economists". Unfortunately, many of those economists get headlines in the Wall Street Journal and on Fox news regularly. Assessments from the other side are not publicised to the same extent in the main stream media. If the weather of the past 18 months turns out to be the new normal, they will have devalued all of our lives. -
Norman at 22:02 PM on 16 October 2011Review of Rough Winds: Extreme Weather and Climate Change by James Powell
skywatcher @226, What my data shows is that it resembles the graph of extreme one day preciptiaton events that the Figure 16 of the Peterson (2008) graph shows (I don't have the ability at this time to post this graph, it does not have the normal link of other graphs or I would like to post it here). In the data I compiled for Oklahoma City, there is a large increase in extreme one day precipitation amounts (both in number and preciptiation amount) in the 1980's and then it drops off in the 1990's and 2000's. Very similar pattern to the Figure 16 graph of the Peterson (2008) paper. He has a trend line that shows it going up but nothing comes close to the peak in the 1980's.
Prev 1437 1438 1439 1440 1441 1442 1443 1444 1445 1446 1447 1448 1449 1450 1451 1452 Next


