


 Arguments


Recent Comments
Prev 1439 1440 1441 1442 1443 1444 1445 1446 1447 1448 1449 1450 1451 1452 1453 1454 Next
Comments 72301 to 72350:
-
Bob Lacatena at 23:12 PM on 15 October 2011Continued Lower Atmosphere Warming
53, Ger,I have the impression that all models used are equilibrium models...
And why exactly would you think that? I suggest you read Climate Models: An Assessment of Strengths and Weaknesses (click the Download PDF link to get the full report). -
Dikran Marsupial at 20:57 PM on 15 October 2011Continued Lower Atmosphere Warming
Following on from Glen's excellent comment, I'm going to have a go at explaining to a non-technical audience what I was asking for when I asked Prof. Pielke for the statistical power of the test of the hypothesis. Hopefully this will help explain why Prof. Pielke's assertiones relating to short term trends are potentially deeply misleading. This is likely to be quite a long post, so I may have to make it in installments. Statistical Hypotheis Testing Statistical hypothesis testing is a confusing issue to many, so I will start by running through a simple example. The first step is to form an hypothesis. Lets say I have a coin, and you want to determine if the coin is fair (equally likely to fall as heads as it is as tails), or biased (more likely to fall on one side than the other). Let P be the probability of the coin falling as a head. We first construct the alternative hypothesis (H1), which is usually the thing we want to prove (though not in Prof. Pielke's case as we shall see later), which we can write as H1: P is not equal to 1/2 We also need a null hypothesis, H0, which is normally a statement of what we want to disprove. This is usually the opposite of the alternative hypothesis, H0: P is equal to 1/2 The way statistical hypothesis testing works is to observe some data, and then to see how unlikely it is to observe a set of data as "extreme" or "more extreme" than that we actually observed, if the null hypothesis is true. We call this value the p-value. If the p-value is less than some threshold, α, then we conclude that the null hypothesis is unlikely to be true, so we say "we reject the null hypothesis at the 1-α level of significance". Scientists traditionally set α=0.05, which gives the usual "95% level of significance" that people often talk about. If the p-value is higher than α then we conclude that we can't rule out the possibility that the null hypothesis is true, so we say "we fail to reject the null hypothesis at the 1-α level of significance". At this point, I want to make some observations:- If we are able to reject H0, that doesn't prove that H1 is true. We haven't evaluated the probability of the observations if we assume that the H1 is true, and that probability might also be very small!
- If we can't reject H0, that doesn't mean that H1 is false, it just means that we can't rule H0 out, and if we can't rule H0 out, we can hardly claim that H1 is true.
- The test is not symmetrical, the outcome of the test only depends on H0, H1 doesn't come into the calculation at all. So if we repeat the test and exchange H0 and H1, we won't necessarily obtain the opposite result.
-
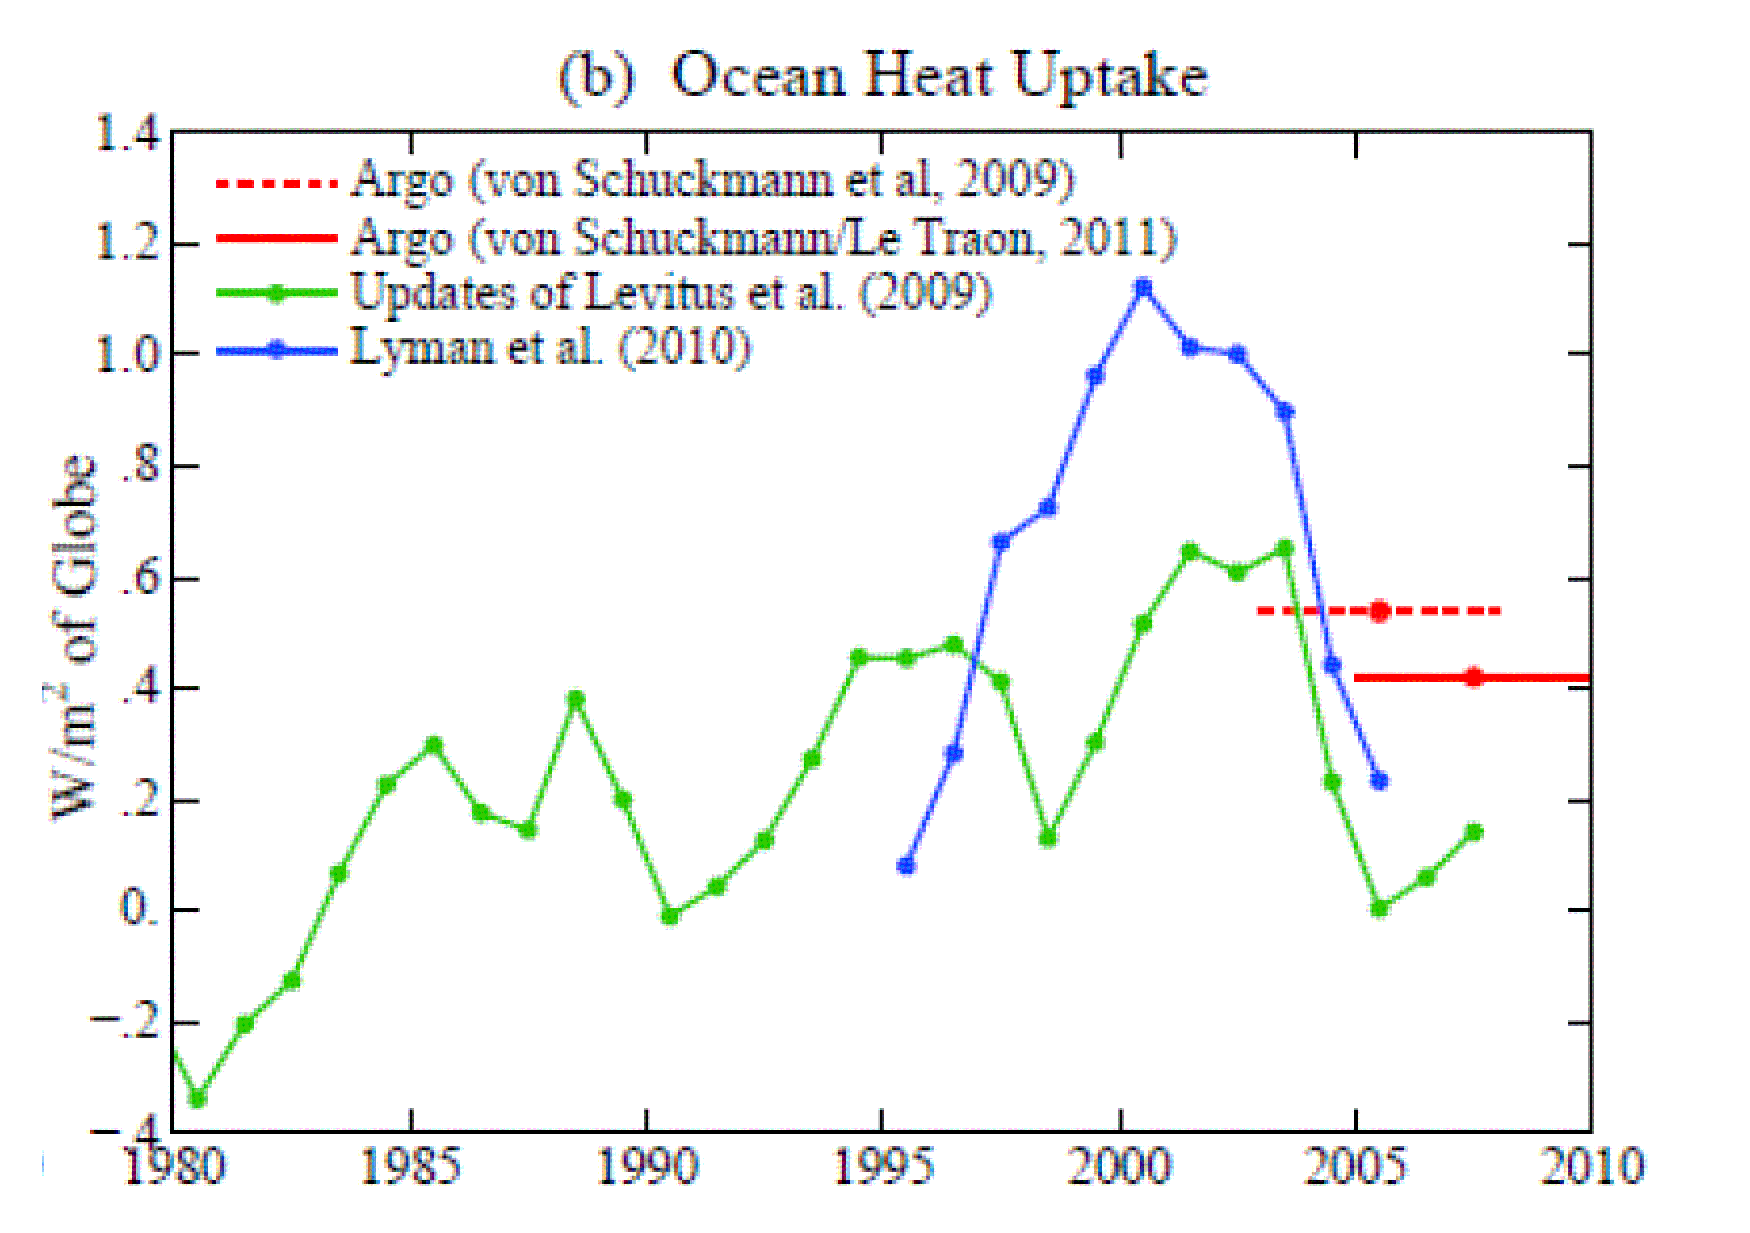
JosHagelaars at 20:17 PM on 15 October 2011Ocean Heat Poised To Come Back And Haunt Us?
@Rob Painting Hansen presented an image (figure 9b) with the ocean heat uptake (0-700m) in his paper: ACPD 2011 Earth’s Energy Balance and Implications The green line in his figure 9b is from the Levitus-data. The 0-2000 m ocean heat content data are now also available. I used these data to construct the same graph graph for both datasets (700m and 2000 m). When you subtract the ocean heat uptake values of the two datasets, you should get an idea in which period the deeper ocean gains more heat than the upper ocean. A nice wave pattern appears with roughly a decadal pattern: Is this image a visualization of the decadal pattern you're talking about here or am I messing things up?
-
jyyh at 18:49 PM on 15 October 2011Continued Lower Atmosphere Warming
ssn tsi, correlate somewhat http://woodfortrees.org/plot/pmod/normalise/mean:30/plot/sidc-ssn/from:1970/normalise/mean:30 -
Glenn Tamblyn at 18:16 PM on 15 October 2011Continued Lower Atmosphere Warming
With this thread seemingly coming to a close, with the next installment shortly, I would like to thank all the participants for the way in which this has been conducted. It is uncommon that 'on-line' debates actually have anything but a marginal relationship to the true principle of debating. The civility of the tone here is in welcome contrasts to the majority of the AGW Blogosphere. That said, I would like to make a general philosophical observation that is related to this topic in a broad sense. Climate models make predictions of future temperature changes based on assumed GH gas concentration changes. These predictions contain error bands for the predictions which reflect the various uncertainties in the estimate. In particular the limitations that models have had (at least up to now) in predicting variability, sub-decadal changes etc. Climate variability of +/- 0.2 C/decade is typical and since this is also within the range of estimates for underlying trend, certainly decade or less time scales are inappropriate for comparing observations with projections, particularly with reference to atmospheric temps alone, TLT or SAT. So observed temps to date are entirely consistent with expectations of an underlying trend with an overlaid variability. If such a hiatus period persisted for several decades that would be cause for re-evaluation. The statement I made above however is what I would expect any reasonable person in professional person in Climate Science to reasonably agree with, as well as technically educated and well-numerate lay observers/enthusiasts of Climate Science. Such would be the circle of Authors here at SkS and many of the regular posters. However, that does not include 99.99% of the human race. Most people don't have technical educations that let them easily evaluate the sort of information presented her at SkS, Dr Pielke's Blog, RC or even the IPCC. Being able to evaluate the difference or significance between a 10 year trend and a 17 or 30 year trend, let alone a model based trend with 'error bars'; To those familiar with science, an error bar is a margin of accuracy. To most people, an error is something that is incorrect. So when discussing the sorts of issues put here, everyone needs to be aware that the discussion is being carried out in front of an audience of others with wildly varying degrees of technical and numeric literacy. And that is before we delve into the world of those individuals who want, need, to believe that AGW is all wrong. To the commenters here discussion of the 'it hasn't warmed much since xxxx has significance yyyy' variety is a reasonable technical discussion. To many of the lay-public this sounds like someone saying 'It hasn't warmed since xxxx therefore WARMING HAS STOPPED! So much for these AGW theories!' The point I am trying to make is that in puting up comments in a technical discussion, participants need to be aware that their conversation is being read by others who may not 'process' their comments in the way intended by the author. So there is a continuous, demanding requirement to express ideas in ways that cannot be mis-construed by a less technical audience. Our comments can easily mislead just because we do not allow for the knowledge-base of our audience. So when authors here at SkS defend the use of longer time-scales as a basis for looking at trends, they are not simply attempting to ignore the shorter timescale details that may have a relevence in considering the dynamics of short term climate variability questions - a technical discussion. They are also trying to defend against a less technical audience drawing inaccurate conclusions from the comments because they do not understand the numerical details, or because they have an entrenched position where they want to find grounds to reject AGW in-toto and simply want ammunition. Look at the example of Al Gore and his movie. This was aimed at a mass audience who know diddly-squat about climate science. So he shows the Ice Core data with CO2 & Temps tracking each other pretty much in synch but he doesn't highlight the 800 year time-lag. He was aiming this at a mass audience trying to give a generalised, simplified over-view perspective. Then the fact that he didn't highlight the Temp/CO2 time lag (or the Methane signature, Ice Sheet change time lags, variations in dust levels, changes in vegetation patterns, ocean circulation patterns etc) has been taken by some as being evidence of a deception. When in fact it was simply a simplification for general consumption. It is a reality in the hyper-charged world of AGW Politics/Science that there are some groups and individuals who WANT to show AGW as false - hence the D-word applied to them. And they will commonly take comments & statements, whether from the IPCC or a simple blog-post and try to build ammunition from it to distort and mislead others and defend their 'needed' position. This is in contrast to those who may be truely skeptical - with the critical open-mindedness this implies. However the D'ers are all to eager to cloak themselves in the rainment of 'skeptics'. So as a general comment/plea to all participants here. Ask yourself: 'Who is my intended target audience when I make this comment?'. And more importantly, 'Who will be the ACTUAL audience for my comment, intended or otherwise?'. When making a point on a technical issue of statistics or thermodynamics, will my comment be something that can easily be miscontrued by the uninformed, or worse, misrpresented by the malicious well informed. In this technical debate is important. But care and precision with semantics and language is vitally important when the debate is public. And this is the Internet. EVERYTHING is public. -
Riccardo at 17:45 PM on 15 October 2011Continued Lower Atmosphere Warming
Like others, I feel disappointed by this discussion with Dr. Pielke. We all have been taught that if the data are not sufficient to come to any conclusion we should look for more, not just stay there. The reason why one should stubbornly stick to a non statistical significant trend disgregarding the great part of the data (which we have) is beyond me. -
Ger at 16:44 PM on 15 October 2011Continued Lower Atmosphere Warming
With a climate system obeying a more or less chaotic model,is the type of statistics applied the correct one? I have the impression that all models used are equilibrium models, on which a kind of perbutration theory is applied, which is assumed to be Gaussian in nature. All the methods in deriving general parameters are based on those assumptions known to hold for stable, equilibrium models. Just saying that one can battle for years to come over a method which is not applicable in this case. What does stand is that CO2 has rissen sharply and sure it will end up into a different environment, probably not one we or any other higher life form can adapt to so quickly (I give the simple single cell forms a good chance to survive) -
Pete Dunkelberg at 16:06 PM on 15 October 2011The Dai After Tomorrow
Daniel, Thanks for looking into this! I'm not sure it's cleared up though. I referred to figure 11 (c) which is for 2000-2009, a period we have just lived through. The base period is 1950-1979, also familiar. I would expect the base period for the online PDSI maps at NOAA to be similar. In addition, reading Dai's paper from the top as I did, and seeing his other figures including figure 7, I still have trouble matching fig. 11 (c) to everything else. Perhaps I should ask Dai unless you have another thought. By the way how do you get these diagrams? do you have the paper as html?Response:[DB] Pete, the versions in the article above are taken directly from HQ versions hosted by UCAR (Dr. Dai works at UCAR). My assumption is that they were re-worked to be more reflective of the depth of the data available than the pixilated versions in the final paper. HTH.
-
Philippe Chantreau at 15:20 PM on 15 October 2011Continued Lower Atmosphere Warming
Dr Pielke, we are not going in circles, you are. I am joining Paul Tremblay on his questions. If the result of a discussion is going to be "it's not that important and we should move on" why do you raise the question in the first place? I believe that some of these were given some attention on your blog, so at the time you must have thought they did have some importance, what has changed? Paul made a summary of various different points that have been given that treatment, I am as eager to know about why they are now unimportant as he is. Perusing through your posts on the threads on which you have participated, I found both that "policy makers have been misled to think that warming should be monotonous year after year" and extreme attention on your part on time periods during which no trend can be established with significance by any statistical means. This latter emphasis on short time "trends" is exactly why policy makers would come to expect that change be monotonous if they read your blog or other "skeptic" outlets. I admit it is rather surprising and confusing. If you're concerned about policy makers' perception of the trend, should you not only focus on trends that are statistically significant? -
Daniel Bailey at 14:18 PM on 15 October 2011The Dai After Tomorrow
Pete, that's a good question. Perusing the paper I find this:"We emphasize that quantitative interpretation of the PDSI values shown in Figure 11 requires caution because many of the PDSI values, which are calibrated to the 1950–1979 model climate, are well out of the range for the current climate, based on which the PDSI was designed."
For reference, here's Figure 11: A description of their methodology:
 "Here monthly PDSI pm and sc PDSI pm were computed using multi-model ensemble-mean monthly data of precipitation, surface air temperature, specific humidity, net radiation, wind speed, and air pressure from 22 coupled climate models participated in the IPCC AR4,128 and used to assess changes in aridity over global land. Thus, these PDSI values may be interpreted as for the multi-model mean climate conditions. As the PDSI is a slow varying variable, the lack of high-frequency variability in the ensemble mean climate is unlikely to induce mean biases. Figure 11 shows the select decadal-mean sc PDSI pm maps from the 1950s to 2090s from the IPCC 20th century (20C3M) and SRES A1B scenario simulations. Results for PDSI pm are similar with slightly larger magnitudes."
The other graphics you link to, March 2000-March 2009 and August+September of 2011, are of much more limited snapshots in time & reflect actual measurements of PDSI. Hope that's more clear than mud! -
steve from brisbane at 14:17 PM on 15 October 2011Continued Lower Atmosphere Warming
Perhaps not directly on topic, but it does get a mention above. I've noticed at his blog (and now here) that Pielke Snr refers from time to time to his concern about biogeochemistry effects of increased CO2, but I can't say that I have ever noticed a succinct summary on his blog (or elsewhere) as to what specifically he is referring to. Ocean acidification obviously springs to mind, but it always seems his meaning is broader. I would be more than happy if he could explain here. I would also be curious as to why, if he considers this alone to be reason to take serious action on CO2 emissions, does he spend an enormous amount of time on disputing the way other climate scientists are measuring or understanding global warming, when that is obviously interpreted by the climate change skeptics as meaning there is too much uncertainty to bother starting serious action to reduce CO2. It always seems to me that only a tiny fraction of his time is devoted to reminding the likes of WUWT readers that he actually thinks CO2 emissions should be reduced. The rest is on criticism which they interpret as meaning there is no need yet for serious action. -
dana1981 at 14:16 PM on 15 October 2011Continued Lower Atmosphere Warming
Allow me to attempt to summarize the state of the TLT discussion at this point. 1) We agree that over very short timeframes, it's possible to select TLT data for which the trend is small. SkS has said this is actually an expected result (see Santer et al. and the influences of ENSO, solar, and aerosols over the past decade). Dr. Pielke has not explicitly agreed with this point (in fact for some reason he seems to oppose trying to determine why the short-term warming has slowed), but does agree that the short-term slowing of the TLT trend tells us absolutely nothing about global warming. 2) Dr. Pielke says"the failure to accept a slowing down of the tropospheric warming, which seems so obvious to me, actually prevents a more constructive discussion with the so-called "skeptics"."
I think this is a fundamentally unscientific position from Dr. Pielke. He seems to believe that we should cherrypick short timeframes which are not statistically significant, and should not try to examine what effect various factors like ENSO have had on temperatures over that short, cherrypicked timeframe, in order to create a "more constructive discussion with the so-called skeptics." Frankly I think this is a rather appalling statement and could not disagree more. We should not lower the quality of our scientific and statistical analysis just to make the "skeptics" happy. We have agreed that TLT warming has slowed recently, but a) the change is not statistically significant and b) there are reasons behind the change That Dr. Pielke admonishes us for noting these two facts disturbs me. As I said, he seems to be advocating an unscientific approach just to make "skeptics" happy. 3) Dr. Pielke has agreed with our criticisms regarding cherrypicking of short-term data; however, I still fail to understand why he has engaged in this type of argument if he agrees it is invalid, unless he believes it will somehow bridge the gap between our "side" (that being the side of accurate scientific and statistical analysis) and the side of the "skeptics" (that apparently being the cherrypicking side). Frankly this discussion has left me in a very confused state. -
Norman at 13:31 PM on 15 October 2011Review of Rough Winds: Extreme Weather and Climate Change by James Powell
skywatcher @208 In the Peterson (2008) paper, I am wondering if you could explain figure 16 trend line. There is a monster peak in the early 1980's but the trend line barely goes up for the 5-day maximum and actually goes down for the 1-day precipitation even though this frame is by far the greatest amount of precipitation anomalies. Then in the early 1990's the dip downward is the greatest since 1956 but the trend line is going up. Without an understanding of how this trend line works or what it is showing, I am not sure how the author concludes that preciptiation has been increasing. -
Bernard J. at 13:25 PM on 15 October 2011Continued Lower Atmosphere Warming
Pielkesr. Did you determine the (1 − β) values for your short-term TLT calculations? 1) If so, could you inform the thread of the values? 2) If not, why did you not determine these values? -
muoncounter at 13:18 PM on 15 October 2011Every Picture Tells A Story
I dunno, DB, you provide clear evidence that a. Aurora, when mapped as blue, causes snow b. Aurora, when mapped as red, melts Arctic ice thus proving you can have your cake and eat it too. That circumpolar donut looks pretty tasty. -
Daniel Bailey at 13:05 PM on 15 October 2011Every Picture Tells A Story
I must offer up an apology to Gareth at Hot Topic: I unwittingly used a combination of a Rod Stewart Video + Catchy Title for a blog post that Gareth used in a post last year on Tom Yulsman's Mondrian graphic. For the inspiration for this post, I was watching the science video linked above when the Rod Stewart song of the title came on the radio. Good thing it wasn't "The First Cut is the Deepest"... -
Pete Dunkelberg at 13:01 PM on 15 October 2011The Dai After Tomorrow
I have a question on Dai's through review of drought. Your figure 1 closely resembles Dai's figure 11 (c). Much of the USA is red or orange. This is a surprise to me. Compare the other PDSI source: http://www.ncdc.noaa.gov/temp-and-precip/drought/historical-palmers.php?index=pdsi&month[]=3&beg_year=2000&end_year=2009&submitted=Submit or http://www.ncdc.noaa.gov/temp-and-precip/drought/historical-palmers.php?index=pdsi&month[]=8&month[]=9&beg_year=2011&end_year=2011&submitted=Submit USA is not so dry after all. This seems more realistic to me. Can you shed any light on this difference? -
muoncounter at 12:26 PM on 15 October 2011An exponential increase in CO2 will result in a linear increase in temperature
This is an easy misconception to make. However, we must look at CO2 as a function of time, which over the long run is strongly concave up. Temperature as a function of time can also be shown to be concave up - rates of change that increase.
 So 0.18 deg C/decade over the past 35 years can be said to be just the tip of the warming iceberg.
-
Daniel Bailey at 12:11 PM on 15 October 2011Continued Lower Atmosphere Warming
Re: pielkesr With all due respect and thanks to our guest here, Dr. Pielke Sr. for his constructive interactions on this thread, there yet exist a number of issues needing elaboration and elucidation. Such as:"All one has to do is look at figure [references a statistically insignificant short period of time in the satellite lower troposphere datasets]..."
and"Figure 8 clearly shows the step change after 1998 [again references a statistically insignificant short period of time in the satellite lower troposphere datasets] along with the large warming at higher northern latitudes. You do not need statistics to see the obvious."
[Emphasis added] Again, a repeated demonstration of the power of visual inspection as a metric of statistical significance in the scientific arena; all in lieu of actual analysis of time-series too short by definition of receiving rigorous statistical analysis of their significance (if any). Given these precedents, let us use our new-found powers of visual inspection to ponder the scientific significance of these: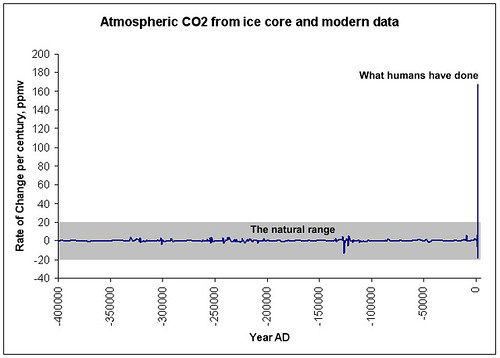
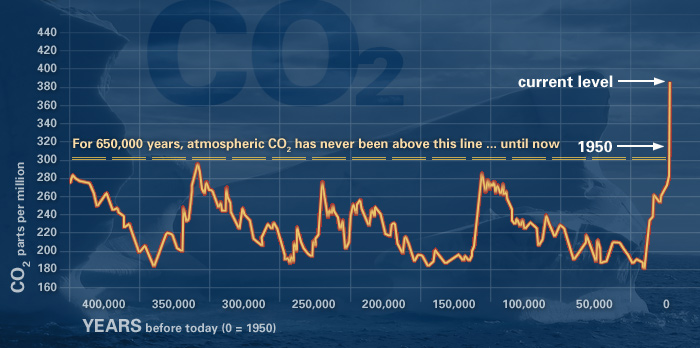

 Please note that all four of these time-series involve trends of decades-to-hundreds-of-millennia (all greater than the 30 years minimum standard to be considered climate).
It is indeed exceedingly clear that one does not need statistics to see the obvious...
Please note that all four of these time-series involve trends of decades-to-hundreds-of-millennia (all greater than the 30 years minimum standard to be considered climate).
It is indeed exceedingly clear that one does not need statistics to see the obvious...
-
Bob Lacatena at 11:02 AM on 15 October 2011An exponential increase in CO2 will result in a linear increase in temperature
dagold, [Answer to dagold's question from here.] There are a few answers to your question, each of them playing a part, but I think the biggest answer is simply that warming is not and cannot be expected to be linear. The current rate of warming will increase in some decades, decrease in others, and the final equilibrium temperature of the planet will not necessarily be reached at the same point in time that a doubling is reached... warming will continue beyond that (for how long, it's hard to say)... although, too, since any response to CO2 is logarithmic, in that sense warming will slow, not speed, as we reach a true doubling of atmospheric CO2. Take, for example, the Arctic feedback. As the summer ice melts, the open water absorbs rather than reflects incoming sunlight back into space. At the moment, this feedback is minimal because the system has not gained enough energy to melt Arctic ice by enough, soon enough in the spring/summer months, to have that much effect. When that point is reached, however, and accelerates, we can probably expect even faster warming. In a nutshell, there are a lot of feedbacks that are not simple and linear. Some will occur in steps (like a sudden increased release of methane gas from bogs and oceans) or wait to be triggered at certain tipping points. Some of these may not occur for decades, others perhaps not even for a century (such as the CO2 feedback from a transition of large swaths of the Amazon rainforest, God forbid, to savanna). -
pielkesr at 10:53 AM on 15 October 2011Continued Lower Atmosphere Warming
All - We are going around in cirles on this issue. The parallel to cruise control misses that there are multiple forcings and feedbacks occurring. The "car" is not driving on a simple two dimensional surface. GHG forcing is but oe of a diverse range of human and natural climate forcings. Nonetheless, while we still disagree on a number of issues, I found many of your comments informative. I plan to summarize my conclusion from these discussions later next week. Thnak you again for the opportunity to interact (mostly :-) constructively. -
dagold at 10:11 AM on 15 October 2011Continued Lower Atmosphere Warming
I realize this may be off-topic, but I an intensely interested lay person learning as quickly as possible: Muonocounter commented:" The result of that analysis (Tamino's)is the familiar 35 year trend of 0.18 deg C per decade, which seems unshakeable at this point. " My quick calculations of another 85 years to reach 560/CO2 doubling (assuming 2 ppm per year) at 0.18 C per decade yields a total temp increase of approx. 2.3 C for CO2 doubling...why is this below commonly accepted median of 3.0 C for climate sensitivity? Thanks!Moderator Response: [Sph] People will gladly answer such questions, but please make some effort to find an appropriate thread using the search box at the top of the page. Many regulars monitor the "Recent Comments" page and so will see and respond to your question where ever you put it.
You can find my response to your question here, where that post will also give you other relevant information. -
paulhtremblay at 09:54 AM on 15 October 2011Continued Lower Atmosphere Warming
Dr.Pielke writes: >>You are never going to be successful in building a bridge to those who do not share your viewpoint unless you recognize the value of the other perspectives. You have repeated this admonition a number of times, and it is not helpful in leading to a better understanding of climate science. In essence, you want us to accept your viewpoints just for the sake of agreement. Truth is not arrived at that way. I will repeat what a number of posters have asked for here, what I implied in my very first post: what is the statistical significance of your claim? If there is no statistical significance, then you should not mention it, or admit that it was not prudent to do so. Your other arguments about heat in the ocean may or may not be relevant, but they have little to do with you initial statement. I am also noticing a disturbing pattern from you. You make a controversial claim ("SkS makes ad hominem attacks on Christy," "CO2 forcing is only 28%," "the global average temperature trend in the lower troposphere has been nearly flat"), and then when pressed to substantiate these claims, you claim that the details are not really important to the bigger picture, and we should just move on. If these small details are not important, why raise them to begin with? -
WheelsOC at 08:59 AM on 15 October 2011Continued Lower Atmosphere Warming
Dr. Pielke, how can we ever "move on" if you've never bothered to address what this post has been about? That sounds to me like you're asking us to simply ignore the issues that were raised. Here's what you have not answered regarding this SKS post: 1) Why did you select a 13 year period in one of two datasets to make the argument that TLT trend has been flat, when the other dataset disagrees AND the time scale you used probably makes your conclusion statistically insignificant? 2) Why won't you do the trivial work of establishing statistical significance for your claims, claims you've used to criticize a published and peer-reviewed paper? If you can't be bothered to respond to intelligent and careful criticisms of these arguments you're making, it's irresponsible to make them in the first place. This is doubly so since your arguments echo and feed into dishonest tactics used by people who want to avoid dealing with important environmental issues by denying the extent of the problem. -
adelady at 08:34 AM on 15 October 2011Continued Lower Atmosphere Warming
Dr Pielke "To say the tropospheric heating has not been less in recent years, is like saying a car is still accelerating with the speedometer says it is at a nearly constant speed over the last few kilometers." I think a car analogy can be useful, but not this one. If you rethink a car being under cruise control, but with the power output being regulated rather than the speed, it's a lot like the climate system being 'driven' by a forcing - in this case CO2 and other GHGs. And we know why cars are not controlled in this way. Because the natural terrain will cause the vehicle to vary its speed. Speeding up and slowing down in various conditions despite the power generated being exactly the same. And that's what we mean when we talk about the climate system, oceans and all, being forced in one direction. Just as a car with constant power will not show constant speed, it will still get the occupants where they're going - even if the terrain is hilly, or twists a lot, or offers fords with flowing water rather than bridges, or gives a bumpy ride over unmade surfaces. And GHGs do the same for the climate system. They will get us where they're driving us. We simply don't have a map detailed enough to tell us exactly when the bumpy rides and the variable speeds will occur nor how long they'll affect our progress. We have to map our terrain as we go. We call it natural variability. -
pielkesr at 08:07 AM on 15 October 2011Continued Lower Atmosphere Warming
Dikran Marsupial/Albatross Well - its time to move to another topic. To argue over whether the warming in the lower troposphere started in 1998 or in 2002 misses the point. All one has to do is look at figure 7 TLT in http://www.ssmi.com/msu/msu_data_description.html. Figure 8 clearly shows the step change after 1998 along with the large warming at higher northern latitudes. You do not need statistics to see the obvious. We all agree the lower troposphere is warmer today than it was in 1979. Lets move on as the comments are starting to deteroriate as they did when I first started to comment on SkS. You are never going to be successful in building a bridge to those who do not share your viewpoint unless you recognize the value of the other perspectives. Finally, Chris G, you write "The vast majority of climate researchers are convinced that reductions of CO2 production improves our future situation more than any other factor." I am not sure where you obtained this information, but can assure you that this is not case, as exemplified by recent co-authored papers I have been involved with; e.g. Pielke Sr., R.A., A. Pitman, D. Niyogi, R. Mahmood, C. McAlpine, F. Hossain, K. Goldewijk, U. Nair, R. Betts, S. Fall, M. Reichstein, P. Kabat, and N. de Noblet-Ducoudré, 2011: Land use/land cover changes and climate: Modeling analysis and observational evidence. Wiley Interdisciplinary Reviews: Climate Change, Invited paper, in press. http://pielkeclimatesci.files.wordpress.com/2011/09/r-369.pdf Pielke Sr., R.A., R. Wilby, D. Niyogi, F. Hossain, K. Dairuku, J. Adegoke, G. Kallos, T. Seastedt, and K. Suding, 2011: Dealing with complexity and extreme events using a bottom-up, resource-based vulnerability perspective. AGU Monograph on Complexity and Extreme Events in Geosciences, in press. http://pielkeclimatesci.files.wordpress.com/2011/05/r-365.pdf McAlpine, C.A., W.F. Laurance, J.G. Ryan, L. Seabrook, J.I. Syktus, A.E. Etter, P.M. Fearnside, P. Dargusch, and R.A. Pielke Sr. 2010: More than CO2: A broader picture for managing climate change and variability to avoid ecosystem collapse. Current Opinion in Environmental Sustainability, 2:334-336, DOI10.1016/j.cosust.2010.10.001. http://pielkeclimatesci.wordpress.com/files/2010/12/r-355.pdf Mahmood, R., R.A. Pielke Sr., K.G. Hubbard, D. Niyogi, G. Bonan, P. Lawrence, B. Baker, R. McNider, C. McAlpine, A. Etter, S. Gameda, B. Qian, A. Carleton, A. Beltran-Przekurat, T. Chase, A.I. Quintanar, J.O. Adegoke, S. Vezhapparambu, G. Conner, S. Asefi, E. Sertel, D.R. Legates, Y. Wu, R. Hale, O.W. Frauenfeld, A. Watts, M. Shepherd, C. Mitra, V.G. Anantharaj, S. Fall,R. Lund, A. Nordfelt, P. Blanken, J. Du, H.-I. Chang, R. Leeper, U.S. Nair, S. Dobler, R. Deo, and J. Syktus, 2010: Impacts of land use land cover change on climate and future research priorities. Bull. Amer. Meteor. Soc., 91, 37–46, DOI: 10.1175/2009BAMS2769.1 http://pielkeclimatesci.wordpress.com/files/2010/02/r-323.pdf Pielke Sr., R., K. Beven, G. Brasseur, J. Calvert, M. Chahine, R. Dickerson, D. Entekhabi, E. Foufoula-Georgiou, H. Gupta, V. Gupta, W. Krajewski, E. Philip Krider, W. K.M. Lau, J. McDonnell, W. Rossow, J. Schaake, J. Smith, S. Sorooshian, and E. Wood, 2009: Climate change: The need to consider human forcings besides greenhouse gases. Eos, Vol. 90, No. 45, 10 November 2009, 413. Copyright (2009) American Geophysical Union. http://pielkeclimatesci.wordpress.com/files/2009/12/r-354.pdf -
Jonathon at 07:42 AM on 15 October 2011There is no consensus
Muon, Any confusion between 'we all agree', 'general agreement' and 'consensus' was unintentional. -
muoncounter at 07:25 AM on 15 October 2011There is no consensus
Jonathon#483: If you want to debate the existence or validity of 'consensus,' then it is critical to set a standard. Do you not see the difference between 'general agreement' and 'we all agree'? For example, there is probably 'general agreement' among regular readers here that the Oregon Petition is a waste of time. However, I would not say 'we all agree' about that. -
Jonathon at 06:46 AM on 15 October 2011Continued Lower Atmosphere Warming
Tom, I originally used 5 years as reported on many sites, but it did not filter out all the noise, particularly solar cycles and ENSO events. Although 5 years is a better choice for looking at how these events affect temperature. Using 11 (or 9) years does not change the results. At some point, all statistics are arbitrary, because we have chosen them for use. I never said this was a "solution," just better than arbitrarily selected a start date for linear regression. -
Composer99 at 06:36 AM on 15 October 2011Climate 'Skeptics' are like Galileo
saltspringson's comment has got to be good for a bingo. -
Tom Dayton at 05:31 AM on 15 October 2011Continued Lower Atmosphere Warming
Jonathon, you missed my points. Your choice of 120 months for your moving average is an example of the very same arbitrary choice of timing you claimed to have avoided by using a moving average. Why did you choose 120 months (10 years)? Why not 132 (11 years), which might better take out the solar cycle? Why not some other? You have not avoided arbitrary choice of starting years for computing the trends. You must choose the starting and ending years (and therefore all the years in between) across which you compute the trend in moving average. You did exactly that. Why did you choose those particular starting and ending years? Why not some others? Your "solution" of simply using moving averages isn't a solution to the issue you claimed it is. -
Ari Jokimäki at 05:26 AM on 15 October 2011Continued Lower Atmosphere Warming
"It amazes me that with the diversity of human climate forcings, the newly recognized higher importance of solar forcing,..." Surely you don't mean the new Ineson et al. where the authors state already in the abstract that there's little change in global average temperature due to solar uv irradiance? -
Jonathon at 05:26 AM on 15 October 2011There is no consensus
Muon, [snip] Is that your only issue here? That I used we all agree instead of general agreement?Moderator Response: [Dikran Marsupial] Inflamatory deleted. Please can everyon involved in this discussion return to a more neutral tone. As there is "general agreement" amongst the climatolgists, but they dont all agree then the difference between definitions is substantive. Please, no more word games, no more discussion of climate sensitivity on this thread. Please get back on topic. -
Utahn at 05:20 AM on 15 October 2011Continued Lower Atmosphere Warming
Wow, Dr.Pielke, if you'll bear with a novice here and forget my last two posts. Would you agree to the statement that "While it tells us nothing about the future, nor the reasons for increased warming, that from 2006 to now lower tropospheric warming has essentially resumed, at what appears to be a much faster pace than the 30 year trend? And please correct me if I'm wrong! -
Jonathon at 05:20 AM on 15 October 2011Continued Lower Atmosphere Warming
Tom, I mentioned that it was a 120-month (10-year) moving average, and is centered around the dates mentioned. The nice thing about employing a moving average, is that one does not need to choose the timing. This shown in the earlier posts depending on the starting year for computing trends. If you object to using the change in the moving average, then the maximum value occurred in July, 2002 (a local maxima occurred in July, 2005, but it did not exceed the earlier maxima). Hence, any trend starting in 2002 is likely to show a temperature decline. In fact, any trendline starting after Jan, 1997 (with the exception of the La Nina '99) shows a slightly negative trend (although not significantly different from zero). -
Bob Lacatena at 05:08 AM on 15 October 2011There is no consensus
478, Jonathan, No, I'm not late to the party. I've read all of the comments. You missed my point. You are the one who is making propositions which others on this thread then try to recast into reasonable statements. You ignore their input and go on and on with your own peculiar interpretation of events as if you are speaking a different language, or rather speaking and not listening. I will repeat: You are personally redefining "consensus" in a way that lets you claim that there is none. The problem lies in your personal definition of consensus. There is a consensus that climate sensitivity is positive. The only people who try to imply otherwise are Lindzen and Spencer, but I don't think that even they would be caught dead actually coming out and saying such foolishness. There is a vague consensus around the likely range of climate sensitivity, based on the growing number of studies that all seem to fall in the 2˚C-4.5˚C range, centered somewhere around 3˚C. You can use the search button at the top of the page to find, read, and argue about such claims. But the point here is consensus. There is a growing consensus, resulting from a growing body of mutually confirming evidence using multiple sources and observations, which helps to bracket likely climate sensitivity. That you refuse to accept this consensus does not dissipate it one whit. That you choose to try to cast the term "consensus," the actual nature of such a consensus, or the body of knowledge behind said consensus into your own "we don't know, we can't know, we should wait" paradigm again does not dissipate the actual consensus one whit. -
Utahn at 05:08 AM on 15 October 2011Continued Lower Atmosphere Warming
Sorry should say "similar to perhaps slightly slower pace than the long term trend when assessed from 2006 to now?" Long term trend meaning the past 30 years... -
Utahn at 04:59 AM on 15 October 2011Continued Lower Atmosphere Warming
Dr. Pielke, you wrote, speaking of 2002 to present: "While it shows that lower tropospheric warming has essetially halted in the last few years (which we seem to agree on), it tells us nothing about the future, nor the reasons for the lack of warming." Will you agree to the statement that, while not telling us anything about the future, or the long term trend, that clearly lower tropospheric warming has essentially resumed at a similar or slightly faster pace than the long term trend from 2006 to now? -
Daniel Bailey at 04:58 AM on 15 October 2011Climate 'Skeptics' are like Galileo
@ saltspringson 1. If by "suppression" you mean some scientists trying to keep bad papers from being published in quality journals without being improved to minimal standards of quality, then yes. 2. You'd better keep your money & invest it in actually learning more about climate science. Five years is a blink of an eye to overturn centuries of research by the lifetimes of thousands of scientists. The remainder of this point is a Gish Gallop on models & generic "skeptic" talking points (buzzwords like "Trenberth's missing heat" are a giveaway). 3. Actually, temps peaked due to climate system equilibria being reached several thousand years ago during the Holocene Climatic Optimum and then started a long, slow decline (marked by periods of natural variability) until the effects of mankind's injection of fossil-fuel GHGs into the carbon cycle began to take their toll. Temps now have equaled and begun to surpass those of the HCO (at a time when natural forcings should be pointed towards a continued decline to a glaciated state millennia in the future). Thus "skeptics" insisting that AGW has been overturned reveal themselves to be deniers of the science. 4. When it comes to the world is warming, that is settled fact. That mankind is 90% likely responsible for the majority of the rise post-1970 follows. That mainstream media, politicians and the public at large can be mislead by counter-disinformation campaigns funded by fossil-fuel interests intent on prosecuting an agenda of dissembling and anti-science is clear. I advise listening less to the dissembling bloggers & conspiracy theorists and learn for yourself what the science of climate change actually says for yourself."Pour the coppers of your pockets into your mind and your mind will line your pockets with gold."
-
Chris G at 04:44 AM on 15 October 2011Continued Lower Atmosphere Warming
Darn my OS upgrade and loss of all allow-bookmarks-from-these-sites policy settings. Repeating: Dikrans point at (21) about the null hypothesis test has been unanswered. Dr. Pielke, Sr. (24) has requested a significance test when he and everyone else has agreed that it would have no meaning. What is the point of that? OHC versus TLT and police making: Granted, OHC is a stronger metric than surface temps, but we have very scant information on OHC and multitudinous and long records of surface temps. Why would anyone advocate ignoring the bulk of the information available when making policy? Focusing on OHC only plays into the hands of those that profit from policies which do not change BAU, because there is not yet a great deal of information about OHC. Re: "I suggest you, and others, hurt the environmental movement by focusing so heavily on just one environmental issue. " Whenever you have multiple problems and limited resources, you have to focus primarily on getting the best return on your investment. The vast majority of climate researchers are convinced that reductions of CO2 production improves our future situation more than any other factor. Maybe that is where we have recognise that there is disagreement between Dr Pielke, Sr. and a handful of others, and the majority, and move on. -
Albatross at 04:40 AM on 15 October 2011Continued Lower Atmosphere Warming
Hello Dr. Pielke @19, You say: "While it shows that lower tropospheric warming has essetially halted in the last few years (which we seem to agree on), it tells us nothing about the future, nor the reasons for the lack of warming" And "This short term trend does not tell us that the long term trend has been significantly changed (yet)." I do not wish to be pedantic, but this is not what you told readers on your blog. You said: "they did not recognize that the global average temperature trend in the lower troposphere has been nearly flat as shown, for example, in the figure below from the RSS MSU data...There has been NO long-term trend since the large El Nino in 1998. That’s 13 years." You were quite assertive that this was a noteworthy finding and went so far to underline the '13 years'. And as for your claim "lower tropospheric warming has essentially halted in the last few years". "Halted" is very definitive, and is not consistent with your observation that "This short term trend does not tell us that the long term trend has been significantly changed (yet)". The fact remains that trends for 2002-present is simply too short a period to draw any meaningful conclusions, especially if one does not consider all the data and the role of aerosol loading, solar minimum, ENSO etc. It is also not an accurate characterization of what is happening. A more accurate way of describing it would be a temporary slow down, because we know from observations (e.g., Hansen et al. 2011) that the climate system is still in a positive energy imbalance and has continued to accumulate energy since 2002, albeit at a slower rate. Earlier@10 you also made the claim that: "What one sees in the defense of SkS of the long term linear trend is an effort to explain away differences that occur whenever they (unexpectedly) appear." and "The only remaining two options are the deep ocean and/or out into space. We should be focusing on this issue instead of how long a data set is needed to ferret out a slow linear trend." I take strong exception to those characterizations. It is the 'skeptics' who are trying to explain away AGW by focusing on the noise in the system and ferreting out out windows of time when there was little or no warming. Also, applying statistical analysis correctly as we are doing here is not "defending" anything except the intergity of the scientific method and appropriate statistical analysis. That is something that I would have hoped that you would endorse. To suggest that we, or IPCC scientists, are trying to "explain away differences" is simply not true. A great amount of time is spent by climate scientists looking at climate variability and working towards improving our understanding the climate system, I provided but a few links to the literature in my previous post @2. As I mentioned earlier, it is 'skeptics' who are trying to hide the incline and disappear the warming. I find it very odd that "skeptic" scientists do not use short-term trends to highlight periods of more rapid warming, why are such periods of warming any less important or of less scientific interest than hiatus periods? That they don't just highlights their confirmation bias. Doing that is very harmful because if fabricates debate, fosters doubt and misleads people into a false sense of security that the warming is not as bad as expected-- all based on statistically meaningless trends. As for your characterization of the "slow long term" trend is inaccurate in my opinion. That is a subjective and relative term and what people should correctly understand by 'slow' very much depends on the context. We are currently warming much faster than during the PETM, for example. -
Tom Dayton at 04:35 AM on 15 October 2011Continued Lower Atmosphere Warming
Jonathon, unfortunately there is no "the" moving average. You must choose the timeframe for it--the surrounding two data years, or the surrounding four years, or.... And you're not examining just the moving average at a point, but the trend in the moving average over some number of years. How many years should you use? 2002 until now? 2008 until now? 1979 until now? How do you judge whether that trend is representative of the underlying population's trend (the "real" trend, in some sense)? You've got to apply a statistical test of some sort, but choosing that test requires attending to Dikran's explanations and cautions. Computing moving averages is one way to smooth out the noise so you can see the signal, but it is not magic. There still is noise, so you still need to examine the trend over a long enough time to have the statistical power to detect the signal over that noise. -
Dikran Marsupial at 03:49 AM on 15 October 2011Continued Lower Atmosphere Warming
Prof. Pielke wrote: "Regarding #21, we will just have to disagree and move on." No, I'm sorry Prof. Pielke but you cannot simply ignore correct statistical practice, it is a cornerstone of modern scientific method. If you cannnot demonstrate that an hypothesis is supported by the data then you should not use it as a basis for your arguments. If you continue to make such arguments there is a strong possibility that you will be misleading those who are listening to them. "You are asking if the recent data alters a longer term trend significantly. I ageee; it does not." So you would agree that your third hypothesis is not supported by the data then? If so, that is good, but one wonders in that case why you put the hypothesis forward? "But what I am asking is if you took the data since 2002, does it show a trend that is significantly different than zero." I have already said (here) that I agree that your first hypothesis is undoubtedly correct. However I have also pointed out at least three times that unless the hypothesis test has useful statistical power the fact that the trend is not significantly different from zero is essentially meaningless. You have made no attempt to address that issue whatsoever. Now I have asked you three times to state the statistical power of the test and have not recieved a direct answer on any of these occasions. This is not unreasonable question to ask a senior academic in a field that deals with the analysis of observational data, the proper interpretation of a statistical hypothesis test is something that every scientist should feel comfortable with. There is no point in asking again, so I won't, but will instead have to conclude that you are either unable or unwilling to answer the question. I find that rather troubling. -
Albatross at 03:48 AM on 15 October 2011Continued Lower Atmosphere Warming
Hello Dr. Pielke, With all respect, you are going off topic and obfuscating. Normally off topic posts are deleted. This thread was written to address the choice (by you) of 1998 as a start date with which to calculate a short-term trend and then confidently assigning importance to the resulting trend. You now seem to have shifted your focus to 2002, but this all started with the curious choice of 1998. Trying to shift focus to 2002 looks to me like implicit acceptance by you that 1998 was not an appropriate start date for calculating a short-term trend. We have discussed OHC with you before, and readers will recall we agree with you and Hansen that OHC is an important metric (one of several), we have been very clear on this, so please don't try and suggest otherwise. SkepticalScience has numerous threads that speak to OHC and energy in the climate system. See here and here. But that is not what is at issue on this thread, so if you wish to discuss OHC please do so on the relevant thread or at our ongoing discussion about OHC here. Thank you. And Dikran's questions (and points) are actually very relevant to the topic of this thread and their implications are important, so I for one encourage you to look at the statistical power of your hypothesis tests for the stated time frames and to please let us know what you find. Thanks. -
Jonathon at 03:43 AM on 15 October 2011Continued Lower Atmosphere Warming
Instead of selecting an arbitrary timeframe, which lends itself to statistical errors, why not examine the moving average. This eliminates the subjective error in the analysis. Using HadCRU monthly values (other datasets produce similar numbers), the 120-month moving average was generally increasing over the following timeframes: 1896-1903, 1914-1946,1957-1967, and 1979-2008. During the other timeframes it was decreasing: 1887-1896, 1903-1914, 1946-1957, 1967-1979, and 2008-present. Since the moving average had been increasing since 1979, it is not surprising than any start date chosen for analysis since then would show a positive slope. The moving average has only been decreasing for three years, so only a short timeframe would show a temperature decrease. -
pielkesr at 03:32 AM on 15 October 2011Continued Lower Atmosphere Warming
dana1981 - You write "There are a lot of people who are looking for excuses not to take action on climate change, and they will gladly latch onto your "no warming since 1998" argument whilst ignoring your "we should focus on OHC" argument (Anthony Watts being one of them). Your strategy here gives the delayers the ammunition they need." Unfortunately, what you assume is a perspective of "climate change" that is a much narrower view than I and many of my colleagues have concluded. Moreover, you focus on "climate change" when the focus should be on "climate", including risks we face if past extreme events reoccur but with today's societal exposure. We discuss this approach in our paper Pielke Sr., R.A., R. Wilby, D. Niyogi, F. Hossain, K. Dairuku, J. Adegoke, G. Kallos, T. Seastedt, and K. Suding, 2011: Dealing with complexity and extreme events using a bottom-up, resource-based vulnerability perspective. AGU Monograph on Complexity and Extreme Events in Geosciences, in press. http://pielkeclimatesci.files.wordpress.com/2011/05/r-365.pdf Anthony Watts, and others, do not conclude there is no human role in the climate system, nor that we should not do things that are environmentally positive. You misstate this information. The disagreement, and I share this, is that the focus almost exclusively on added CO2 by itself, could prevent other important issues from being addressed. It also makes geoengineering, such as the dangerour idea of ejecting aerosols into the stratosphere, a proposed approach to mitigate the radiative effect of added CO2. This why the failure to accept a slowing down of the tropospheric warming, which seems so obvious to me, actually prevents a more constructive discussion with the so-called "skeptics". I suggest you, and others, hurt the environmental movement by focusing so heavily on just one environmental issue. -
WheelsOC at 03:30 AM on 15 October 2011Continued Lower Atmosphere Warming
Dr. Pielke, I'm reading your comments on Santer et al. and here to the best of my abilities but I haven't yet seen an explanation for your use of short time scales in response to a paper that was explicit in calling this approach wrong-headed for easily understood statistical reasons. If using >17 years is insufficient to draw conclusions about the agreement between models and observations, why do you think it's appropriate to do exactly that? I also don't see an explanation for your use of RSS over UAH data when Santer et al. used both (RSS happens to give a flat slope for the same time period that UAH gives a positive one), and your explanation of picking 1998 as the starting point in a type of analysis which is well known to be sensitive to end-point selection is also unsatisfactory, especially in light of the short-term variability creating noise that makes it difficult to tease out all but the strongest trends into statistical significance. Yes, 1998 as a start makes a "flat" trend, but any year prior and several years after 1998 produce a positive trend. Could it be that this apparently flat trend is entirely a relic of 1998's status as an unusually warm year, and therefore an illusory trend that's not worth bothering with? To me, these are the main points of contention here and you are apparently not addressing them. It's especially disheartening because these exact same methods (selective use of end points, short time scales, and focusing only on data that produce low or no trends) have been abused extensively by people who argue that there's no anthropogenic warming, something I know you disagree with. -
muoncounter at 03:26 AM on 15 October 2011There is no consensus
Jonathan, 'General agreement' was exactly how I defined consensus. You have added 'we all agree,' which requires unanimous consent - a goalpost shift if ever there was one. I doubt you will ever find that. -
pielkesr at 03:22 AM on 15 October 2011Continued Lower Atmosphere Warming
dana1981 You wrote "However, we all agree that global warming is not measured only by TLT and upper ocean data." It is measured by all the reservoirs of heat in the climate system and is in units of Joules. The dominate resevoir is the ocean. Do you agree with this? -
pielkesr at 03:21 AM on 15 October 2011Continued Lower Atmosphere Warming
Dikran Marsupial - Regarding #21, we will just have to disagree and move on. You are asking if the recent data alters a longer term trend significantly. I ageee; it does not. But what I am asking is if you took the data since 2002, does it show a trend that is significantly different than zero. To say the tropospheric heating has not been less in recent years, is like saying a car is still accelerating with the speedometer says it is at a nearly constant speed over the last few kilometers. But lets move to the next topic.
Prev 1439 1440 1441 1442 1443 1444 1445 1446 1447 1448 1449 1450 1451 1452 1453 1454 Next


