


 Arguments


Recent Comments
Prev 1440 1441 1442 1443 1444 1445 1446 1447 1448 1449 1450 1451 1452 1453 1454 1455 Next
Comments 72351 to 72400:
-
dana1981 at 03:13 AM on 15 October 2011Pielke Sr. and SkS Disagreements and Open Questions
Dr. Pielke:"to some, this does raise an issue with the claims of the dominance of the radiative effect of CO2 and a few other greenhouse gases in terms of climate change"
Those "some" are wrong, and thus we seek to explain why they are wrong. We are trying to "refute the use of the shorter term temperature trend data" because forming conclusions based on short-term data is inappropriate. Yes, we are trying to refute something that is incorrect, and will continue to do so. However, TLT discussions should move to the TLT thread, and we should be moving on to the OHC point #3 in this thread. See the second link in my comment #110 for the latest on point #3. -
Jsquared at 02:58 AM on 15 October 2011The Earth continues to build up heat
@JosHag Thanks. The Levitus 2000m time series at nodc.noaa.gov (mentioned in #7) doesn't have the error column. The file h22-w0-2000m.dat does (3rd column). And there are two of those graphs over at RealClimate - one wittout the error bars (mentioned in #7) and one with (mentioned in #24). -
dana1981 at 02:48 AM on 15 October 2011Continued Lower Atmosphere Warming
Dr. Pielke, you say"Since 2002, as shown in the lower tropospheric plot and in the upper ocean data, little of that heat has accumulated there. There is not enough melt of sea ice or glaciers to account for it there. "Global warming" has nearly stopped using these two metrics, irrepsective of the long term trend and whether it is due to natural variations or an incomplete understanding of human climate forcings."
However, we all agree that global warming is not measured only by TLT and upper ocean data."What one sees in the defense of SkS of the long term linear trend is an effort to explain away differences that occur whenever they (unexpectedly) appear. This may provide encouragement for the convinced but, I suspect, is making a large number of others (e.g. including policymakers) suspicious of the claims."
A main point of Santer et al. is that these short-term deviations from the long-term trend are not unexpected, and thus I strongly disgree with your characterization of our post. What I think makes policymakers suspicious are arguments like yours, when they are told that the lower atmosphere hasn't warmed since 1998 or 2002."My recommendation is, that instead of spending the effort to show that 2002 to 2011 (or 1999 to 2011) is too short of a time to necessarily see the linear trned, if it is there, that you focus on reporting on the observed data without a pre-chosen view that you are trying to defend."
Our "pre-chosen view" is simply that we must examine all available climate data, and not selectively omit certain pieces of it (like TLT temperatures prior to 2002 or 1998, or the entire UAH record, for example)."I agree with almost all of your comments about the issue with the use of short term trends. While it shows that lower tropospheric warming has essetially halted in the last few years (which we seem to agree on), it tells us nothing about the future, nor the reasons for the lack of warming. "
I would agree that the trend in the short-term, very noisy TLT data has slowed the past few years (though Dikran, who has much more statistics expertise than me, might smack me for saying so), but this is not an unexpected result (and I would go so far as to call it an expected result, given changes in ENSO, aerosols, and solar activity over that period), and certainly agree this tells us nothing about the future."Lets also agree, however, to focus on the actual best measure of global warming - the oceans."
On this we don't agree, and I think your pursuit of this goal is doing much more harm than good. In order to convince others that we should focus on OHC, you have also made this argument that TLT has not increased since 1998 or 2002. There are a lot of people who are looking for excuses not to take action on climate change, and they will gladly latch onto your "no warming since 1998" argument whilst ignoring your "we should focus on OHC" argument (Anthony Watts being one of them). Your strategy here gives the delayers the ammunition they need. As we have said many many times, OHC is a very important metric, but there should not be a single metric. We should examine all metrics, including OHC, TLT, surface temps, ice mass, etc. And as noted above, my main concern is providing ammunition for those who seek to undermine any and all action to address climate change, which is what your argument here does. I suggest you re-evaluate your messaging strategy, because it is currently doing more harm than good. -
MA Rodger at 02:47 AM on 15 October 2011Pielke Sr. and SkS Warming Estimates
@89 Pielke Sr listed forcings as being (i) direct radiative, (ii) indirect radiative & (iii) non-radiative giving examples of the second sort in the reference. I see no relevance in such distictions within the presented argument. AR4, NAP and Tom@37 all refer to changes in forcing (of whatever ilk). Where I lose the thread in @89 starts with the talk of "mixing" which I am not clear even whether to read as some philisophical or some climatical mixing. My confusion continues with the second from last sentence which appears to be missing some words and the final sentence is devoid of any mention of "immediate" forcing or the logic for a forcing not being a relative phenomenon. In all these replies, the nearest thing to an explanation is @42 where Pielke Sr states "ΔF is the change in forcing ... that does require a base year. The forcing does not and is instantaneous. One would never state that "acceleration requires a base time period." Acceleration is the derivative of the velocity at any time. Similarly, radiative forcing is at a specific time although one could time average (e.g. the yearly global averaged radiative forcing)." This is however muddled thinking. Acceleration represents a rate of change in velocity, velocity a rate of change in distance. Here we consider 'forcing' and 'change in forcing' not a rate of change. There must then surely be a datum to measure from. -
Alexandre at 02:38 AM on 15 October 2011Continued Lower Atmosphere Warming
muoncounter at 14:02 PM on 14 October, 2011 A smoker friend of mine is proud of kowing everything about quitting smoking: he says he has quit over 50 times... Likewise, global warming ends almost every other year... then it ends again. And again. -
Dikran Marsupial at 02:37 AM on 15 October 2011Continued Lower Atmosphere Warming
Prof. Pielke wrote "I agree with almost all of your comments about the issue with the use of short term trends. While it shows that lower tropospheric warming has essetially halted in the last few years (which we seem to agree on)" No, it shows nothing of the sort. The failure to reject the null hypothesis (flat trend) does not imply that the trend actually is flat, that is a classic misinterpretation of a statistical hypothesis test. If the the null hypothesis is not rejected, there are essentially two reasons why this can happen. The first is that the null hypothesis is correct. The second is that the period over which the trend is calculated is too short to reliably estimate a trend of the expected magnitude. To rule out the second possibility, you need to show that the test has sufficient statistical power to reliably reject the null hypothesis if it is false. You have yet to demonstrate this, and so you should not be claiming that "lower tropospheric warming has essetially halted in the last few years". So, I ask again, what is the statistical power of the test? -
Jonathon at 02:26 AM on 15 October 2011There is no consensus
Muon, See posts #475, #470, #456, and #454 for your answer. Remember, it was the other posts here at SKS who came up with claims, not myself. You would also be wise to learn that Webster defines consensus as "general agreement." If posters here are defining consensus as something else, then that would be reason for confusion. -
Eric (skeptic) at 02:21 AM on 15 October 2011Continued Lower Atmosphere Warming
Muoncounter, the real sidetrack is OHC. But regardless the unshakeable trend is 0.4 over 30 years (UAH). There's also a somewhat shakeable change in trend from 80's and 90's to the 00's although it's still clearly up. I would also note that 35 years places the starting point into the cooler 70's. -
pielkesr at 02:16 AM on 15 October 2011Continued Lower Atmosphere Warming
In terms of how we separately view the global warming issue, we clearly differ in a fundamental perspective. I have concluded that the appropriate way to monitor multi-year (multi-decadal) global annual-average warming (or cooling) is in terms of heat accumulation in Joules, which is by far dominated by the oceans. Even Jim Hansen has agreed with this view. Here is one example of its value. If, for example, a large volcanic eruption caused a large loss of Joules, the global warming "clock" would be reset. In contrast, the use of a linear trend would see this cooling as a short term blip and the positive linear trend would be retained until (and unless) the cooler heat content persisted long enough. I have used the muted (lack) heating in the troposphere since 2002 to reinforce that we need to focus on the ocean. I agree with almost all of your comments about the issue with the use of short term trends. While it shows that lower tropospheric warming has essetially halted in the last few years (which we seem to agree on), it tells us nothing about the future, nor the reasons for the lack of warming. However, by not focusing on the ocean heat content issues, including the reported heating in the deeper ocean including how it got there, you are missing an opportunity to reach out to those you call (perjoratively in my view although some like this label) "climate skeptics". Lets agree that it is a short term flattening in the lower tropospheric temperatures (since 2002) that we will all follow to see if it persists in the coming months and years. This short term trend does not tell us that the long term trend has been significantly changed (yet). Lets also agree, however, to focus on the actual best measure of global warming - the oceans. -
JosHagelaars at 02:01 AM on 15 October 2011The Earth continues to build up heat
@Jsquared You can find the original graph with the error bars from comment #3 on: http://www.realclimate.org/index.php/archives/2011/10/global-warming-and-ocean-heat-content/comment-page-3/#comment-216587 I don't think the graph is taken from an article but is probably build by Schmidt himself, he links in his comment to: ftp://ftp.nodc.noaa.gov/pub/data.nodc/woa/DATA_ANALYSIS/3M_HEAT_CONTENT/DATA/basin/yearly/ The monthly data are here: ftp://ftp.nodc.noaa.gov/pub/data.nodc/woa/DATA_ANALYSIS/3M_HEAT_CONTENT/DATA/basin/3month/ Also see my comment #7 -
muoncounter at 01:58 AM on 15 October 2011There is no consensus
Jonathan#478: Once again, this is not the thread for detailed sensitivity discussion. By disagreeing with 'claim number one,' are you suggesting that sensitivity is either 0 or negative? If so, you would do well to refer to a sensitivity thread. But you have created new goalposts in the other two of your three claims: 'we all agree.' There is no such specific language in the definition of consensus as 'general agreement.' This is similar to the artifice used by the petition project, which contrived this language: there is no convincing scientific evidence that human release of carbon dioxide will, in the forseeable future, cause catastrophic heating of the Earth's atmosphere" Such language as 'convincing,' 'forseeable,' and 'catastrophic' are non-scientific. And 'we all agree' is higher than most legal burdens of proof. -
muoncounter at 01:41 AM on 15 October 2011Continued Lower Atmosphere Warming
Eric#15: Volcanoes and ENSO each have their own threads; let's not get sidetracked here. If the natural cycles counter-argument is to be taken seriously, these factors must be quantitatively removed from the temperature record, as tamino did; we have repeatedly posted the resulting graph (above Figure 4). The result of that analysis is the familiar 35 year trend of 0.18 deg C per decade, which seems unshakeable at this point. -
jyyh at 01:23 AM on 15 October 2011Continued Lower Atmosphere Warming
#5 Skywatcher, selecting the years on shorter period trendlines so they begin when the solar cycle is rising to the max about 1/3 from the top (2-3 years before the actual maximum (sunspots)). Can't find the image now (possibly lost somewhere in Tamino archives), but that was the idea, to tease out the maximum effect of the sun in current conditions of GHGs. Needless to say, selecting the years the opposite way gives increasingly steepening trendlines. -
JMurphy at 00:53 AM on 15 October 2011Over 31,000 scientists signed the OISM Petition Project
Tristan wrote : "The IPCC AR4 WG1 report was written and reviewed by approximately 2000 scientists." - needs a link... I haven't counted all the names in Annexes II and III : Contributors and Reviewers of the IPCC WGI Fourth Assessment Report, but there can't be too far off 2000 names there, can there ? Anyone care to count...? -
Don9000 at 00:46 AM on 15 October 2011Continued Lower Atmosphere Warming
Prof. Pielke @10: I do not understand why you write with regard to Dana's piece that "It amazes me that with the diversity of human climate forcings, the newly recognized higher importance of solar forcing, of internal variations and other effects, that you persist in assuming that the slow forcing of added CO2 will dominate if we integrate over enough years. Perhaps you are right, but you will not be convincing unless, in my view, you adopt a different tact." Dana's key opening point was that skeptics are and have been using short runs of temperature data to claim that global warming has stopped or reversed. This point was illustrated by Dana and others who posted graphs illustrating just how easy it is to select a short run of years and show that for those short stretches of time the trend is negative, while over a slightly longer time frame the trend is positive. As brief trends are often reversed in the wider trend once a statistically suitable longer span of years is considered (17 years, according to Santer et al (2011), being the minimum required for statistical significance), and once we look at such a span of recent years the global temperature is seen to be rising, it seems to me your attempt to argue that short term trends are of more interest than the overall longer-term trend is flawed. Incidentally, the word you should have used in calling for Dana to change his course of inquiry is "tack" and not "tact": "tack" is a nautical term which has to do with a vessel's course or direction of movement and is of particular importance to sailing ships. A sailing ship crossing the Atlantic, for example, might tack many dozens of times in order to maximize its use of wind energy or to avoid storms and areas of calm winds. When plotted on a map, individual tacks (the term can describe the run of the ship along a particular short-term course) may well make it appear that a ship heading from Liverpool to New York is heading for either Greenland or South America or even at times back toward Europe, but extended over time the various tacks produce a directional trend that causes the ship to arrive at its intended destination. Metaphorically, it seems to me that you are trying to argue that an individual "tack" takes precedence over the overall course and that we do not know which overall course the global temperature is on. -
Jonathon at 00:33 AM on 15 October 2011There is no consensus
Sphaerica, You are a little late to the party, so I will bring you up to date. 1. The claim has been made here that since atmospheric CO2 leads to increasing temperature that there is a consensus on climate sensitivity, and it is positive. 2. The claim has also been made that the actual range which makes up the climate sensitivity is irrelevant, as long as we all agree on the endpoints of that range. 3. The final claim is that we all agree on that range. I disagree with all three claims. The first two claims are simply ridiculous, as they have no real meaning. It is not enough to know that X influences Y, but we need to know how much X influence Y, and if the influence of X on Y is unlimited, then do we really know anything about X and Y? The third claim is the only one with any real meaning. It is not sufficient for a small group to agree on a range if others do not, and calling Link, Spencer, Pagani, and Hansen "fringe scientists" does not add to your credibility. If you wish to add anything further, I suggest you tone down your attitude and try to become scientific in this discussion.Response:[DB] "If you wish to add anything further, I suggest you tone down your attitude and try to become scientific in this discussion."
Good advice; please embody it yourself so others may emulate your positive example.
-
Eric (skeptic) at 23:57 PM on 14 October 2011Continued Lower Atmosphere Warming
Muoncounter, you ask: "Where are those explanations in more depth than 'it's a natural cycle'?" There are two effects from natural cycles. First is ocean-atmosphere exchange, second is radiative balance changes from volcanoes, ENSO-induced clouds, etc. The most in-depth explanation would consider both simultaneously and show heat accumulating at varying rates. The rate, generally speaking, was higher in the 80's and 90's and lower but still positive in the past decade. -
Dikran Marsupial at 23:46 PM on 14 October 2011Continued Lower Atmosphere Warming
Prof. Pielke wrote: "I assume you mean pre-2002 and 2002-2011. What is it?" Yes, that appeared to be your third hypothesis, the 2002 breakpoint was inferred from the reference to the other two hypotheses. Have you tested your third hypothesis to see whether it has statistically significant support from the data? -
muoncounter at 23:45 PM on 14 October 2011Continued Lower Atmosphere Warming
pielkesr#10: "one sees in the defense of SkS of the long term linear trend is an effort to explain away differences that occur whenever they (unexpectedly) appear. " This philosophical argument cuts both ways. As warming continues, those who say 'warming stopped in ___ ' are also left to explain those differences. Where are those explanations in more depth than 'its a natural cycle'? "instead of spending the effort to show that 2002 to 2011 (or 1999 to 2011) is too short of a time to necessarily see the linear trned, if it is there, that you focus on reporting on the observed data without a pre-chosen view" Again, a question that must be asked on both sides. How is using the entire satellite dataset a pre-chosen view? How is choosing an arbitrary short time period not a pre-chosen view? What I find missing here is internal logical consistency. If trends from 5 year periods are considered significant, then any 5 year period is as good as any other -- and that must include the most recent. As far as effort is concerned, it is far more effort to explain these short period variations than to address the significance of the long term trend. -
Robert Murphy at 23:39 PM on 14 October 2011Continued Lower Atmosphere Warming
One way to look at the temperature record is to look at how adding the years after 1998 affects the long term linear trends. I made a graph from WoodForTrees of the 4 main data sets, starting in 1979 (so I could use the entire satellite record), and comparing the trends from 1979 thru the end of 1998 with 1979 thru the present (I made the graph about a month ago so it isn't updated for the most recent months). For GISS and UAH, the trend actually got a little larger when the last 13 years are added; the trend just barely decreased for RSS and HadCrut. Overall it doesn't look like adding the "flat" years made much of an impact on the long term trend, which you would think would be the case if the warming ended in 1998.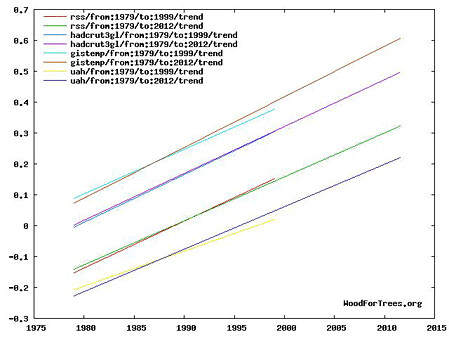
-
pielkesr at 23:32 PM on 14 October 2011Pielke Sr. and SkS Disagreements and Open Questions
JMurphy - You write "But who do you (Dr Pielke) believe is doing the misleading" I do not subscribe to the thesis that anyone is deliberating misleading. Everyone I know on all sides of this issue are sincere in their views. This, of course, does not make them correct, but I suggest starting with that respect will go along way to determining what is agreed to and what is not agreed. Then find mutually agreed to ways to resolve the disagrements, or at least to clearly articulate them. I know SkS's goal is to do this. However, in my experience on SkS, as one example, you are seeking to refute the use of the shorter term temperature trend data, rather than accepting that to some, this does raise an issue with the claims of the dominance of the radiative effect of CO2 and a few other greenhouse gases in terms of climate change. -
pielkesr at 23:26 PM on 14 October 2011Pielke Sr. and SkS Disagreements and Open Questions
Tom Curtis - If I look at the RSS MSU plot since 2002, it looks flat over the period 2002-2011. I do not know what it will be in 2012 and 2013. What is your expectation for the next, say, 5 years? -
pielkesr at 23:20 PM on 14 October 2011Continued Lower Atmosphere Warming
Dikran Marsupial My question is: Is the difference in the trend prior to 2002 and post-2002 statistically significant at the usual 95% level of significance? I assume you mean pre-2002 and 2002-2011. What is it? -
pielkesr at 23:18 PM on 14 October 2011Continued Lower Atmosphere Warming
dana1981 - In your analysis you miss, in my view, a fundamental issue. Jim Hansen has written "The Willis et al. measured heat storage of 0.62 W/m2 refers to the decadal mean for the upper 750 m of the ocean. Our simulated 1993-2003 heat storage rate was 0.6 W/m2 in the upper 750 m of the ocean. The decadal mean planetary energy imbalance, 0.75 W/m2, includes heat storage in the deeper ocean and energy used to melt ice and warm the air and land. 0.85 W/m2 is the imbalance at the end of the decade. Certainly the energy imbalance is less in earlier years, even negative, especially in years following large volcanic eruptions. Our analysis focused on the past decade because: (1) this is the period when it was predicted that, in the absence of a large volcanic eruption, the increasing greenhouse effect would cause the planetary energy imbalance and ocean heat storage to rise above the level of natural variability (Hansen et al., 1997), and (2) improved ocean temperature measurements and precise satellite altimetry yield an uncertainty in the ocean heat storage, ~15% of the observed value, smaller than that of earlier times when unsampled regions of the ocean created larger uncertainty." [http://pielkeclimatesci.files.wordpress.com/2009/09/1116592hansen.pdf] A rate of heating of 0.85 Watts per meter squared corresponds to 1.38 x 10^22 Joules per year. This a metric than can be evaluated on a yearly basis (with uncertainties) and tracked with time. Since 2002, as shown in the lower tropospheric plot and in the upper ocean data, little of that heat has accumulated there. There is not enough melt of sea ice or glaciers to account for it there. "Global warming" has nearly stopped using these two metrics, irrepsective of the long term trend and whether it is due to natural variations or an incomplete understanding of human climate forcings. The only remaining two options are the deep ocean and/or out into space. We should be focusing on this issue instead of how long a data set is needed to ferret out a slow linear trend. One other comment; you report "Tamino has also previously performed a multiple regression of temperature on various short-term effects, including the Multivariate ENSO Index (MEI), and confirms that TLT data are much more sensitive to ENSO than surface temperature data". However, as reported in CCSP 1.1, the surface and lower tropospheric temperature trends are supposed to be closely linked in terms of trends. [ http://www.climatescience.gov/Library/sap/sap1-1/finalreport/default.htm]. What one sees in the defense of SkS of the long term linear trend is an effort to explain away differences that occur whenever they (unexpectedly) appear. This may provide encouragement for the convinced but, I suspect, is making a large number of others (e.g. including policymakers) suspicious of the claims. Examples of the unanticipated (as illustrated by Jim Hansen's statement) include reported deep ocean heating as a source of the "missing heat", the disparity between trends in the lower troposphere and the oceans, and need to adjust the data to account for ENSO, etc. And yes, the absence of much of a trend since 2002 fits into the conclusion that the linear trend oversimplifies the actual behavior of the climate system. My recommendation is, that instead of spending the effort to show that 2002 to 2011 (or 1999 to 2011) is too short of a time to necessarily see the linear trned, if it is there, that you focus on reporting on the observed data without a pre-chosen view that you are trying to defend. It amazes me that with the diversity of human climate forcings, the newly recognized higher importance of solar forcing, of internal variations and other effects, that you persist in assuming that the slow forcing of added CO2 will dominate if we integrate over enough years. Perhaps you are right, but you will not be convincing unless, in my view, you adopt a different tact. That tact, I suggest, is to focus that too large of an increase of the atmospheric concentration of CO2 as unknown as we do not know its consequences in terms of biogeochemistry. A prudent behavoir would be to encourage limiting how much we put into the atmosphere. As an associated effect, its positive radiative forcing would be less. -
Bob Lacatena at 23:17 PM on 14 October 2011There is no consensus
475, Jonathan, Your entire rant is simply muddying the waters of what a definition of consensus might mean. As has already been explained and discussed, science doesn't really ever bother with defining and delineating a consensus. The consensus simply is. It is whatever most people in the field understand and agree with. There are always some who agree with X but disagree with Y, or vice versa. There's always a Z that's so basic and given that everyone but crackpots agree with it, and a W that's so far out of the mainstream that no one takes it seriously. The point is that there is no structure. Scientists don't get together once a year at the annual consensus convention and vote on which parts of science will or will not be considered accepted. Scientists get up in the morning. They go to work. They study, research, think and publish, and read each other's papers. Over time, like a hive mind, a social network of understanding evolves. What you are doing with the range of climate sensitivities is to muddle that, by taking the simple idea that every scientist has what he believes is a likely range of sensitivities, and instead conjuring a world where each scientist picks a specific number, and then claiming that because there are so many different numbers, there cannot be a consensus. This is all typical denier nonsense, intended to confuse people and sew doubt. The bulk of scientists know what the likely range of sensitivities is. A small group of fringe scientists expect sensitivities outside of that range. This does not mean that scientists are at all confused on the issue (which is what you ultimately are trying to imply with your own personal redefinition and portrayal of a consensus). -
CBDunkerson at 22:55 PM on 14 October 2011Climate 'Skeptics' are like Galileo
saltspringson wrote: "So, suppression of some scientists by other scientists is OK?" Yes. Quacks who claim that HIV does not cause AIDS (ditto smoking and asbestos not causing cancer), 'scientific' advocates of 'racial purity', homeopathic 'medicine' practitioners, and other such dangerous frauds absolutely should be 'suppressed'. 'Scientists' who endanger lives by spreading blatantly false claims to the general public need to be stopped. -
Dikran Marsupial at 22:52 PM on 14 October 2011There is no consensus
Jonathon I note that you have not addressed either of my comments. However, the consensus view is not that the plausible range is all positive values, if you want to see what the range of plausible values is then lets discuss it on the thread devoted to that issue i.e. How sensitive is our climate?. There you can find peer-reviewed research on the plausible ranges according to different methods. Your argument is essentially a straw man, I don't particularly see any point in arguing about it either, but if you change your mind, please take it to a more appropriate thread. -
Jonathon at 22:45 PM on 14 October 2011There is no consensus
Dikran, The argument that everyone is in agreement, because we all think that the value is positive, is nice, but does not tell us much. If that is the extent of the consensus, then we should just drop it altogether. Since no one wishes to go beyond that issue, there is really no point arguing any further. -
Dikran Marsupial at 22:38 PM on 14 October 2011There is no consensus
Bibliovermis, 3 is on the high side of 3, but only for large values of 3 ;o) -
Jonathon at 22:37 PM on 14 October 2011There is no consensus
Biblio. That is for equilibrium climate sensitivity. I though you were talking abobut transient sensitivity, which the first article states as 1-3, while the second says 1.3-2.6. In either case, 3 is on the high side for transient sensitivity. Please read more carefully. -
Sudden_Disillusion at 22:35 PM on 14 October 2011Climate 'Skeptics' are like Galileo
@saltspringson 1. you really think the whole thing is a big conspiracy theory of tens of thousands of scientists around the world trying to suppress a couple of poor little fellas who own THE TRUTH? What do you think is more likely: AGW or your so-called "suppression"? 2. Sorry again: all of the evidence for AGW relies not on computer models but on, yeah right, observations in a vast array of different proxies. Regarding the Trenberth paper: you are just cherry-picking. This paper only shows that we do not understand everyhing yet. It does not prove your point at all. Classic denial behaviour. 3. And again a big sorry: CO2 = GHG, GHGs warm the atmosphere. Humans blast >5Gt CO2/yr into the atmosphere (CO2 stays there for like hundreds of years meaning we accumulate CO2 there). The-se are facts. It does not mean we are solely responsible for GW but we massively add to it. The only thing we don't know is how bad it's gonna be. 4. Why should Mann be dragged into court exactly? For saying what is instead of cherry-picking or misinterpretating data? Besides all your arguments are missing the most important point: It is not rational to disturb a highly complex and functioning (i.e. life-supporting) system (Earth's climate) as we do on a large scale be-cause if you do there will be consequences but you don't know what they are and how big their impact will be. Basically, you do not conduct an experiment on a global scale of which you do not know the outcome. Case closed tbh -
JMurphy at 22:34 PM on 14 October 2011Pielke Sr. and SkS Disagreements and Open Questions
peilkesr wrote : "Policymakers, in my view, are being misled into believing that the climate should more-or-less monotonically warm when in reality both natural variability and the diversity of human climate forcings makes the issue of climate system heat content much more complex." Some examples have already been given as to the sort of people who are indeed trying to mislead policymakers (one of whom has recently actually published details for the picketing of a climate scientist; the other of whom has his own myth-making on this topic exposed and rebutted on SkS); and Albatross on another thread has given plenty of examples of SkS trying to make sure policy makers are indeed properly informed - another link here. In fact, the person who hosts the site at the first link I have given, has plenty of posts about cold, snow, everything-but-CO2-affects-the-climate, everything-is-going-to-be-OK-really, etc., but very little about heat records or explanations as to how temperatures do not rise monotonically - in fact, a recent post ("Breaking: A peer reviewed admission that “global surface temperatures did not rise between 1998 and 2008″ – Dr David Whitehouse on the PNAS paper Kaufmann et al. (2011)" - given over to a post by those 'unbiased' chaps at the GWPF) seemed designed specifically to mislead, and none of the commenters there were informed by the blog owner (who does regularly reply to those he believes are misinformed) that their comments were misleading, etc. But who do you (Dr Pielke) believe is doing the misleading ? -
Bibliovermis at 22:33 PM on 14 October 2011There is no consensus
The article you posted states that the most likely climate sensitivity is 3 deg C. How is 3 on the high side of 3? -
Jsquared at 22:33 PM on 14 October 2011The Earth continues to build up heat
About the graph at #3: the corresponding graph at RealClimate doesn't have the error bars (+ or - 1 sigma dotted lines). I think they are crucial to the figure: the data show that 0-2000m contains less heat than 0-700m from 1955-1975. I don't think that's possible, so it has to be noise in the measurements. The problem appears to go away when you look at the error bars. That makes it ewen more immportant to have the original source for that figure. -
Dikran Marsupial at 22:31 PM on 14 October 2011There is no consensus
Jonathan wrote: "The disagreement is about what is that range," as far as I can see you have provided no evidence that there is substantial disagreement regarding the range of plausible values, just that there are point estimates that are not in close agreement.. "and is it narrow enough to constitute a consensus." The spread of the range of plausible values has no bearing whatsoever on whether there can be a concensus on what the range actually is. If we had some dimensionless quantity that physics constrained to be strictly positive, but otherwise we knew nothing about it, then it would be perfectly reasonable for the concensus to be that the plausible range were from 0 to +infinity. -
banana at 22:27 PM on 14 October 2011Continued Lower Atmosphere Warming
Firstly, thanks for a well-written and informative post. Would it be possible to add uncertainties to the measured trends (e.g. 0.18C since 1999)? Presumably they are quite large for such short time-periods, and this would help emphasise how they are not particularly useful. Significance tests would serve the same purpose. I'm also interested in what sort of studies have been done regarding the linearity/non-linearity of various aspects of the climate system. Any references would be greatly appreciated - sorry if this request is too vague. -
Jonathon at 22:22 PM on 14 October 2011There is no consensus
Sky, We already answered that on the other thread - yes. The discussion here is about whether we can say that there is a consensus among scientists as to the sensitivity of the temperature to CO2. We have already agreed that exact value in unknown, and that there is a plausible range of values. The disagreement is about what is that range, and is it narrow enough to constitute a consensus. Your range for the Hubble is much narrower, and not being a cosmologist, I cannot appropriately answer your question. Biblio, If we are talking about short-term transient sensitivity, then the plausible values are much lower, and Hansen's value of 3 is still on the high side. The following might help clear this up for you. http://profmandia.wordpress.com/2011/01/18/clearing-up-the-confusion-about-climate-sensitivity/ http://journals.ametsoc.org/doi/abs/10.1175/2011JCLI3989.1 -
Eric (skeptic) at 22:09 PM on 14 October 2011Pielke Sr. and SkS Warming Estimates
Re #88, in #40 Dr. Pielke said: In fact, you are inappropriate mixing a "forcing" from a "change in forcing over some time period". A forcing (such as produces an acceleration, is immediate). He explained earlier in the post that some forcings are radiative and some are not, giving an example from the NAP book http://www.nap.edu/openbook.php?record_id=11175&page=40 In the post he was replying to, #37, Tom Curtis quoted from the AR4 glossary that a forcing is a change in net irradiance "due to a change in an external driver of climate change" such as a CO2 change or TSI change. IMO the only confusion is between the direct forcings of AR4 and the indirect forcings from NAP. But in both cases (and Tom's 37) they are referring to a change in forcing, not the forcing itself (so no inappropriate mixing was done). Nonetheless I did not those particular indirect forcings addressed in any subsequent posts (the ones from the NAP book I linked above) although MA Rodgers also asked about them. It seems appropriate to ask for the direct forcings and the radiative imbalance of direct and indirect forcings as distinct questions. -
chriskoz at 21:08 PM on 14 October 2011Continued Lower Atmosphere Warming
DK @6, It's obvious by just looking at the couple of graphs above that nul hipothesis to Pielke's conclusion passes easily here. Santer et al. (2011) have proved it; no need to repeat. Certainly, dr. Pielke seems to disregard statistical methods while formulating his conclusions. Further, by cherry-picking the weather data that is likely to support skeptic opinion and ignoring the other aspects of the warming globe, (i.e. ocean heat, discussed here); he shows a biased attitude. We know many examples of such cherry-picking by many "skeptics". The most prominent one being Chris Monckton, who not so long ago (as lately as April 2011 in Australia) boasted that "Arctic is steadily gaining ice" showning the ice extent data for years 2007-2009 as the "proof". We all know now that Monckton was not only cherry-picker but a [-snipped-] because he didn't even show the 2010 data (available to him at the time) as that data would disprove his claim. Now, when the 2011 ice data equalled the record low of 2007, no one listens to Monckton's [-snipped-] anymore. It's easy to rebut Monckton (his arrogance also works against him), Pielke is more subtle but still uses the same cherry-picking methods. -
MA Rodger at 20:57 PM on 14 October 2011Pielke Sr. and SkS Warming Estimates
Did we ever get to the bottom of Pielke Sr's interpretation of Forcing @40? I.e. "A forcing is ... immediate" and different from "a change in forcing over some time period" Immediate or not, a force is still a change from before to after. I did wonder if Pielke Sr was talking of some measure of residual forcing (radiative imbalance) when asking for the forcing for 2011 but @8 he asks for the 2011 forcing and radiative imbalance as well. So I am at a loss at what he is blethering on about. Is there some refined climataligical definition of 'forcing' that I am misinterpreting or is this our pet sceptical professor of climatology making yet another 'simple mistake on a fact you would expect him to know well'.? -
atcook27 at 19:15 PM on 14 October 2011The Earth continues to build up heat
Thanks Rob, I look forward to seeing what you have to say. p.s. I don't think that it's coincidental that the recent extremes in weather we're seeing have occured since the precipitous decline in the arctic sea ice in 2007. -
Rob Painting at 18:59 PM on 14 October 2011The Earth continues to build up heat
atcook27 - I have assumed until now that the oceans were largely being warmed by the heat in the atmosphere. I don't think you're alone in that regard. Quite conveniently I have a post on that topic coming up in a couple of days time. It's the sun that warms the ocean, but greenhouse gases regulate the amount of heat they retain. The post should be published on Sunday. -
atcook27 at 18:37 PM on 14 October 2011The Earth continues to build up heat
I have assumed until now that the oceans were largely being warmed by the heat in the atmosphere. I believe that this graph points to a different conclusion. It would seem that the energy increase in the ocean is much larger in scale than that of the atmosphere. If you take into account that water is much harder to warm than air, it would seem impossible that the atmospheric warming alone has been responsible for the oceanic warming. So where is the energy to warm the oceans coming from? There is only one major source....the melting of the arctic sea ice. I believe that the albedo effect has been grossly underestimated. If this is the case then we are in a heap of trouble as the magnitude of this effect is set to double over the next decade as the arctic eventually becomes ice free in the northern summer. -
Rob Painting at 18:24 PM on 14 October 2011The Earth continues to build up heat
Michael Hauber - "Although squinting at the colours with my partially colour blind eyes, it looks like the strongest heat gain is in the Atlantic?" Heat from the Indian Ocean is leaking into the Atlantic. See: What caused the significant increase in Atlantic Ocean heat content since the mid‐20th century? - Lee (2011) Not the 700-2000 mtr layer though. It'd be really nice, to see a review paper putting all this into context. -
Ari Jokimäki at 16:52 PM on 14 October 2011Pielke Sr. and SkS Warming Estimates
I'll just note couple of papers regarding the carbon dioxide - water vapor overlap issue: Pielkesr: "It is my specific question that an answer is needed for "What would be the global annual average radiative forcing change since pre-industrial with CO2 without the water vapor overlap and with the the overlap?" I doubt you could find it in a literature search because to my knowledge, it has not been done." There is a classic paper by Kiehl & Trenberth (1997), which seems to address this question at least in some form: "It is also important to note that different gases can absorb radiation at the same wavelengths; this is called the overlap effect." Then, later in the paper: "Of this 125 W m-2 clear sky greenhouse effect, we can ask, what is the relative contribution of each atmospheric absorber? A detailed answer to this question is complicated by the overlap among individual gaseous absorption features. We calculate the longwave radiative forcing of a given gas by sequentially removing atmospheric absorbers from the radiation model. We perform these calculations for clear and cloudy sky conditions to illustrate the role of clouds to a given absorber for the total radiative forcing. Table 3 lists the individual contribution of each absorber to the total clear sky radiative forcing." Table 3 then gives for each included gas the individual and combined effects for both clear and cloudy sky. For carbon dioxide individual clear sky radioative forcing is 29 watts per square meter and combined (with overlap effects) forcing is 32 watts per square meter. There is also separate row for "Overlap H2O–CO2". Another paper apparently addressing this issue is Cess et al. (1993). However, I I only have seen the abstract, so I'm not sure how complete analysis this paper has. I just noticed that Google Scholar returns this sentence for this paper: "Fig. 3. (A) Scatter plot of LW clear (clear sky) radiative forcing, as generated by the GCMs, with and without overlap of the C02 absorption bands by water vapor absorption." So it seems that it might be interesting in this sense. If needed I can dig up more references as there seems to be plenty of research done on this overlap issue. -
scaddenp at 15:33 PM on 14 October 2011Continued Lower Atmosphere Warming
skywatcher - I believe that graph was a Dr Inferno masterpiece at DenialDepot. -
Dikran Marsupial at 14:51 PM on 14 October 2011Pielke Sr. and SkS Disagreements and Open Questions
Prof Pielke wrote: "Dikran Marsupial - I had three hypotheses. I request you complete the test and see what you obtain." I do not dispute the fact that your first two hypotheses are entirely true, however, as I pointed out neither of these facts are at all surprising because the timescale over which the trends are calculated are too short for us to reasonably expect to be able to reject the null hypothesis even if it is false. Thus the test, and therefore the hypothesis, is essentially meaningless. Statistical power is often neglected by working scientists, however if you want to claim that a failure to reject the null hypothesis is of any interest, you need to show that the statistical power of the test is sufficiently high that the failure to reject a false null hypotheis would be unusual were it false. You have so far failed to do so. So I ask again, what is the statistical power of the test? I will discuss your third hypothesis on the new blog article, as dana requests, you can find my post here. -
Dikran Marsupial at 14:47 PM on 14 October 2011Continued Lower Atmosphere Warming
Prof. Pielke Your third hypothesis is that "the trends during this time period [2002-present] are different than the trends earlier in the time period." My question is: Is the difference in the trend prior to 2002 and post-2002 statistically significant at the usual 95% level of significance? -
Glenn Tamblyn at 14:31 PM on 14 October 2011The Earth continues to build up heat
Several comments about the graph supplied by Albatross from RC. It would be interesting to know the basis of how the 7000-2000 data was estimated pre-Argo Looking at when the 700 & 2000 lines diverge around 2003, really this is when the Argo data started to become available. So this may be simply joining to disparate data sets together. But the really interesting period is 2007-2010. That divergence looks real. And during a Solar minimum at that. And that huge climb around 2000-2001! Could that be the energy transferred during the 1998 El Nino supressed the value a year or so earlier then it recovered? We really, REALLY need to see a paper on this! I wonder how many skeptics will look on this as a very big nail in the coffin of the 'it hasn't warmed since 1998' meme? -
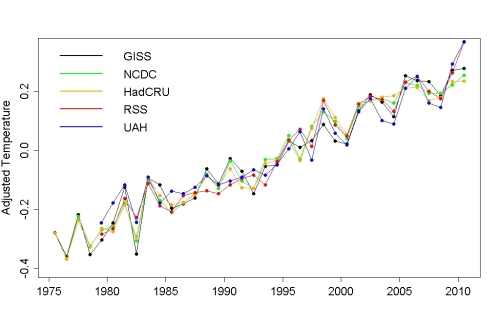
skywatcher at 14:25 PM on 14 October 2011Continued Lower Atmosphere Warming
The 'pick an arbitrary short period' game can be extended. Look at the following graph of UAH data. Shown are the long-term trend, plus four arbitrarily-chosen non-overlapping but contiguous subdivisions of the whole dataset. (I saw a great graph of this done for the entire GISS dataset once.) All the short trends are negative, yet how is it that the long-term trend is still rising?
I note once more that we are above the long-term trend for UAH at present, and close to it on other measures. Why would we think global warming has stopped?
All the short trends are negative, yet how is it that the long-term trend is still rising?
I note once more that we are above the long-term trend for UAH at present, and close to it on other measures. Why would we think global warming has stopped?
Prev 1440 1441 1442 1443 1444 1445 1446 1447 1448 1449 1450 1451 1452 1453 1454 1455 Next


