


 Arguments


Recent Comments
Prev 1443 1444 1445 1446 1447 1448 1449 1450 1451 1452 1453 1454 1455 1456 1457 1458 Next
Comments 72501 to 72550:
-
John Hartz at 06:01 AM on 1 November 2011Extreme Melting on Greenland Ice Sheet, Reports CCNY Team
@mspelto #2: Thanks for the reference and link. Here's the summary of that study. "An international team of scientists has discovered that warming in the Arctic region has triggered the accelerated melting of a Greenlandic glacier. Presented in The Cryosphere journal, the findings reveal that the overall mass loss of the Mittivakkat Glacier for 2011 has amounted to 2.45 metres, 0.29 metres higher than what was recorded in 2010. The study was funded in part by the INTERACT ('International network for terrestrial research and monitoring in the Arctic') project, which has clinched EUR 7.3 million under Research Infrastructures of the EU's Seventh Framework Programme (FP7)." -
Mercury Scientist at 04:50 AM on 1 November 2011Richard Milne separates skepticism from denial
@ Shibui, #8: Journals have expenses, and they have to at least break even on their expenses. They recover costs via subscriptions, including library subscriptions. This makes it inconvenient, but not impossible, for a non-subscriber to get content. Some suggestions: (1) Request the item from your library. They either subscribe, or can get a pdf of a paper through interlibrary loan. (2) Email the corresponding author, and ask for a copy. (3) Lastly, for authors, many journals have an option to pay for Open Access (sometimes called Author Choice); you pay the fee, and your paper will be freely accessible to the public via the web. Since your study was likely paid for by public funds, it's nice to use some of those funds to make your paper accessible by all. This is a good way for journals to recover some costs of delivering content in this digital age. -
Rickoxo at 04:45 AM on 1 November 2011It hasn't warmed since 1998
Thanks a ton for the response and great info. I was hoping wood for trees was a useful site, but, I get the danger of cherry picking beginning and ending dates to find what you want to find. When I entered 1998 as the start date at wood for trees and used the same settings as for their example data, there was a clear positive slope. You have to hunt around to find a cluster that doesn't slope. I also get [DB]'s comment about a very short period of time not indicating anything about the longer term trend, and Curry makes that exact comment as well. But Tamino sure goes off on her and presents some pretty compelling analysis saying she was way off base in her critique of Muller. It is pretty odd, however, that Muller was wrong about his own data. I don't know Tamino, but when two of the folks who did the data set both say the same thing, it seems odd that they're both wrong. My last thought, I read through Tamino's post and all the comments. A number of folks offered that what she said was "technically accurate" (i.e. there's no scientific evidence than global warming hasn't stopped", but that her statement is meaningless. But at least from what I read, she said she made that comment to shut up Muller who she said made some comments saying the BEST data set proved AGW was true and that skeptics were totally wrong. I get reminded occasionally by my advisors about the limits of what the data I'm analyzing says and what I can and can't claim about it. If one takes her comment as chastising Muller for over-speaking, it doesn't have the connotation Tamino goes after and then, all of Tamino's analysis ends up demonstrating her exact point which is that small of a period cannot be used to prove anything. It was late when I read through her blog so I don't remember what she said she was responding to from Muller, but that's what I remember her saying started this whole thing, some statement from him she said was way overblown, so she wanted to restate it technically accurately and say let the data speak for itself. -
Tom Curtis at 04:37 AM on 1 November 2011Climate's changed before
Sphaerica @245, thanks for the correction of my typo, and the summation. Your point (2), however, though perfectly valid, is not in my original post. In essence, it is known that increased aerosol numbers increases cloudiness by increasing the duration of clouds. If clouds take longer to dissipate, but form at the same rate, the net result will be more clouds in the sky at any give time - and hence less sunlight hours. Conversely, if aerosols are reduced, as happened in the UK after the passage of clean air acts in the 1970's, clouds will dissipate quicker, resulting in less cloudiness, and more sunlight hours. If this phenomenon is a major driver of changes in sunlight hours, that would explain why sunlight hours have increased in the UK (with reduced aerosol emissions) but decreased in China (which has increasing aerosol emissions). Of course, if that is the major driver, than this is a subject climate scientists are actively studying very closely. It is know as the Cloud Life Time effect, and is one of several indirect aerosol effects. -
mspelto at 04:21 AM on 1 November 2011Extreme Melting on Greenland Ice Sheet, Reports CCNY Team
This was also the case observed on the east coast of Greenland by Mernild and Hanna. -
Bob Lacatena at 04:10 AM on 1 November 2011Climate's changed before
242, lancelot, To clarify/summarize Tom's points: 1) How do you know the change is not a result of GHG warming (i.e. one form of positive cloud feedback) rather than the cause? 2) How do you know the change does not have to do with decreased aerosols (due to less pollution or changed atmospheric patterns)? 3) How do you know that a single regional effect is global? To answer your direct question: scientists do measure the albedo of the earth (which is sort of the exact opposite of sunlight hours) in a variety of ways. I'm not sure if anyone has tried to globally measure sunlight with ground based stations, but you can see that this effort would no doubt suffer from the same issues that "plague" ground based temperature observations ("the Urban Smog Effect is artificially reducing solar irradiance measurements! It's all a farce!"). I don't know if the spat of lost (or warehoused!) satellites would have helped here, either. But it's not like scientists are stupid, or aren't trying. -
CBDunkerson at 04:02 AM on 1 November 2011Climate's changed before
Ok, following on from the data Tom cited I found that this is based on something called a 'Campbell-Stokes recorder' which basically focuses sunshine to burn holes through a card. There is some subjectivity in determining whether a hole was burned through by 15 minutes or 30 minutes of bright sunshine, but overall it is a measure of sunlight reaching the ground at that location. Thus, a reduction in smog could result in an increase in sunlight hours... as could local changes in cloud cover. I'm not sure this measurement can really tell us much about global temperatures... even if an extensive network exists. It only has two 'intensity levels' for sunlight... either there is enough to burn through the card or there is not. Yet the 'not' could be anything from complete blackness to just barely not enough while the 'enough' could be anything from just barely enough to two, three, four, et cetera times as much as needed. Basically, I'm saying that the 'resolution' of the data doesn't seem sufficient to make any determination of the total sunlight experienced. -
CBDunkerson at 03:42 AM on 1 November 2011SkS Weekly Digest #22
Muller is getting an object lesson on the old saying about lying down with dogs. Even a brief skim of their sites should have been enough to demonstrate that Watts and (to a lesser extent) Curry are bad jokes, rather than 'heroes'. He either didn't look or didn't care... and now he's paying the price. He angered many in the scientific community by repeating denier fiction... and now he has alienated the denier community by repeating scientific facts. -
Tom Curtis at 03:39 AM on 1 November 2011Climate's changed before
lancelot @242, it is true that sunshine hours have increased by about 7% in the UK over the period from 1974 to the present: It is certainly not clear that this is a forcing, ie, an phenomenon independent to temperature which drives temperature change, rather than a feedback, ie, a phenomenon largely controlled by temperature which in turn drives temperature change.
More importantly, it is far from clear that this is a global phenomenon. Certainly in China the trend has been in the opposite direction towards less sunlight hours. A similar reduction of sunshine has been found in Switzerland, so the observed increase in the UK is not even a Europe wide phenomenon, let alone a world wide phenomenon.
That the trends are opposite in different locations around the globe strongly suggests the cause is not astronomical (GCR) but rather global or regional climate conditions. That is, the phenomenon is likely a climate feedback or a response to major oceanic variations. Certainly the UK data shows a correlation to the Atlantic Multi-decadal Oscillation. But the AMO may itself just be an artifact of the pattern or Northern Hemisphere warming and cooling due to variations in CO2 and aerosol levels during the 20th century.
Moderator Response: [Sph] Typo corrected.
It is certainly not clear that this is a forcing, ie, an phenomenon independent to temperature which drives temperature change, rather than a feedback, ie, a phenomenon largely controlled by temperature which in turn drives temperature change.
More importantly, it is far from clear that this is a global phenomenon. Certainly in China the trend has been in the opposite direction towards less sunlight hours. A similar reduction of sunshine has been found in Switzerland, so the observed increase in the UK is not even a Europe wide phenomenon, let alone a world wide phenomenon.
That the trends are opposite in different locations around the globe strongly suggests the cause is not astronomical (GCR) but rather global or regional climate conditions. That is, the phenomenon is likely a climate feedback or a response to major oceanic variations. Certainly the UK data shows a correlation to the Atlantic Multi-decadal Oscillation. But the AMO may itself just be an artifact of the pattern or Northern Hemisphere warming and cooling due to variations in CO2 and aerosol levels during the 20th century.
Moderator Response: [Sph] Typo corrected. -
MA Rodger at 03:39 AM on 1 November 2011Sorting out Settled Science from Remaining Uncertainties
meagain @6 600 cu km of ice loss per year would require some 0.2 zJ to melt. That is small compared to rises in annual Ocean Heat Content which are twenty times bigger (at least). So on a global scale the Arctic sea ice melt is not so big. But for the Arctic, the impact has got to be large. -
JMurphy at 03:23 AM on 1 November 2011SkS Weekly Digest #22
With regard to BEST, it would seem that Judith Curry is being berated on her own blog for (as many of them seem to 'see' it) being had, deceived, taken for a ride, etc. by that beastly Muller chap. Plenty of accusations against him of lying and dishonesty - all being allowed to stand. Lots of belief that McIntyre is going to sort all of it out - he's auditing the BEST data as we speak, don't you know. And Curry is now referring to the BEST team as "they". Not "us". Can she get any more slippery ? -
lancelot at 02:57 AM on 1 November 2011Climate's changed before
Coming back on natural causes: Sunshine records in S. England apparently show increasing hours of daily sunshine since 1970. I don't see any mention in IPCC reports of sunshine hour records, analysed globally. (If I have missed a mention, could you point me to one.) Regardless whether any mechanism other than GCR to influence cloud cover is conceivable, is sunshine hours not a relatively simple check on possible natural forcing which should be considered, separately from solar irradiance?Response:[DB] "Sunshine records in S. England apparently show increasing hours of daily sunshine since 1970."
Assertions without source citations tend to get ignored. Unless you can provide a source for your claim?
-
Hans5565 at 02:56 AM on 1 November 2011Yes, It's Still Us, and It's Still Bad
Sasquatch, Regarding the short-term trend (whether you refer to it as flatlining, marginally cooling or a warming hiatus), a nice summary of the competing theories is summarized here: http://www.eenews.net/public/Greenwire/2011/10/25/1 -
Tom Curtis at 02:55 AM on 1 November 2011Berkeley Earth Surface Temperature Study: “The effect of urban heating on the global trends is nearly negligible”
lancelot @23, BEST shows a video showing global coverage of their data network for any given year. From that video we can see that in 1800, they rely on just 41 stations. By 1850, that rises to 196, covering all of Europe and Asia, most of North America, and parts of South America, Africa and Australia. Given the broad coverage, it is a safe assumption that in 1850, nearly all stations are at major centers of population. Some were not, of course, in that BEST shows "very rural" temperature from that period. It is dubious that the "very rural" network is spatially extensive enough to not suffer significantly from regional bias until about 1900, when the BEST coverage is global (excluding Antarctica) and incorporates 3413 stations. -
dana1981 at 02:43 AM on 1 November 2011Yes, It's Still Us, and It's Still Bad
Sasquatch @58 - we'll be publishing a post to address the issue you raise later today. There are a number of problems wrong with the "no warming in BEST since 2001" argument, not the least of which being that the argument is simply incorrect when the data is properly analyzed. -
meagain at 02:23 AM on 1 November 2011Sorting out Settled Science from Remaining Uncertainties
Hi Dana et al, Over the last decade it seems that, according to the PIOMAS data, something in the region of 6,000 cubic kilometres of Arctic sea ice has turned to water. This is much faster than the 30 year trend. The energy invested in this phase change is huge: 333Joules per gram of ice melted. The same amount of energy would raise the temperature of one gram of water by 80°C. So quite a lot of "missing" heat may have gone onto the melting in the Arctic. If the Arctic sea ice were to disappear completely, as it looks very likely to do by 2016 +/- 3 years, one would then expect the global temperature to rocket. -
Albatross at 02:22 AM on 1 November 2011Yes, It's Still Us, and It's Still Bad
Everyone, I highly recommend reading JMurphy's post @46, it is an excellent (succinct) summary and assessment of this sad situation that the fake skeptics and those in denial about AGW have gotten themselves into. Nicely done JMurphy. -
CBDunkerson at 01:58 AM on 1 November 2011It's the sun
lancelot, can you cite a source for the supposed increase? I'm also not sure what you mean by 'sunshine hours'. Are cloudy days excluded? If so, at what 'level of cloudiness'? If cloudy days are not considered then the number of hours that the sun shines on various parts of the Earth is entirely a factor of the planet's orbit and inclination... and thus should not be showing any significant long term variation. In any case, satellite readings of total incoming solar radiation should be far more accurate than whatever measurement is being suggested here. -
victull at 01:54 AM on 1 November 2011Pielke Sr. and SkS Dialogue Final Summary
Bob Loblaw @52 Very good discussion. Ocean heat content should reflect the integral of all the past heat flux imbalances back to the mythical global 'equilibrium' where there was no imbalance. If less that 10% of the heat energy imbalance is represented by land and atmosphere warming, then the 90% plus in the oceans must be the primary store of heat energy gain on a global basis. Redistribution of this heat energy by the complex circulations, ENSO etc would be measurable by ice melt, and/or temperature warming in one place and cooling somewhere else. It is very difficult to accurately measure ocean heat content and this should be the area of greatest research effort. Tom Curtis @55 "IMO the main problem with using OHC as the metric of global warming is that it has no implications for future behavior of the climate system." Future energy gain is in the future. Heat already gained to date will show somewhere in temperature rise, ice melt etc which has already occurred. If heat comes out of the oceans to warm the land and atmosphere - it will be lost from the oceans, so would not future warming on a global basis be entirely dependent on future heat energy gain? -
John Hartz at 01:46 AM on 1 November 2011Sorting out Settled Science from Remaining Uncertainties
@Dana: Please add a footnote defining the "Maunder Minimum." -
John Hartz at 01:44 AM on 1 November 2011Sorting out Settled Science from Remaining Uncertainties
@cliffeking #1: Are you sure that the emails you are receiving linking to skeptical/denialist articles are from this Skeptical Science website? -
Bob Lacatena at 01:42 AM on 1 November 2011Yes, It's Still Us, and It's Still Bad
58, Sasquatch, Okay, last post, I promise!!!! The following image definitively proves that the earth has cooled since 1973. Every 7-8 year trend line on the graph is down... shows a definite cooling trend, throughout that period. The conclusion is inescapable: 1) Every trend graphed below is down 2) All trends overlap 3) Therefore the globe has cooled How can anyone possibly argue with this? Don't I have a very good point? [The point is that there is no point in time when a skeptic would not be capable of saying "the globe is cooling" and draw a trend line to prove it to you.]
-
Bob Lacatena at 01:15 AM on 1 November 2011Richard Milne separates skepticism from denial
35, Shibui,I'm not sure I like your chances.
Our chances. We all live on the same planet, and we all share the same fate, no matter what anyone believes is coming. But I go back to what Milne said. It's not a question of proving it to the last detail, because there will (a) always be interests that try to plant confusion and doubt and (b) the vast majority of people won't look at it closely enough to recognize the truth. Only when society as a whole (as a hive mind) adopts a "this is wrong" attitude towards irresponsible fossil fuel usage will things change. I think the best example is litter bugs. Remember litter bugs? Give a hoot, don't pollute? You do if you grew up in the seventies. You also remember roads and highways and fields and school yards covered with cups, papers, ice cream wrappers, cigarette butts, and every other form of debris imaginable. We had just entered an age of dense population combined with an ability to quickly generate cheap wrappers for everything we made and sold. The landscape was covered with them. The easiest thing in the world in a newly disposable society was to just drop it where ever you stood, or to toss it out the window. So why didn't it continue? Because everyone hated the way it looked, so a concerted adv. campaign helped promote the idea. More importantly, people reinforced it with their own behaviors. "Are you going to pick that up?" It became a source of shame to litter. You didn't want to do it, and even if you were tempted sometimes, you didn't want to get caught doing it and you felt guilty afterwards. Probably as often as not you went back and picked it up and found a trash can, because it bugged you so much to have done it. Evidence and proof are not the issue. Understanding and moral investment are the issues, and you won't necessarily get those from proof, and you don't necessarily need proof to achieve them. You do need, however, to expose the ignorant and the greedy who either fear change or benefit from the status quo. If there had been a loud mouthed group of people who thought litter mostly resulted from an Urban High Wind effect, or who made money by collecting fees to pay the street cleaners, then the world today would be covered in used coffee cups, candy wrappers and cigarette butts. -
Bob Lacatena at 00:50 AM on 1 November 2011Yes, It's Still Us, and It's Still Bad
58, Sasquatch, Visit this fun page and use the Java applet. The slider control lets you change the length of the trends you want to see, while the graph shows you every possible trend line of the selected length. See how many blue (negative) trend lines will appear by using short time series, and the point at which they all go away. You might also want to visit this post by Tamino, which makes an attempt to remove some of the noise from the signal (known, measurable factors, like solar changes, volcanism, ENSO events).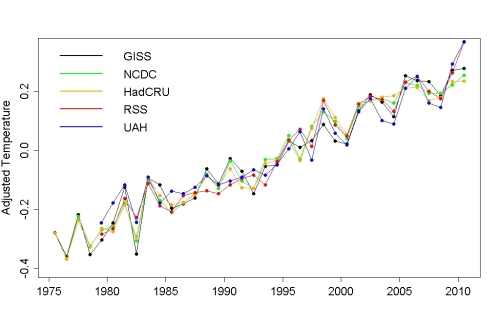 Even here you have periods of apparent cooling, but the long term trend is unequivocal.
The bottom line is, I'm afraid, that for the globe to abruptly cool while we are dumping more and more CO2 into the atmosphere, one of two things must have happened:
a) Physics stopped working.
b) Other factors (e.g. aerosols) have overwhelmed the CO2 temporarily.
[I personally have a huge, huge fear that Chinese coal plant pollution is the culprit. This would be very, very bad because it would give the illusion that CO2 is not as dangerous as we think, and it will stay that way until the Chinese clean up their plants. When they do, which some day they must, then the added aerosols will quickly fall out of the atmosphere while the CO2 stays there for hundreds of years, suddenly unimpeded by the aerosols, to stand up and say "Remember me? Brahahahahahahaha..."]
Even here you have periods of apparent cooling, but the long term trend is unequivocal.
The bottom line is, I'm afraid, that for the globe to abruptly cool while we are dumping more and more CO2 into the atmosphere, one of two things must have happened:
a) Physics stopped working.
b) Other factors (e.g. aerosols) have overwhelmed the CO2 temporarily.
[I personally have a huge, huge fear that Chinese coal plant pollution is the culprit. This would be very, very bad because it would give the illusion that CO2 is not as dangerous as we think, and it will stay that way until the Chinese clean up their plants. When they do, which some day they must, then the added aerosols will quickly fall out of the atmosphere while the CO2 stays there for hundreds of years, suddenly unimpeded by the aerosols, to stand up and say "Remember me? Brahahahahahahaha..."]
-
lancelot at 00:42 AM on 1 November 2011It's the sun
I have seen a chart which shows the record of daily hours of sunshine in England, gradually increasing over 50 years, and correlating with temperature increase in UK. Sunshine Records must go back many years, in many places. Are there any global analyses of sunshine hours from the various sources? -
CBDunkerson at 00:32 AM on 1 November 2011Berkeley Earth Surface Temperature Study: “The effect of urban heating on the global trends is nearly negligible”
lancelot, you'd have to ask the BEST team (the image is copied from image 5 of their 'Influence of Urban Heating on the Global Temperature Land Average' report) for a definitive answer, but I'd guess that 1850 was chosen because it is the earliest any of the previous temperature anomaly studies went back to. At that, the number of 'temperature stations' prior to 1850 is also vanishingly small... dividing (for example) three readings into 'rural vs non-rural' would be statistically meaningless. -
Bob Lacatena at 00:24 AM on 1 November 2011Yes, It's Still Us, and It's Still Bad
58, Sasquatch, I think the easiest way to understand this is to consider this image put together by Bernard J at this comment: Notice how many times one has been able to take a 10 to 15 year span and draw a correct (not eyeballed) trendline to show that warming has stopped, slowed or reversed, and yet the overall trend is clearly seriously up.
This is what Dikran means when he says it is not statistically significant.
Climate models show the exact same behavior.
To put it another way, imagine flipping a coin. You know if you flip it 100 times you'll get somewhere around 50 heads and 50 tails, but not exactly. But you also know you'll not infrequently get 2 heads in a row, and sometimes 3, or runs of ten tosses with 7 or more heads. This is not evidence that the coin has suddenly become biased (because it does not perfectly alternate heads-tails-heads-tails).
To the layman, ten years will seem like more than long enough to tell if something is happening or not. That's the trick. Skeptics and Roger Pielke are knowingly preying on people's natural reactions to such things, while at the same time knowing that scientifically and mathematically that such conclusions are invalid.
Notice how many times one has been able to take a 10 to 15 year span and draw a correct (not eyeballed) trendline to show that warming has stopped, slowed or reversed, and yet the overall trend is clearly seriously up.
This is what Dikran means when he says it is not statistically significant.
Climate models show the exact same behavior.
To put it another way, imagine flipping a coin. You know if you flip it 100 times you'll get somewhere around 50 heads and 50 tails, but not exactly. But you also know you'll not infrequently get 2 heads in a row, and sometimes 3, or runs of ten tosses with 7 or more heads. This is not evidence that the coin has suddenly become biased (because it does not perfectly alternate heads-tails-heads-tails).
To the layman, ten years will seem like more than long enough to tell if something is happening or not. That's the trick. Skeptics and Roger Pielke are knowingly preying on people's natural reactions to such things, while at the same time knowing that scientifically and mathematically that such conclusions are invalid.
-
CBDunkerson at 00:23 AM on 1 November 2011Yes, It's Still Us, and It's Still Bad
Sasquatch, the same sort of 'logic' could be applied to create an argument that the temperature trend at the end of 2010 was +2 degrees per month (the sharp rise following the equally steep drop on your graphs). Trends over time periods within the 'noise level' of the data are essentially meaningless. There have been ten year periods with 'flatlined' warming several previous times in the BEST and WFT data. Those did not indicate the end of the overall warming trend... thus, there is no logical reason to conclude that this one will either. Anyone who claims that this '10 year trend' suggests an end to global warming is ignorant of or lying about basic statistics. -
lancelot at 00:21 AM on 1 November 2011Berkeley Earth Surface Temperature Study: “The effect of urban heating on the global trends is nearly negligible”
Why does the Figure 3 Reconstructed temperature shown in the intro here only start at 1850? The BEST data as released starts at 1800. http://www.berkeleyearth.org/analysis.php -
Sasquatch at 00:20 AM on 1 November 2011Yes, It's Still Us, and It's Still Bad
Mod DM: What time period is statistically significant? 30 years? -
Shibui at 00:08 AM on 1 November 2011Richard Milne separates skepticism from denial
muoncounter #34 "Uncertainty is an intrinsic part of all science." You have to convince the general public if you want them to seriously change their life styles. On the basis of the above, I'm not sure I like your chances. -
Sasquatch at 00:01 AM on 1 November 2011Yes, It's Still Us, and It's Still Bad
I was curious about this image from a skeptic site. When I followed Sphaerica's link to the excellent Wood for Trees site, I discovered very similar plots over similar time scaling. This is the land only data from BEST, and WFTs Temperature Index.
It appears there is some validity to the observation that temperature rise has flatlined over the past decade. I am not sure how important this information is, but I can't easily dismiss it.
Moderator Response: [Dikran Marsupial] The trend is over such a short period that there is no statistically significant evidence from the data that the rate of warming has stayed the same, slowed or even accelerated. If someone shows you the graph again, ask them "is the statistically significant evidence that the rate of warming has slowed over that period". See the recent discussion with Prof. Pielke of this issue for details. -
Tom Dayton at 23:13 PM on 31 October 2011Bad, Badder, BEST
Refreshingly, at least one newspaper called it squarely: The San Francisco Chronicle's editor yesterday wrote in the editorial page:Richard Muller, UC Berkeley physicist: He believed: The science behind climate change was shoddy and politically driven. He discovered: He was wrong.
-
muoncounter at 22:30 PM on 31 October 2011Richard Milne separates skepticism from denial
Shibui@29: "you have to be able to prove the issue down to the last detail" Uncertainty is an intrinsic part of all science. Do you have an example of anything scientific proved 'to the last detail'? -
alan_marshall at 22:15 PM on 31 October 2011Sorting out Settled Science from Remaining Uncertainties
Love the analogy of the gambler in a casino! With exponential growth in greenhouse gases under a business-or-usual scenario, the fake skeptics are like gamblers betting double or nothing in a futile attempt to recover their losses. -
Tristan at 21:42 PM on 31 October 2011Richard Milne separates skepticism from denial
Note that these aren't moral proclamations. They are expressions of personal motivation, of why we practice the science or spread the message. It's about creating a more personal connection with those we are trying to shift, and about drawing reasonable analogies between the behaviour of states and the behaviour of individuals. -
Tristan at 21:32 PM on 31 October 2011Richard Milne separates skepticism from denial
Alan, Absolutely. For example, I like the way John Cook relates his efforts to educate people on climate change with his efforts to live in accordance with Biblical teachings. I like that Hansen and many others focus on the lives of their grandchildren. I think the following sort of analogy would be strong in the Australian circumstance: If you notice someone else littering, would you litter as well? Why then would you argue that Australia should keep littering GHG emissions just because other countries are? -
Tristan at 21:23 PM on 31 October 2011Richard Milne separates skepticism from denial
Shoyemore, What Mr Whitehead says doesn't mean anything to me. None of the names you mentioned would be my first port of call to answer any question. Nor would Newton, Einstein or even Hawking these days. I am not advocating anything new. I am advocating a stronger push to create public sympathy and faith towards scientists. Sphaerica, Change will come when the cost of given products outweighs the value of the products. The cost has social and financial components. Currently the social cost is negligible in most circles. An effectively implemented, appropriately priced emissions tax would let us bypass the waiting period for the social cost to rise. However, if the public is sufficiently negative towards such a tax it would get undone. Given that, purporting to the public that paying for emissions is socially responsible is a necessary part of the movement for a change of the energy paradigm (as you mention). Muon, I am not sure whether it matters if a strategy is characterised as 'defensive' or not. The point is, the effort must be made to win hearts as well as just minds. -
alan_marshall at 20:24 PM on 31 October 2011Richard Milne separates skepticism from denial
Tristan @ 5, What motivates the authors on this site to give up so much of their leisure time for no monetary return? While we don’t talk about it much so as not to distract from the science, many of us are driven by profound ethical convictions. -
Tom Curtis at 17:58 PM on 31 October 2011It hasn't warmed since 1998
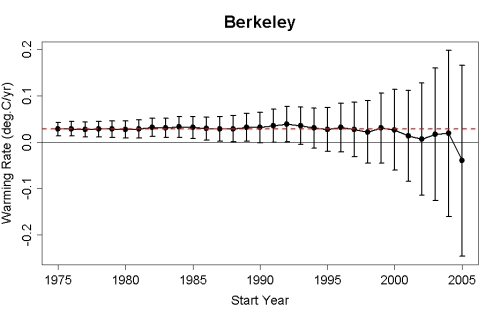
Rick @120, the best currently available discussion of Judith Curry's comments can be found at Tamino's Open Mind. He does a series of analyses of the data showing that: 1) The trend over the chosen period is positive; 2) That the last two data points are almost certainly flawed - so much so that the real scandal here is why where they included? (See below); 3) That if you exclude the flawed data, the trend rises to a level comparable to the trend in various satellite products; 4) That if you do not cherry pick the start point and use a full decades data (rather than artificially truncating it at less than a decade, as Curry did), the trend matches the trend since 1975 at a hefty 0.27 degrees C per decade: Finally, Tamino shows that the minimum time period with a statistically significant slope terminating in early 2010 (the end of the BEST data excluding the two faulty values) is approximately 16 years. That is the minimum period over which the level of statistical significance is sufficient to determine the sign of the slope. And over that period, the trend is positive, and very much the same as the trend since 1975:
 Finally, I referred to the last two data points being flawed. Tamino shows the huge rise in uncertainty for those two points, but it was Nick Stokes that discovered why. It turns out the data for those last two months comes from just 47 stations, compared to the 14,488 stations for the preceding months. What is worse, all of those stations are in Antarctica.
Given the low number of samples, and biased distribution, there is no scientific justification for including the last two samples in their finished product. This is one genuine issue with the BEST product, but as the faulty data points bias the end points low, don't expect to here it raised by so called "climate change skeptics", for whom the predetermined outcome has always been more important than scientific integrity.
Finally, I referred to the last two data points being flawed. Tamino shows the huge rise in uncertainty for those two points, but it was Nick Stokes that discovered why. It turns out the data for those last two months comes from just 47 stations, compared to the 14,488 stations for the preceding months. What is worse, all of those stations are in Antarctica.
Given the low number of samples, and biased distribution, there is no scientific justification for including the last two samples in their finished product. This is one genuine issue with the BEST product, but as the faulty data points bias the end points low, don't expect to here it raised by so called "climate change skeptics", for whom the predetermined outcome has always been more important than scientific integrity.
-
cliffeking at 17:13 PM on 31 October 2011Sorting out Settled Science from Remaining Uncertainties
I have a couple of questions, both of which are OT but I don't know where else to ask them. 1 I receive SKS e-mails linking to articles on climate change and wonder why so very many of them (probably 80%)are of a skeptical or denialist nature - is this a conscious attempt to provide 'balance', or because there are just so many denialist articles online? 2 ACC will affect the entire globe but there seem to be very few articles on SKS that deal with the effects that can be expected in the tropics - almost all non-global articles seem to deal with the US or Australia. Is this because there a few articles/papers concerned with Africa, tropical Asia etc.? Sorry for the OT questions but I don't know where else to ask them.Response:[DB] Thanks for the questions!
1. The latter (there are just so many denialist articles online). But I note that the volume of neutral or pro-ACC scientific papers dwarf those anti-ACC articles appearing in the scientific literature.
2A. There are indeed relatively few articles dealing specifically with the tropics on SkS relative to those dealing with other regions, such as the poles. The biggest reason for that is the ACC effects initially are being realized in the polar regions due to polar amplification effects. It is those amplification effects that are causing regional warming (initially mostly in the Arctic) which are causing changes which will be felt globally. Hence the focus on those areas.
2B. Many non-global articles that focus on the US or Australia do so to counter the sheer volume of denier articles coming from, and based on, those areas.
HTH.
-
Stephen Baines at 16:46 PM on 31 October 2011A new SkS resource: climate skeptics and their myths
Diane, I think the database is important if people want to trace statements made by specific people to posts on SkS. But it is also important to avoid alienating anyone who is honestly skeptical. How would you avoid the appearance "political-partisan stance." What is the trigger for your impression. -
diane5591 at 16:03 PM on 31 October 2011A new SkS resource: climate skeptics and their myths
I think this is an unfortunate addition to the cool science for which skepticalscience has become known. Preaching to the converted is easy enough. But when one manages to get the dubious to consider these pages for their science, it is disheartening to see that they are immediately turned off by what they see, and interpret, as a politican-partisan stance. Let the science speak, please, and think about how this page must seem to those who are personally loyal to the individuals shown here. -
Shibui at 15:45 PM on 31 October 2011Richard Milne separates skepticism from denial
Muoncounter #17 "That the average Joe/Jane believes that he/she should be able to 'replicate' the results of complicated science?" That is not what I had in mind. BEST would seem to be a good example. If you expect people to seriously change their behavior, you have to be able to prove the issue down to the last detail, not just expect that the public will take it on trust... because they won't, and rightly so. -
Stevo at 15:38 PM on 31 October 2011Yes, It's Still Us, and It's Still Bad
In recent discussions (or arguments if you prefer) with denailist friendws of mine the meme has followed very closely what we have seen on this thread. Muller's credibility is questioned. Curry is lionised for distancing herself from the results. The 60% of stations in 30% of the world's surface meme is repeated interminably. Don't you know, folks, its all a conspiracy? And all this from folks who agreed only a few weeks ago that no sane person would argue that the planet isn't warming. Apparantly denialism and consistancy don't sit well together, but there again that is not news to folks around here. -
Rickoxo at 15:34 PM on 31 October 2011It hasn't warmed since 1998
Infrequent poster but I've been reading about the Muller's BEST data set and then saw some counter arguments and critique supposedly from one of the co-authors of the report. I am not making any argument from expertise about the data, but there are a number of quotes from Professor Judith Curry, supposedly the second author on all of the papers, she's a climatologist out of Georgia Institute of Technology. I checked around and all of the skeptic websites have their rehashing of an article that seems to have originated in the daily mail. From what I understand, that's a pretty cruddy source, but using a link below, I went to Curry's own website and it sounds like this is what she's saying: This quote is from the daily mail article: In fact, Prof Curry said, the project’s research data show there has been no increase in world temperatures since the end of the Nineties – a fact confirmed by a new analysis that The Mail on Sunday has obtained. ‘There is no scientific basis for saying that warming hasn’t stopped,’ she said. ‘To say that there is detracts from the credibility of the data, which is very unfortunate.’ Read more: http://www.dailymail.co.uk/sciencetech/article-2055191/Scientists-said-climate-change-sceptics-proved-wrong-accused-hiding-truth-colleague.html#ixzz1cIFa5qrh Here is a blog from Judith Curry, climate etc. I don't know much about it, but the most recent post goes into detail about a conversation she had with Muller and a second post clarifying her comments and what happened in the daily mail interview. http://judithcurry.com/ I went and re-checked the article linked on the home page about the skeptic myth that it hasn't warmed since 1998. It says it hasn't been updated for a while. I get that Muller released his data and leaked his summaries before the data had been peer reviewed and Curry makes a number of comments saying she wished he hadn't done that and that he did it on his own. I get her critique hasn't been peer-reviewed either. A number of the articles referenced a site called wood for trees that has a simple app that lets you access the BEST data and make simple plots. I know nothing about its accuracy or validity, but you can use it to check various date ranges. http://www.woodfortrees.org/plot/best/from:2002/plot/best/from:2002/trend I'm curious if anyone has any better info on this argument and if there is any agreement or counter argument related to Curry's declaration that the BEST data set shows that warming has stopped over the last 10-12 years? Also, please don't hear me saying that in and of itself proves anything about anything. I'm not "going anywhere" with this quote and from reading Curry's blog, she says it doesn't prove or disprove global warming. But it does call into question many of the models and most specifically, it makes Muller look like a bit of a dodo for the way he presented his data and his initial denial of the data then later retractment and admission supposedly of what the data says. Thanks for any thoughts, RickResponse:[DB] Thanks for taking the time to voice your concerns. Tom Curtis has already addressed most of them below, but let me focus on Wood For Trees.
http://www.woodfortrees.org/ is a website run by Paul Clark, a British software developer. Paul has loaded into the website all the publicly-available temperature datasets, including BEST. As such, it is an invaluable tool for quickly comparing temperature trends over varying timeframes. Many climate scientists use Wood For Trees for quick comparisons for the public to turn to for answers to questions.
It's not a panacea for research, as the pros still work directly with the datasets directly, but it is a valuable tool.
As for the rest, I'll close by saying that anyone who agrees that a time series of only a decade isn't scientifically significant AND who also says that over the same time a scientifically significant long-term trend has stopped is speaking out of both sides of their mouths. The two positions are mutually exclusive.
-
dana1981 at 13:05 PM on 31 October 2011Yes, It's Still Us, and It's Still Bad
garythompson - you are correct, we have a post in the works responding to this "skeptic" effort to hide the incline. Keep an eye out for it tomorrow. -
Tom Curtis at 12:49 PM on 31 October 2011Pielke Sr. and SkS Dialogue Final Summary
Bob Loblaw @48: 1) IMO the main problem with using OHC as the metric of global warming is that it has no implications for future behavior of the climate system. Whatever the changes in OHC, the climate will continue to change until the energy leaving the top of the atmosphere (TOA) balances with that received from the sun (radiative equilibrium). As heat below the ocean's surface (specifically, the ocean's "skin") makes no contribution to upwelling Infrared radiation, it has no direct effect on the radiative balance at the TOA. In contrast, Global Mean Surface Temperature has an immediate effect on the up-welling IR radiation both by changing the energy of the IR radiation escaping through the "atmospheric window", and, through convection, by changing the temperatures of the gases that radiate IR energy to space. Because the ratio of GMST to radiative flux is robust through history, we can use that ratio to predict an equilibrium GMST for a given change in radiative flux, something measurements of OHC does not permit. It is true that measurement of OHC together with accurate enough measurements of TOA energy flux (up and down) would allow similar predictions on the assumption of a robust climate sensitivity. However, in order to make such predictions, TOA measurements of the absolute value of the radiative flux would need to improve in sensitivity by an order of magnitude (at least). If we ever gain such accurate instruments, then Pielke's argument may make sense on this point; except that historical values would be lacking. 2) A further problem with ignoring GMST is that it is surface temperature, not OHC that drives climate. Of course, for understanding climate and climate change, the full field of global data is far more useful than their average, but that single number still carries useful information, and more useful information than does the equivalent single number representing OHC. That is because the field the single number represents has a more direct impact on climate, and because we have far more observational comparisons of climate effects relating to the GMST than to the OHC. 3) While I agree that SST is a good proxy for OHC for the upper 750 meters, there can be an increase in OHC without an increase in SST. All that is required is a greater energy flux combined with a more efficient mixing of heat to the deeper layers. The later could be provided by stronger winds (for example). The logic here parallels Dr Pielke's claim that the increase in OHC between 750 and 2000 meters cannot have come from the surface because of the relative lack of heat in the 0-750 meter layer. Again, that claim is false. All that is required for it to be false is a more efficient mixing of heat to the deep (below 750 meters) layer, say be ENSO effects. -
garythompson at 12:30 PM on 31 October 2011Yes, It's Still Us, and It's Still Bad
It appears there are a few news reports about this being the next climate gate. Hide the decline part two. This article seems to capture it. I assume there will be an update from Skeptical Science?Response:[DB] Your linked source speaks eloquently for itself. I'm sure all readers will be able to determine for themselves its veracity and assign it an appropriate measure of reliability.
A larger issue is that this is the anticipated response from "skeptics" when their expected "silver bullet" audit into the heart of AGW turns out actually to verify the basic accuracy of the global temperature records. That then they resort to this type of "fair-balanced" piece as a form of damage control should hardly come as a surprise to anyone.
First, Faux-Climate-Gate. Now Faux-BEST-Gate. Deja-vu, all over again.
-
John Hartz at 11:54 AM on 31 October 2011Yes, It's Still Us, and It's Still Bad
Stay tuned... "On Monday, Muller was taking his results — four separate papers that are not yet published or peer-reviewed, but will be, he says — to a conference in Santa Fe, N.M., expected to include many prominent skeptics as well as mainstream scientists." Source: "Skeptic’s own study finds climate change real, but says scientists should be more critical," Washington Post, Oct 30, 2011 To access this in-depth article, click here
Prev 1443 1444 1445 1446 1447 1448 1449 1450 1451 1452 1453 1454 1455 1456 1457 1458 Next


