


 Arguments


Recent Comments
Prev 1443 1444 1445 1446 1447 1448 1449 1450 1451 1452 1453 1454 1455 1456 1457 1458 Next
Comments 72501 to 72550:
-
skywatcher at 10:15 AM on 13 October 2011Understanding climate denial
#235 Jonathon, debunking what you said in #214 is not diversion. I focused on something you said 'for the record', and showed it was wrong. You brought up 'catastrophic' and you brought up 'strawman' (I never mentioned the word), maybe trying to divert from your prior errors? In fact, you're now providing a nice case study for this thread. See Is there a consensus for an on-topic comment on consensus occuring in the presence of a large range of values. -
Tom Curtis at 10:13 AM on 13 October 2011Pielke Sr. and SkS Warming Estimates
EliRabbet @78, you have quoted my comments, and I must say that I reject your comments. IMO, given the large scale motion of air due to the global circulation, specifically the Hadley and Ferrel cells, the effect of "purely local" forcings is more analogous to holding a magnifying glass to a stream of water than to a piece of paper. This is true even of non-dispersing radiative forcings (such as LC/LUC). It is certainly true of dispersing forcing agents such as aerosols, tropospheric ozone and BC which can disperse up to 12,000 km east/west, and 3,500 km north/south. -
skywatcher at 10:13 AM on 13 October 2011There is no consensus
From a debate on another thread where Jonathon argued: "For the record, I do not believe that a large range of values (whether it be climate sensitivity, projected warming, etc.) indicates that there is a consensus on the issue. On the contrary, it argues the opposite." I do think 'consensus' that some variable is changing can apply to a wide range of estimated values so long as that range does not include zero. There has been for many years a large range on estimated climate sensitivity (e.g. the oft-quoted 2C-4.5C per doubling CO2). I want to give another example where there was, for a great many years, a lot of uncertainty in the magnitude of a value, yet the existence of the change it implied was not questioned. For many years, there was a large range for estimated values of H0, the expansion rate of the Universe, which only recently has been narrowed down considerably. As recently as 1996, there were estimates as low as 40km/s/Mpc and as high as 100km/s/Mpc, it is now closer to 74km/s/Mpc. Edwin Hubble's initial estimate in 1929, after he first measured the redshift of spectral lines in Cepheid variables, was 500km/s/Mpc. Was there consensus in 1996 that the Universe is expanding? There certainly was. Was that based on a tightly-constrained value for the expansion rate? Absolutely not.
-
Michael Hauber at 10:11 AM on 13 October 2011The Earth continues to build up heat
From section 5: This more negative aerosol (or other) forcing is required for energy balance, as there was little surface warming over the last decade even though greenhouse gas concentrations continued to increase (with a small decrease in solar input) and the ocean continued to warm and sea level continued to rise. If I understand this correctly then the 'missing heat' is still missing. Deniers have seriously mis-represented the issue of missing heat. It is not that there is less heat in the ocean than the models predict. The missing heat arises if we total all the heat that we can track going into and out of the climate system; it doesn't agree with the total heat being accumulated in the system. Hence the 'more negative (or other)' forcing required to balance the heat budget. Finally as far as I can tell the total heat content of the ocean is not directly measured in this paper, but inferred from sea level rise, correcting for factors such as ice sheet melt, ground aquifer depletion, and then assuming the rest of the sea level rise is thermal expansion. The advance of this paper over previous studies is that the sea level budget has been balanced (as per introduction), although I haven't yet figured out what that actually means. -
Daniel Bailey at 10:10 AM on 13 October 2011Understanding climate denial
Ah, I see. Since "denier" is used to refer to those who deny climate science, "warmist" is thus used by deniers to refer to those who affirm climate science. Got it. -
Jonathon at 09:57 AM on 13 October 2011Understanding climate denial
Probably true Lloyd. Warmist appears similar, but opposite to denier. -
Albatross at 09:27 AM on 13 October 2011Pielke Sr. and SkS Disagreements and Open Questions
Hello Dr. Pielke, The discussion is getting side tracked. Let us recall that the topic at issue here is the choice of 1998 as a start date to support the claim (made on your blog) that there has been little or no warming for 13 years. Do you agree that it was perhaps an inappropriate start date and is without statistical significance? I'm sure that Lucia and Tamino would concur. Further, the choice of 1998 (and more recently 2002) is also puzzling given that you said on your blog that "I agree with Santer et al that “[m]inimal warming over a single decade does not disprove the existence of a slowly-evolving anthropogenic warming signal". Your arguments against using linear trends are also puzzling, especially given that in a recent paper that you co-authored with Christy et al. (2010), you used linear trends extensively. In fact, Adobe tells me that the word "trend" appears 126 times in your paper. Additionally, why is using a linear trend acceptable to suggest that there has been no warming for 13 years, but using a linear trend to challenge that assertion is not? -
muoncounter at 09:14 AM on 13 October 2011Greenland ice loss continues to accelerate
adriansmits#31: Not cherry picking? You've picked 3 years of sea level data and concluded 'go back 60 or 70 years there is very little warming'? If I look in the dictionary under 'cherry picking,' I'd see this type of analysis. Wake up and look at some real data. And find the right thread for sea level rise or 'its not happening.' -
Lloyd Flack at 09:09 AM on 13 October 2011Understanding climate denial
I think "warmist" is an attempt to attribute belief that AGW is real to political ideology. Those who use it are ideologically motivated and tend to see and opposition to them as also being ideologically motivated. They find it hard to see that there are people for whom science trumps ideology. They want to win and don't understand those who are more interested in understanding than in beating opponents. -
adrian smits at 09:07 AM on 13 October 2011Greenland ice loss continues to accelerate
Hasn't anyone looked at sea level rise for the last 3 years? It is not happening. Ergo either the ice is not melting or the ocean is not warming make your pick but right now.If we go back 60 or 70 years there is very little warming maybe 2 or 3 tenths of a degree in the unadjusted record. This is not cherry picking folks it's the period of time over the last 150 years when we have spewed over 90% of the man made carbon dioxide produced over that period.Response:[DB] "Hasn't anyone looked at sea level rise for the last 3 years? It is not happening."
Adrian, 3 years is far, far too short of a period in time to be meaningful. On such a short scale of time the noise in the data series drowns out the underlying signal. Typically about 17 years of data is the minimum needed to deduce even a linear trend.

[Source]
For further reading, I suggest Tamino's excellent piece on sea level trends, So What?
"This is not cherry picking folks"
Yes, I'm afraid it is. Unless you're looking at a long enough record, say the whole record, your short period has no meaning:

Yup, still happening...
-
skywatcher at 08:54 AM on 13 October 2011Pielke Sr. and SkS Disagreements and Open Questions
Dr Pielke, it is funny you should ask about a return to an 'upturn, when we are presently above the long-term trend in the UAH data, as shown in my post at #58. We have been above the 30-year trend for most of the time since 2001. What gives you cause for thinking the trend has stopped? Did you think it had stopped in 1992? -
Tom Curtis at 08:54 AM on 13 October 2011Pielke Sr. and SkS Disagreements and Open Questions
Dr Pielke @70, with respect, linking to a list of posts, at least one of which has nothing to do with temperatures is not very useful. Which post did you have in mind? And in what way does it support your position? -
Jeffrey Davis at 08:44 AM on 13 October 2011Pielke Sr. and SkS Warming Estimates
re: 80 and the efficacy of clean air acts and AGW It's one of the ironies of life that filthy poisonous air dampens global warming. Were there only the one consequence of burning carbon energy -- an increase in global temperature -- then the devil's bargain of filthy air might seem almost worth it. But ocean acidification is another -- and just as serious -- consequence to carbon burning. -
Tom Curtis at 08:43 AM on 13 October 2011Pielke Sr. and SkS Disagreements and Open Questions
It seems to me that two graphs by Tamino would help illustrate this discussion. The first shows the statistical significance of linear trends in Gistemp from the start year to June, 2011: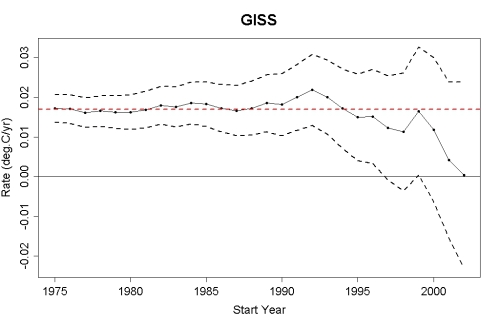 Although Tamino uses a different temperature index (because he is responding to Steve Goddard, not Dr Pielke, the point remains the same. In the case of Gistemp, the trend since 2002 has insufficient data to distinguish between an underlying trend of between +/- 0.24 degrees C per decade. That is, consistent with the data, from 2002 to June, 2011, the temperature data could reflect a long term warming or cooling of 0.24 degrees per decade plus noise. (Please note the confidence interval is estimated by eyeball, so it could be +/-0.02 from indicated value.) It is likely that UAH or RSS will constrain the trend even less over such short intervals in that they react much more strongly to ENSO events than does the surface temperature data.
For completeness, the Gistemp data from 1998 to June, 2011 is consistent with long term trends between +0.27 degrees per decaded and -0.03 degrees per decade.
In contrast, the trend since 1994 (17 years ago) could lie between +0.08 and +0.28 degrees per decade. That from 1981 could lie between +0.13 and +0.23 per decade.
The possible range of the trend increases from 0.1 degrees per decade for 30 years data to 0.2 for 17, 0.3 for 13 (1998) and 0.48 for 9 (2002). As the temperature data itself never varies by more than 0.023 over the period shown, or by more than 0.01 degree in a single year, decadal trends with uncertainties greater than ten times those values are clearly useless.
Fortunately we are not in a situation in which we do not know the major sources of noise in the global means surface temperature. The three strongest sources of noise are, in order of strength, ENSO, volcanic eruptions and the eleven year solar cycle. Because these sources of noise are well known, and their strength quantified, their influence can be removed from the temperature data:
Although Tamino uses a different temperature index (because he is responding to Steve Goddard, not Dr Pielke, the point remains the same. In the case of Gistemp, the trend since 2002 has insufficient data to distinguish between an underlying trend of between +/- 0.24 degrees C per decade. That is, consistent with the data, from 2002 to June, 2011, the temperature data could reflect a long term warming or cooling of 0.24 degrees per decade plus noise. (Please note the confidence interval is estimated by eyeball, so it could be +/-0.02 from indicated value.) It is likely that UAH or RSS will constrain the trend even less over such short intervals in that they react much more strongly to ENSO events than does the surface temperature data.
For completeness, the Gistemp data from 1998 to June, 2011 is consistent with long term trends between +0.27 degrees per decaded and -0.03 degrees per decade.
In contrast, the trend since 1994 (17 years ago) could lie between +0.08 and +0.28 degrees per decade. That from 1981 could lie between +0.13 and +0.23 per decade.
The possible range of the trend increases from 0.1 degrees per decade for 30 years data to 0.2 for 17, 0.3 for 13 (1998) and 0.48 for 9 (2002). As the temperature data itself never varies by more than 0.023 over the period shown, or by more than 0.01 degree in a single year, decadal trends with uncertainties greater than ten times those values are clearly useless.
Fortunately we are not in a situation in which we do not know the major sources of noise in the global means surface temperature. The three strongest sources of noise are, in order of strength, ENSO, volcanic eruptions and the eleven year solar cycle. Because these sources of noise are well known, and their strength quantified, their influence can be removed from the temperature data:
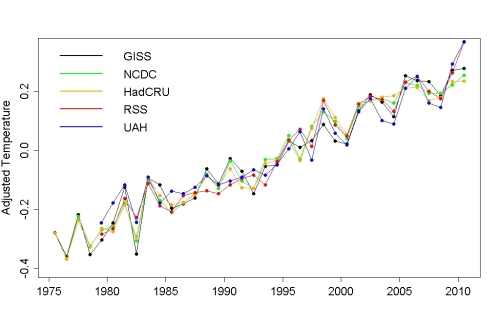 (Click on image to read accompanying article.)
As Dr Pielke believes the "flat" trend from 1998 (and 2002) is significant, perhaps he could point to the flat trend in the data once adjusted for these well known sources of noise?
(Click on image to read accompanying article.)
As Dr Pielke believes the "flat" trend from 1998 (and 2002) is significant, perhaps he could point to the flat trend in the data once adjusted for these well known sources of noise?
-
pielkesr at 08:13 AM on 13 October 2011Pielke Sr. and SkS Disagreements and Open Questions
Dikran Marsupial - I recommend you and other readers read Lucia's discussion of this issue on her weblog post; e.g. see http://rankexploits.com/musings/category/global-climate-change/gcms/ and other related posts. She has statistically looked at this issue. The short time period does raise the issue as to when you expect the upturn to recommence. -
pielkesr at 08:10 AM on 13 October 2011Pielke Sr. and SkS Warming Estimates
Rob Honeycutt - I do not accept that the global average radiative forcing is the primary climate metric to define first-order climate forcings. I have concluded that, while important, it is not the one we should place most of the emphasis. In my view, and from our analyses in our papers, it is the regional/local scale that matters much more to society and the environment. This includes the extent that heterogeneous climate forcings are altering atmospheric/ocean circulations. -
scaddenp at 07:55 AM on 13 October 2011Understanding climate denial
I came across an interesting historical case of denial - Pellagra. Caveat, my source is "52 loaves" which could hardly be described as an authoritative history text. Despite Goldberger's experiments, (which you couldnt do today) giving strong evidence for Pellagra being a diet deficiency, the "infectionists" continued in denial. It is postulated that the roots of denial were again within deeply held political values. In the US, Pellagra was most prevalent in the South. 50 years after the civil war, the message that sounded like "the South cant feed itself properly" (especially when there was obviously a lot of food) was not going to sell. I would add a 6th characteristic to denial - accepting the message would challenge deeply held values. -
Dikran Marsupial at 07:52 AM on 13 October 2011Pielke Sr. and SkS Disagreements and Open Questions
Prof. Pielke wrote "I look at the figure and see lots of ups and downs. A linear line only explains a small part of the observed pattern. " The "ups and downs" are essentially noise, not signal. They are caused by internal variability, e.g. ENSO and say nothing about the underlying signal (i.e. the forced climate change). I am rather concerned that an experienced scientist should draw conclusions by "looking" at data, rather then performing a proper statistical analysis of the data. Human beings are all too good at detecting patterns in data where no pattern exists, which is why scientists use statistics. -
JosHagelaars at 07:46 AM on 13 October 2011The Earth continues to build up heat
@Kevin C For the ocean part of surface of the world (70.8%) it would be 0.76 / 1.14 = 0.67 W/m2. You can calculate other interesting trends from the period from 2003 up to now, which is the period some 'skeptics' use to indicate that the rise in OHC has flattened, e.g. : http://bobtisdale.wordpress.com/2011/09/08/2nd-quarter-2011-nodc-global-ohc-anomalies/ Trends I obtained from the ohc-levitus monthly data for 2003 - now: 0 - 2000 m = 0.42 x 10^22 J/yr 0 - 700 m = 0.05 x 10^22 J/yr It seems to me that 0.42 x 10^22 J/yr is not the same as flattened. -
Dikran Marsupial at 07:42 AM on 13 October 2011Pielke Sr. and SkS Disagreements and Open Questions
Prof. Pielke writes "You can claim it is too short of a time, but you leave yourself vulnerable to the same type of cherrypicking that you accuse others of doing by not including more recent years." This is not correct, I explicitly said that I would not base a serious argument on such short term trends, precisely becuase they are not robust and statistically meaningless. The additional trends over even shorter periods are even less robust, and even more statistically meaningless. I asked you for evidence that the underlying signal (i.e. the forced climate change) is significantly non-linear over the sort of timescales we are discussing and you have presented none. Of course the climate system has non-linearities, but that does not mean that a linear approximation is not entirely reasonable in this situation. I do not wish to divert the discussion onto CO2 or any other cause of the trend. The concern is with your use of trends computed over too short a period to have any statistical robustness. -
Rob Honeycutt at 07:22 AM on 13 October 2011Pielke Sr. and SkS Warming Estimates
Dr Pielke said... "Finally, while we agree that the radiative forcing of added CO2 is "A" first order climate forcing, it is not "THE" only first order climate forcing." It rather seems to me that this is the very point of the blog post Dana has done here. In your comment at #4 I believe you accepted Dana's correction which, if I'm not mistaken, would make CO2 "the" first order forcing. If we accept AR4 or Skeie 2011 numbers then CO2 is clearly the first order forcing. I don't say this to suggest that other issues shouldn't be addressed. Clearly they should, but as Eli points out policy would suggest that the largest problem should have priority. -
Kevin C at 07:00 AM on 13 October 2011The Earth continues to build up heat
Interesting gradient JosHag. Divide by s/yr (3x10^7) and surface area of the earth (5*10^14 m^2) and you get a flux of 0.5W/m^2. Which is a plausible number of energy imbalance. -
Albatross at 06:58 AM on 13 October 2011Pielke Sr. and SkS Disagreements and Open Questions
Hello Dr. Pielke @64, Sorry, there has been a miscommunication. I provided the wrong link. I requested that further discussion of the land use forcing be continued on the following thread. This thread is now dedicated to discussing the curious and puzzling choice by you to select 1998 as the start point for your trend. -
pielkesr at 06:56 AM on 13 October 2011Pielke Sr. and SkS Disagreements and Open Questions
I have asked a simple question and you have only partially answered. What is the trend since 2000, 2001, 2002 etc. I realize these are shorter time periods. My point is that if you would to convince people that human's are causing global warming, there are going to ask where the warming has been in the lower troposphere since 2002? Dikran Marsupial - You can claim it is too short of a time, but you leave yourself vulnerable to the same type of cherrypicking that you accuse others of doing by not including more recent years. If you want a convincing analysis for CO2, use the Mauna Loa Observatory plot of CO2 concentrations over time. By bringing in your expected long-term linear trend in lower tropospheric temperature but which is reality is embedded in a nonlinear system, you weaken your argument. In fact, it illustrates that the real climate system is significantly more complicated than presented by the climate models. Why not just stay with the risks of the added atmospheric concentration of CO2 as one of the climate concerns? -
JosHagelaars at 06:52 AM on 13 October 2011The Earth continues to build up heat
Sorry, the trends i gave in #5 are from 1990 to now based on the monthly data. -
Jeffrey Davis at 06:51 AM on 13 October 2011Pielke Sr. and SkS Warming Estimates
"Having said that, must of these emissions come from China and India (now), and will dissipate in any event when increased prosperity leads to pressure for clean air acts." Since the pressure in the US is actually on to gut clean air acts and neuter the Environmental Protection Agency, I think the idea that clean air acts and good environmental stewardship are historical necessities is quaint. And wrong. -
pielkesr at 06:48 AM on 13 October 2011Pielke Sr. and SkS Disagreements and Open Questions
Dikran Marsupial - I look at the figure and see lots of ups and downs. A linear line only explains a small part of the observed pattern. -
pielkesr at 06:47 AM on 13 October 2011Pielke Sr. and SkS Disagreements and Open Questions
Hi Albatross - You said to move the dicussion over here. With respect to the global average surface temperature trend, the land portion makes up a significant portion of it. Even more importantly, we need to dissect into regions as that is the spatial scale of major atmospheric circulation features. Land is also where most people live. -
Andy Skuce at 06:23 AM on 13 October 2011True Cost of Coal Power - Muller, Mendelsohn, and Nordhaus
There's a book review in the New York Review of Books by William Nordhaus (one of the authors of the MMN11 paper) that has further discussion on fossil fuel externalities and Pigovian taxes. -
Dikran Marsupial at 06:09 AM on 13 October 2011Pielke Sr. and SkS Disagreements and Open Questions
Albatross@62 Indeed, I am somewhat puzzled that Prof. Pielke asks us to "Let [him] know the trends you see starting in different years since 1998.", given that both dana and skywatcher had already done so! Along with statistical significance, if you want to suggest there hasn't been any warming, then you also need to estimate the statistical power of the test. If there isn't enough data to reliably reject the null hypothesis when it actually is false, then the lack of statistical significance really isn't saying much! -
Albatross at 05:54 AM on 13 October 2011Pielke Sr. and SkS Disagreements and Open Questions
Dikran @60, Dana also calculated the trends using different start dates. Here are some more using the UAH data (which is considered by "skeptics" to be a superior dataset): If one starts in 2000: the slope is 0.14 C per decade. If one starts in 1996: the slope is 0.13 C per decade. Spot the outlier: If one starts in 1996: the slope is 0.13 C per decade. If one starts in 1997: the slope is 0.10 C per decade. If one starts in 1998: the slope is 0.06 C per decade. If one starts in 1999: the slope is 0.18 C per decade. If one starts in 2000: the slope is 0.14 C per decade. As Dana showed above, if one uses at least 17 years of data as the research suggests is required (e.g., Santer et al. 2011) one gets 0.14 C per decade. Using the 1998 start date to claim that there has been little or no warming (for 13 years) as Dr. Pielke did is grossly misleading, is a poor choice for obvious reasons, and is simply too short a window to calculate a statistically significant trend, and as such is simply not justifiable or defensible. -
Pielke Sr. and SkS Disagreements and Open Questions
Dr. Pielke - "...focusing on a linear trend with respect to a actual nonlinear signal is a substantial oversimplication..." Absolutely correct. However, given the inherent noise in the system and measurements, as well presented by Santer et al 2011, a linear trend is is the only marginally justifiable extraction from such a short time period - any more complex fit would simply be statistically unsupportable given the limited evidence. And shown the 3x variations in linear trend with just a year variation in start point, 13 years isn't enough for a robust linear fit, either - it's not enough data. -
Dikran Marsupial at 05:28 AM on 13 October 2011Pielke Sr. and SkS Disagreements and Open Questions
Prof. Pielke what evidence do you have that the underlying signal (i.e. the forced climate change) is significantly non-linear over such a short timescale? Indeed lets look at trends starting in different years around 1998.If you start a year earlier, you get a trend of 0.103 degrees C per decade, starting in 1998 it is 0.060 degrees per decade, starting a year later in 1999 it is a whopping 0.183 degrees per decade (which is actually higher than the trend since the start of the UAH dataset, which is 0.138 degrees per decade). In other words, you need to pick 1998 to minimise the trend and the result isn't robust to changing the start date by a year in either direction. Please explain to me why we should be looking at the lack of warming since 1998, rather than looking at the trend since 1999, which gives the impression* that warming is accelerating as the post 1999 trend is steeper than the overall trend)? I suspect the problem is that the eye is deceived by the El-Nino excursion, computing the statistical trends gives a different picture that is not so heavily biased by that feature. *Of course I wouldn't try to make such an argument as a serious point because such short term trends are not robust and hence statistically almost meaningless. This is true whether the trend is large or small.
-
EliRabett at 05:23 AM on 13 October 2011Pielke Sr. and SkS Warming Estimates
Eli is not so sure that just leaving it at that is a good policy. If someone keeps trying to shove nonsense into a discussion, that someone should not be told, ok, we disagree. This is not a debate with a fool that one can simply walk away from. Something stronger is required. The obdurate cynical ploy of never admitting the obvious is a major tactic of rejectionism and it works because it tires people out. The 28 vs 50 whatever stuff is important for policy, because policy says that the largest problem should have priority, the attempt to belittle the carbon forcing is simply another tactic. -
EliRabett at 05:18 AM on 13 October 2011Pielke Sr. and SkS Warming Estimates
It is interesting that 'Industrial pollutants (tropospheric ozone and BC) constitute 22.8% of all forcings (Skeie et al), or 24.9% (Pielke corrected). In any terms, these are a substantive proportion and I agree with Hansen that we should target these "low hanging fruit". Having said that, must of these emissions come from China and India (now), and will dissipate in any event when increased prosperity leads to pressure for clean air acts. " The implication being scince black carbon and ozone (mostly from NOx chemistry) are local/regional, the local/regional effects are much larger. -
Albatross at 05:18 AM on 13 October 2011Pielke Sr. and SkS Warming Estimates
Hello Dr. Pielke @76, I was clearly referring to the global mean temperature, and that is what is at issue here, not the land temperature only. It has been shown repeatedly that one cannot model the global mean temperature accurately without including both natural and anthropogenic forcings, and that includes land use change. My point still stands. If you wish to discuss this matter further, I encourage you to post future comments on the appropriate thread (here). Thank you. And yet another request for participants to please move the discussion forward to our next point. Here is the link. I look forward to hearing Dr. Pielke's thoughts on that particular issue. -
pielkesr at 05:06 AM on 13 October 2011Pielke Sr. and SkS Disagreements and Open Questions
All - please see the top and bottom figures in figure 7 in http://www.ssmi.com/msu/msu_data_description.html. Let me know the trends you see starting in different years since 1998. My view, is that focusing on a linear trend with respect to a actual nonlinear signal is a substantial oversimplication of how we should expect the climate sytstem to behave both naturally, and in response to the diversity of human climate forcings. -
pielkesr at 04:59 AM on 13 October 2011Pielke Sr. and SkS Warming Estimates
Albatross - Regarding "...one does not need to invoke the alteration of major atmospheric/ocean circulations by anthro land use change to explain the observed warming" please see Figure 11 in Pielke Sr., R.A., A. Pitman, D. Niyogi, R. Mahmood, C. McAlpine, F. Hossain, K. Goldewijk, U. Nair, R. Betts, S. Fall, M. Reichstein, P. Kabat, and N. de Noblet-Ducoudré, 2011: Land use/land cover changes and climate: Modeling analysis and observational evidence. Wiley Interdisciplinary Reviews: Climate Change, Invited paper, in press. The land surface part of the surface temperature record cannot be explained without considering land use/land cover change. Even then there is the complication from aerosols and natutal long term variability (which does involve atmospheric and ocean circulation pattern variations). -
muoncounter at 04:54 AM on 13 October 2011It's land use
Continuing from here --source
This document (written in 2002) suggests that forested area in the US is recovering slightly:
Forest land area increased from 747 to 749 million acres (0.3 percent) between 1997 and 2002, continuing a slight upward trend in area beginning in the late 1980s.
Since the bulk of the deforestation occurred in the 19th century, this cannot be a significant contributor to recent warming.
--source
This document (written in 2002) suggests that forested area in the US is recovering slightly:
Forest land area increased from 747 to 749 million acres (0.3 percent) between 1997 and 2002, continuing a slight upward trend in area beginning in the late 1980s.
Since the bulk of the deforestation occurred in the 19th century, this cannot be a significant contributor to recent warming.
-
muoncounter at 04:53 AM on 13 October 2011Pielke Sr. and SkS Warming Estimates
Dr. Pielke#68 and #69: There is an older SkS thread regarding land use changes. A USFS graphic posted there shows forested area in the US declined rapidly over the course of the 19th century. Since the early 20th century, there has not been much change. Changing land use in the US, as measured by forested area, cannot therefore be a significant contributor to recent warming. I wonder if similar statistics exist to show the timing of land use change in other countries. -
dana1981 at 04:44 AM on 13 October 2011Pielke Sr. and SkS Warming Estimates
Dr. Pielke, for the record, some of us have attempted to present our view on Watts' blog. Let's just say we have not been received kindly. This blog post is a good example of Watts' attitude towards Skeptical Science, and in particular, this comment from Watts towards me (and the one following it). Watts is not very tolerant of opposing viewpoints on his blog, and the causticity of comments on his blog is on a completely different level than on SkS. Let's just say we also disagree about the quality of the scientific content on WUWT and leave it at that, since it's off-topic, and since I don't have anything nice to say about it, I probably shouldn't say anything at all. -
pielkesr at 04:17 AM on 13 October 2011Pielke Sr. and SkS Warming Estimates
Rob Honeycutt - I am glad my viewpoint is being more generally appreciated. Just a few comments: 1. Some of the reader's comments on Anthony's weblog may be caustic at times (as they are at SkS; and at Real Climate, where I have also been commenting), but Anthony has the highest level of professional integrity. His posts are very informative, and even if you do not agree with him, you will broaden your prespective. He is as sincere in his views as you are on yours. I recommend an open-mind in reading his posts. If one avoids bitter (snarky) comments, you and your colleagues would find that website of considerable value in presenting your views and discussing with those who disagree. I am hoping that more courtesy will catch on, on all of the weblogs. 2. In terms your statement "Climate change has a good likelihood of being the most important issue for humanity for the next century and beyond." I would alter this to "Climate is a major issue for humanity for the next century and beyond, as it has been in the past. The role of humans in altering the climate is incompletely understood, but is also very important. In terms of whether the part of climate that is changing, relative to climate as it has occurred, is the "most important issue", needs, in my view, to be examined using the bottom-up, resource-based persepctive that we present in our paper Pielke Sr., R.A., R. Wilby, D. Niyogi, F. Hossain, K. Dairuku, J. Adegoke, G. Kallos, T. Seastedt, and K. Suding, 2011: Dealing with complexity and extreme events using a bottom-up, resource-based vulnerability perspective. AGU Monograph on Complexity and Extreme Events in Geosciences, in press. http://pielkeclimatesci.files.wordpress.com/2011/05/r-365.pdf The abstract reads We discuss the adoption of a bottom-up, resource–based vulnerability approach in evaluating the effect of climate and other environmental and societal threats to societally critical resources. This vulnerability concept requires the determination of the major threats to local and regional water, food, energy, human health, and ecosystem function resources from extreme events including climate, but also from other social and environmental issues. After these threats are identified for each resource, then the relative risks can be compared with other risks in order to adopt optimal preferred mitigation/adaptation strategies. This is a more inclusive way of assessing risks, including from climate variability and climate change than using the outcome vulnerability approach adopted by the IPCC. A contextual vulnerability assessment, using the bottom-up, resource-based framework is a more inclusive approach for policymakers to adopt effective mitigation and adaptation methodologies to deal with the complexity of the spectrum of social and environmental extreme events that will occur in the coming decades, as the range of threats are assessed, beyond just the focus on CO2 and a few other greenhouse gases as emphasized in the IPCC assessments." In terms of "climate", as contrasted with "climate change", we need to assess what would occur now with the current and projected societal conditions but with the reoccurrence of historical, recent paleo-record, and worse case sequence of weather days. For the global climate models to add value to this they must be able to skillfully predict the changes in the regional weather statistics. Your statement that "Climate change has a good likelihood of being the most important issue for humanity for the next century and beyond." need to be evaluated in this bottom-up framework. 3. Finally, while we agree that the radiative forcing of added CO2 is "A" first order climate forcing, it is not "THE" only first order climate forcing. I define importance in terms of, for example, how large scale atmospheric and ocean circulations are affected. I have reported on numerous research papers on my weblog that document this issue. I will have two questions on my weblog early next week, to continue our constructive discussion. -
JosHagelaars at 04:11 AM on 13 October 2011The Earth continues to build up heat
@From Peru I think it is taken from this: http://www.realclimate.org/index.php/archives/2011/10/global-warming-and-ocean-heat-content/comment-page-3/#comment-216562 You can build the graph yourself using the link I gave in comment #5, see file "ohc2000m_levitus_climdash_seasonal.csv". The data per year are also available on the same ftp server. -
Albatross at 04:03 AM on 13 October 2011Pielke Sr. and SkS Warming Estimates
Hello Dr. Pielke, Thank you for the information. I do not think we are in disagreement on this one, and the IPCC AR4 agree too: "Understanding land-use and land-cover changes is crucial to understanding climate change. Even if land activities are not considered as subject to mitigation policy, the impact of land-use change on emissions, sequestration, and albedo plays an important role in radiative forcing and the carbon cycle." Interestingly the contribution to CO2 levels from land use change that you provide above (~20 ppmv) seems to be lower than the value cited in AR4: "Cumulative emissions from historical land-cover conversion for the period 1920–1992 have been estimated to be between 206 and 333 Pg CO2 (McGuire et al., 2001), and as much as 572 Pg CO2 for the entire industrial period 1850–2000, roughly one-third of total anthropogenic carbon emissions over this period (Houghton, 2003)." So about a third of a total increase of ~100 ppmv between 1850 and 2005, or ~30 ppmv. The take home message is that even when these huge changes to the land scape were taking place since the Industrial Revolution, as you note above, the net contribution to the global temperature may have been about 0.1 C. In contrast, as we showed above, the expected warming from the observed net anthropogenic forcing is ~0.65 C (of the observed 0.8 C). Not to belittle the importance of land use change, but one does not need to invoke the alteration of major atmospheric/ocean circulations by anthro land use change to explain the observed warming. Occam's razor applies here. With that said, we cannot continue to lose our forests, and that is one of the many reasons why programs like REDD are so important, and on that I think we all agree. Given that we are more or less in agreement on this issue and agree to disagree on the magnitude of the forcings in the above Table (as did RealClimate back in 2006), can I suggest that we please the discussion forward and now discuss the next point outlined on the other thread by Dana. Thank you. -
From Peru at 03:56 AM on 13 October 2011The Earth continues to build up heat
Albatross: From what paper you found that beautiful graph showing the ocean heat content down to 2000 m timeseries? -
JosHagelaars at 03:19 AM on 13 October 2011The Earth continues to build up heat
The NODC data for the ocean heat content 0 - 2000 m, where the graph in comment #3 is based upon, are publicly available from: ftp://ftp.nodc.noaa.gov/pub/data.nodc/woa/DATA_ANALYSIS/3M_HEAT_CONTENT/DATA/basin/3month/ I calculated a linear trend from 1995 to now: 0 - 2000 m = 0.76 x 10^22 J/yr 0 - 700 m = 0.55 x 10^22 J/yr -
Rob Honeycutt at 03:11 AM on 13 October 2011Pielke Sr. and SkS Warming Estimates
Dr Pielke said... "I do not know how many times I can state it, but I certainly agree that added CO2 is a first order climate forcing..." If I go and make this exact statement on any number of "skeptic" blogs (including Anthony's) I get skinned alive by a large hoard of commenters. This is the "context" from which most of us are posting. I think most people here would also agree that there is still a lot that needs to be better understood in order to form better public policy. And no one harbors any notion that the IPCC is a perfect report on the science. The challenge is, as you say, if CO2 is a first order forcing and there are also many other human forcings that need to be addressed... that message is clearly being undermined, or avoided, or even ignored. From what I know of the people on this site, everyone is concerned about exactly this. Climate change has a good likelihood of being the most important issue for humanity for the next century and beyond. This is a critical decade to begin taking action to make changes in order to avoid what could be the worst consequences. That message needs to be conveyed with all its caveats and uncertainties. Meanwhile there are a large number of very vocal people out there who are trying to tell the world there is nothing to worry about (which is understandably what people prefer to hear). There are people trying to say the science is unsure or can't be trusted. Worse yet, there are a select number of people, like Chris Monckton, who are trying to tell the world that the scientists who are telling us the bad news are socialists/communists/nazis who are using AGW as a ruse to take over the governments of the world. These messages are literally drowning out the actual science. This is exactly what SkS is about. If your message is that the science of climate change needs to be well communicated, we're on the same side. If your message is that human activities are contributing to climate change and need to be addressed (and we believe that is what the science tells us), we are on the same side. -
dana1981 at 03:03 AM on 13 October 2011Pielke Sr. and SkS Warming Estimates
Dr. Pielke, we are certainly in agreement about the need to use more than one metric - as we have noted, we think it's important to look at all metrics (surface temp, TLT, OHC, ice masses, sea level rise, ocean acidification, etc.). John Cook has a very interesting post/graphic on that subject today. Note by the way that we moved onto point #2 in the other discussion thread, if you have any input on the subject. -
pielkesr at 02:50 AM on 13 October 2011Pielke Sr. and SkS Warming Estimates
dana1981 - The IPCC, however, does not adequately discuss the possible role (and relative contributions) of land use change and other non-GH forcings in allering major atmospheric/ocean circulations. This is why we need more than one metric, as we recommended the 2005 NRC report [which was only superficially referenced by the 2007 IPCC report]. -
pielkesr at 02:47 AM on 13 October 2011Pielke Sr. and SkS Warming Estimates
Hi Albatross - Sorry - I sent the wrong url. I cannot find the actual url of the 2nd press release(perhaps someone else can), but I have reproduced the e-mail below where I read it from the e-mail below From: Tanja Suni
Prev 1443 1444 1445 1446 1447 1448 1449 1450 1451 1452 1453 1454 1455 1456 1457 1458 Next


