


 Arguments


Recent Comments
Prev 1453 1454 1455 1456 1457 1458 1459 1460 1461 1462 1463 1464 1465 1466 1467 1468 Next
Comments 73001 to 73050:
-
Kevin C at 23:11 PM on 6 October 2011Pielke Sr. and SkS Disagreements and Open Questions
Thanks, that's very exciting. Obviously they're way ahead of me. I've only just worked through the mathematics for formally determining the uncertainties on the parameters, but not implemented it yet. I'm not familiar with Kalman filters, but I'm guessing they are more sophisticated than my ad-hoc spline basis functions. It's reassuring though that I'm not doing something stupid, and that we get very similar answers. I'll need to get a copy of the full paper, but reading between the lines of the abstract I think they may have left me one wrinkle to work on. :) (Fixed link to abstract) -
jyyh at 22:28 PM on 6 October 2011Graphics for Sea Ice Minimum 2011
The 365-day anomaly graph would be very cool to see displayed on a map where the number of days of ice cover on a given map point would be color coded. -
Tristan at 22:16 PM on 6 October 2011Lessons from Past Climate Predictions: Arctic Sea Ice Extent
JMurphy, what you fail to understand* is that 1998 was actually the warmest year on record and the earth** has been cooling since. In fact, disingenuous warmists*** like Willis have had to massage the data to keep the warming myth going. (definitions) *believe, rabidly **select measurements of temperature, over select time scales, measured by select individuals and using select statistical methods *** scientists who don't agree with our perspective -
Bob Lacatena at 22:13 PM on 6 October 2011Review of Rough Winds: Extreme Weather and Climate Change by James Powell
199, Norman, Nobody is missing the point you are making. It is very clear. You are trolling this thread by littering it with comments of anecdotal evidence of a variety of extreme weather events, in an effort to persistently and endlessly argue the illusory and emotional points of view that weather is weather and weather is variable and there always have been weather extremes so no one can prove to you that more and worse extremes really are such. You can find evidence of past weather extremes. We get that. No one denies this. You don't understand how climate change could increase weather extremes. We get that. We understand, even if you don't. You don't believe that the plethora and severity of recent weather events is unusual. We get that. You are wrong. In the end, all you are doing is trying to post as many comments as you can restating these erroneous points over and over again, but without actually listening to what others are saying, or admitting that your anecdotal approach is invalid, unscientific, and will lead to invalid and unscientific conclusions. -
damorbel at 22:06 PM on 6 October 2011The 2nd law of thermodynamics and the greenhouse effect
Re #305 You wrote:- "So would you agree that there has been a transfer of thermal energy from A to B, in the sense that photons have been radiated from A and been intercepted by B, these photons have taken thermal energy from A and contributed thermal energy to B? Do you also agree that this is true regardless of the temperatures of A and B (provided ....?" I'm afraid the question isn't clear enough for me. Perhaps you can help. 1/Are energy carrying photons also radiated by B? 2/If so are they intercepted by A? 3/And if they are intercepted by A, does that mean that thermal energy is transferred from B to A?Moderator Response: [Dikran Marsupial] Those are issues for a more advanced step and are irrelevant to the question. If thermal energy has been taken from A and added to B via radiation and absorption of a photon, then there has been a transfer of energy, regardless of what else is ocurring. This seems pretty much the dictionary definition of "transfer" The conveyance or removal of something from one place, person, or thing to another. In this case thermal energy (the "something") has been conveyed from A (the "place") to B (the "another [place]"), via radiation and absorption of a photon. Do you agree that this has happened and that it falls within common usage of the word "transfer", as explained above? -
chriskoz at 22:03 PM on 6 October 2011Lessons from Past Climate Predictions: Arctic Sea Ice Extent
I postulate that any attempt to determine if Goddard is possibly right in his predictions is like arguing about the accuracy of stopped clock. He maybe right only by coincidence, and about an irrelevant detail. -
Norman at 21:53 PM on 6 October 2011Review of Rough Winds: Extreme Weather and Climate Change by James Powell
KR @ 197 I think you are missing the point I made in post 186. "I find it disingenuous in the extreme that you claim not to be discussing global patterns, while stating you don't see any evidence for extreme weather - which is almost by definition a global measure." I have not stated in any post, that I can think of, that there is not extreme weather. I was pointing out that what would be extreme for other locations (number and frequency of hot and cold snaps, 12 in about 2 years) is the normal where I live. Muoncounter points out that Belgium used to have a heat wave once every 8 years and now has one every year. Which is a significant change for them. I was explaining why it is more difficult for me to be aware of extreme weather changes (since it would be in the more abstract world of statistics and graphs) than for others on this planet. They are experiencing changes in weather patterns directly but I have experienced no changes on notice as the weather in Omaha is already more extreme than many other locations. As I stated the purpose of the data I posted was not an attempt to prove or disprove the content of James Powell ebook. -
chriskoz at 21:34 PM on 6 October 2011Lessons from Past Climate Predictions: Arctic Sea Ice Extent
JMurphy @16, That's a natural human perception objectivity: snow is "cold" so think about it if you don't believe in global warming. If you add windchill, it's much colder than calm air with an absolute temperature even 10-20C less. But because it "feels" colder, it's perfect to argue that the heavy, snowy winter we just had in US or Europe heralds the end of global warming. But in terms of absolute temperature rather than "perceptual coldness" it may actually be opposite. So much for the perceptive manipulation by skeptics. As for the accuracy of the Goddard prediction we are talking about here, he appears to have choosen the right words as to avoid talking about the main long term problem, the long term loss of ice. Talking about possible increase of 5y ice percentage is just obvious when we had a short term increase of 1-2y ice percentage in 2008-9. -
damorbel at 20:41 PM on 6 October 2011The 2nd law of thermodynamics and the greenhouse effect
Re #304 You wrote:- "Moderator Response: [Dikran Marsupial] so those photons that strike and are absorbed by B, do they add to the thermal energy of B?" Yes.Moderator Response: [Dikran Marsupial] So would you agree that there has been a transfer of thermal energy from A to B, in the sense that photons have been radiated from A and been intercepted by B, these photons have taken thermal energy from A and contributed thermal energy to B? Do you also agree that this is true regardless of the temperatures of A and B (provided A is above zero Kelvin)? -
JMurphy at 20:01 PM on 6 October 2011Between St. Roch and a cold place
I have just noticed that the link in the actual Skeptical Argument (accessible at Northwest Passage has been navigated in the past) does contain a link to the St. Roch at the Vancouver Museum, which also contains a link to a virtual tour of the ship.
-
JMurphy at 19:47 PM on 6 October 2011Lessons from Past Climate Predictions: Arctic Sea Ice Extent
John Brookes, not that I go to WUWT very often (because it makes my brain hurt, and not in a 'good' way), but I don't believe they often mention record warm temperatures, heat-waves, etc. - only cold ones. Or when it snows. Seems a bit strange...not ! -
damorbel at 18:52 PM on 6 October 2011The 2nd law of thermodynamics and the greenhouse effect
Re #303 You wrote:- "Moderator Response: [Dikran Marsupial] Good. do you agree that some of the photons emitted by A will strike and be absorbed by B, regardless of the temperatures of A and B?" "regardless of the temperatures of A and B?" As long as A is above 0K, Yes.Moderator Response: [Dikran Marsupial] Super, so those photons that strike and are absorbed by B, do they add to the thermal energy of B (i.e. cause B to have greater thermal energy that it would otherwise have done, had it not intercepted the photons from A)? -
GEP at 17:13 PM on 6 October 2011Understanding climate denial
I came here hoping to understand climate denial, and now I think I do. Thank you all. -
les at 16:35 PM on 6 October 2011Book review: The Inquisition of Climate Science
Maybe. But the pope didn't get annoyed with Galileo over the technical merits of his science - which was largely accepted by the church astronomers - but because he defied his theological authority. -
damorbel at 16:32 PM on 6 October 2011The 2nd law of thermodynamics and the greenhouse effect
Re #302 You wrote:- "Moderator Response: [Dikran Marsupial] Good. Do you agree that the photons radiated from body A are carrying away some of the thermal energy from body A with them?" YesModerator Response: [Dikran Marsupial] Splendid, do you agree that some of the photons emitted by A will strike and be absorbed by B, regardless of the temperatures of A and B? -
Stevo at 15:52 PM on 6 October 2011Between St. Roch and a cold place
adelady, thankyou. Nice to have that cleared up. Moderator (JMurphy) @3. No worries. Without wanting to drag the thread off topic, you've pretty much got the definition right but just like climate science this is a complex topic. Suffice to say "All icebreakers are ships" is a pretty safe rule to apply. -
Albatross at 15:38 PM on 6 October 2011Review of Rough Winds: Extreme Weather and Climate Change by James Powell
muoncounter @194, Thanks for those papers, and did you see the citation below the Barriopedro et al. (2011) paper? It links to Zhao and Running's response to critique of their 2010 paper in which they found a decline in net primary production between 2000 and 2009 on account of an increase in droughts (primarily in the S. Hemisphere). Well, they have addressed the critics and in doing so they conclude that: "Samanta et al. and Medlyn challenge our report of reduced global terrestrial net primary production (NPP) from 2000 through 2009. Our new tests show that other vegetation indices had even stronger negative changes through the decade, and weakening temperature controls on water stress and respiration still did not produce a positive trend in NPP. These analyses strengthen the conclusion of drought-induced reduction in global NPP over the past decade." And "Our continuous monitoring shows that global NPP in 2010 (53.19 Pg C) was lower than that in 2009 (53.84 Pg C), largely due to the two large-scale droughts in the Amazon and Europe. We expect that the strongest impacts of changing climate on terrestrial ecosystem productivity will continue to be manifested through the hydrologic cycle, but whether these current trends continue can only be answered by global monitoring." Not "cheering" news.... -
nealjking at 15:16 PM on 6 October 2011Book review: The Inquisition of Climate Science
It's also true that the advantage of the Copernican over the Ptolemaic theory was by no means as overwhelming as is commonly depicted: The difference in complexity was rather slight, as both used epicycles, etc. So I agree with the point that the Inquisition had a better case on Galileo than the "skeptics" have on climate scientists. -
dana1981 at 15:06 PM on 6 October 2011Michaels Mischief #3: Warming Island
Regarding the GISTEMP method, it's important to note that they use a weighted average. A station 1200 km away from a certain location does not have the same weight on its estimated temperature as a station 100 km away. Although it's less than the 1200 km value, 800 km is still a large distance away from Warming Island. While the temps in the two locations are correlated, it's not accurate to assume they're nearly identical, as Michaels has basically done. -
Review of Rough Winds: Extreme Weather and Climate Change by James Powell
Norman First you say: "Here is the data I have so far and will demonstrate that heat waves and cold snaps seem very routine for my area and it might be why I am not as quick to see evidence that extreme weather is increasing." Followed by: "Nor was my data selection designed to prove or disprove anything about global patterns." I find it disingenuous in the extreme that you claim not to be discussing global patterns, while stating you don't see any evidence for extreme weather - which is almost by definition a global measure. You are cherry-picking. Again. And presenting it as some kind of argument against the statistics and studies. At this point, Norman, I will have to consider you a troll. -
Glenn Tamblyn at 14:41 PM on 6 October 2011Lessons from Past Climate Predictions: Arctic Sea Ice Extent
Sad news abour AMSR-E. However Cryosat-2 ha been up since last year, has completed its calibration work-up and is starting to produce data. Hopefully within a year we will see results from it. It will provide a backup to PIOMASS that isn't partly model based. The trends on PIOMASS are probably why extent isn't as reliable a guide to future collapse. Effectively ice thickness equals mechanical strength. So more and more thin ice is weaker and liable to collapse due to break-up, not just melting in-situ. My bet from PIOMASS is effectively Ice-Free (apart from isolated pockets) by 2016/17. -
adelady at 14:36 PM on 6 October 2011Between St. Roch and a cold place
Stevo, yes. 2007 was noteworthy for a strong dipole, winds circulating around the Arctic and compacting lots of ice together in the centre. The movement at the edge was, predictably, quite strong in pushing outwards through Fram Strait. The result ... a huge drop in extent. This year no such strong weather events. A lot of ice just wandered about - much of it into ice-free warm water areas which promptly melted it in place. -
Tom Curtis at 14:33 PM on 6 October 2011Lessons from Past Climate Predictions: Arctic Sea Ice Extent
Djon @4, based on pixel counts, the percentage and extent (in million km^2) of multi-year ice in 2010 and 2011 are as follows: ____________2010__Area___2011__Area__Survival 1 year ice: 53.2% 2.61 | 49.6% 2.29 | xxxxxx 2 year ice: 29.9% 1.47 | 27.1% 1.25 | 47.9% 3 year ice: 07.8% 0.38 | 17.4% 0.80 | 54.4% 4 year ice: 03.6% 0.18 | 02.2% 0.10 | 26.3% 5 year ice: 05.1% 0.25 | 03.9% 0.18 | 41.8% From the area, it was possible to calculate what proportion of 1 year ice in 2010 survived to become 2 year ice in 2011, and so on. Survival for 5 year ice is the ratio of 2011 5 year ice to the sum of 2010 for and 5 year ice. In order for there to be an "uptick" in five year ice in 2012, that would require a survival rate of 4 and 5 year ice in 2012 greater than 64%. If, as expected, sea ice extent declines, or even if it remains constant, that appears unlikely. On the other hand, sea ice extent will have to decline to around 3 million km^2 in 2013. Of course, if the spur of old ice from the North Pole to the Russian coast does not survive the next two years, all bets are off. With regard to your point that Goddard predicted ice age, not ice thickness, you are technically correct. However, ice thickness is a function of ice age, so that there cannot be an increase in ice thickness without a commensurate increase in ice age. Furthermore, any increase in extent of old ice will ipso facto be accompanied by an increase of ice thickness, or at minimum, a cessation of the continuing declining trend. As it happens, the decline in sea ice volume in 2011 of about 10% approximately matches the decline in area suggesting that most of the loss of sea ice volume is accounted for by that decline in area. That would suggest the increase in three year ice has more or less compensated for the decline in sea ice extent for ice of all other ages. So, and contrary to Dana, Goddard did get both his actual and his implicit prediction right. Specifically, sea ice extent of multi-year ice increased from approximately 2.29 million km^2 to 2.32 million km^2. The sea ice thickness remained approximately constant or even slightly increased, and there may well be an increase in 5 year ice in 2013 (although there will be a sharp reduction in 2014). Contrary to AndyWeissDC (in comments at Goddard's site), Goddard being correct in his prediction is not "a death blow to the alarmist cause". For a start, there is no "alarmist cause", merely a recognition of the actual scientific facts leading to considerable alarm. More importantly to this thread, even though Goddard was right, both arctic sea ice area and volume declined by about 10% relative to 2010. Goddard chose to make predictions on topics that give no indication of overall decline or recovery of sea ice. He did so, I suspect, to distract people from the ongoing death spiral in Arctic sea ice extent.
-
citizenschallenge at 14:33 PM on 6 October 2011Northwest passage has been navigated in the past
WOW First class post! Thank you for that information -
Albatross at 14:32 PM on 6 October 2011Review of Rough Winds: Extreme Weather and Climate Change by James Powell
Adelady @195, No worries :) -
adelady at 14:28 PM on 6 October 2011Review of Rough Winds: Extreme Weather and Climate Change by James Powell
Thanks for these Albatross. My non-scientific intuition has been that blocking extents would follow the other major influences we see. (Here we see the expansion of the Hadley cell moving rainfall further south - therefore not on land at all, but into the nearer Southern Ocean. And depriving us of our longterm average rainfall by dropping into the ocean which already has quite enough. Probably shifting the 'Goyder line' further south, thereby depriving us of cropping land.) I can see no good reason why other large scale meteorological circulation effects shouldn't also get in on the act. I've not been so assiduous in reading full papers recently, but these'll get the full treatment. -
muoncounter at 14:22 PM on 6 October 2011Review of Rough Winds: Extreme Weather and Climate Change by James Powell
Here's a neat way of looking at these summers: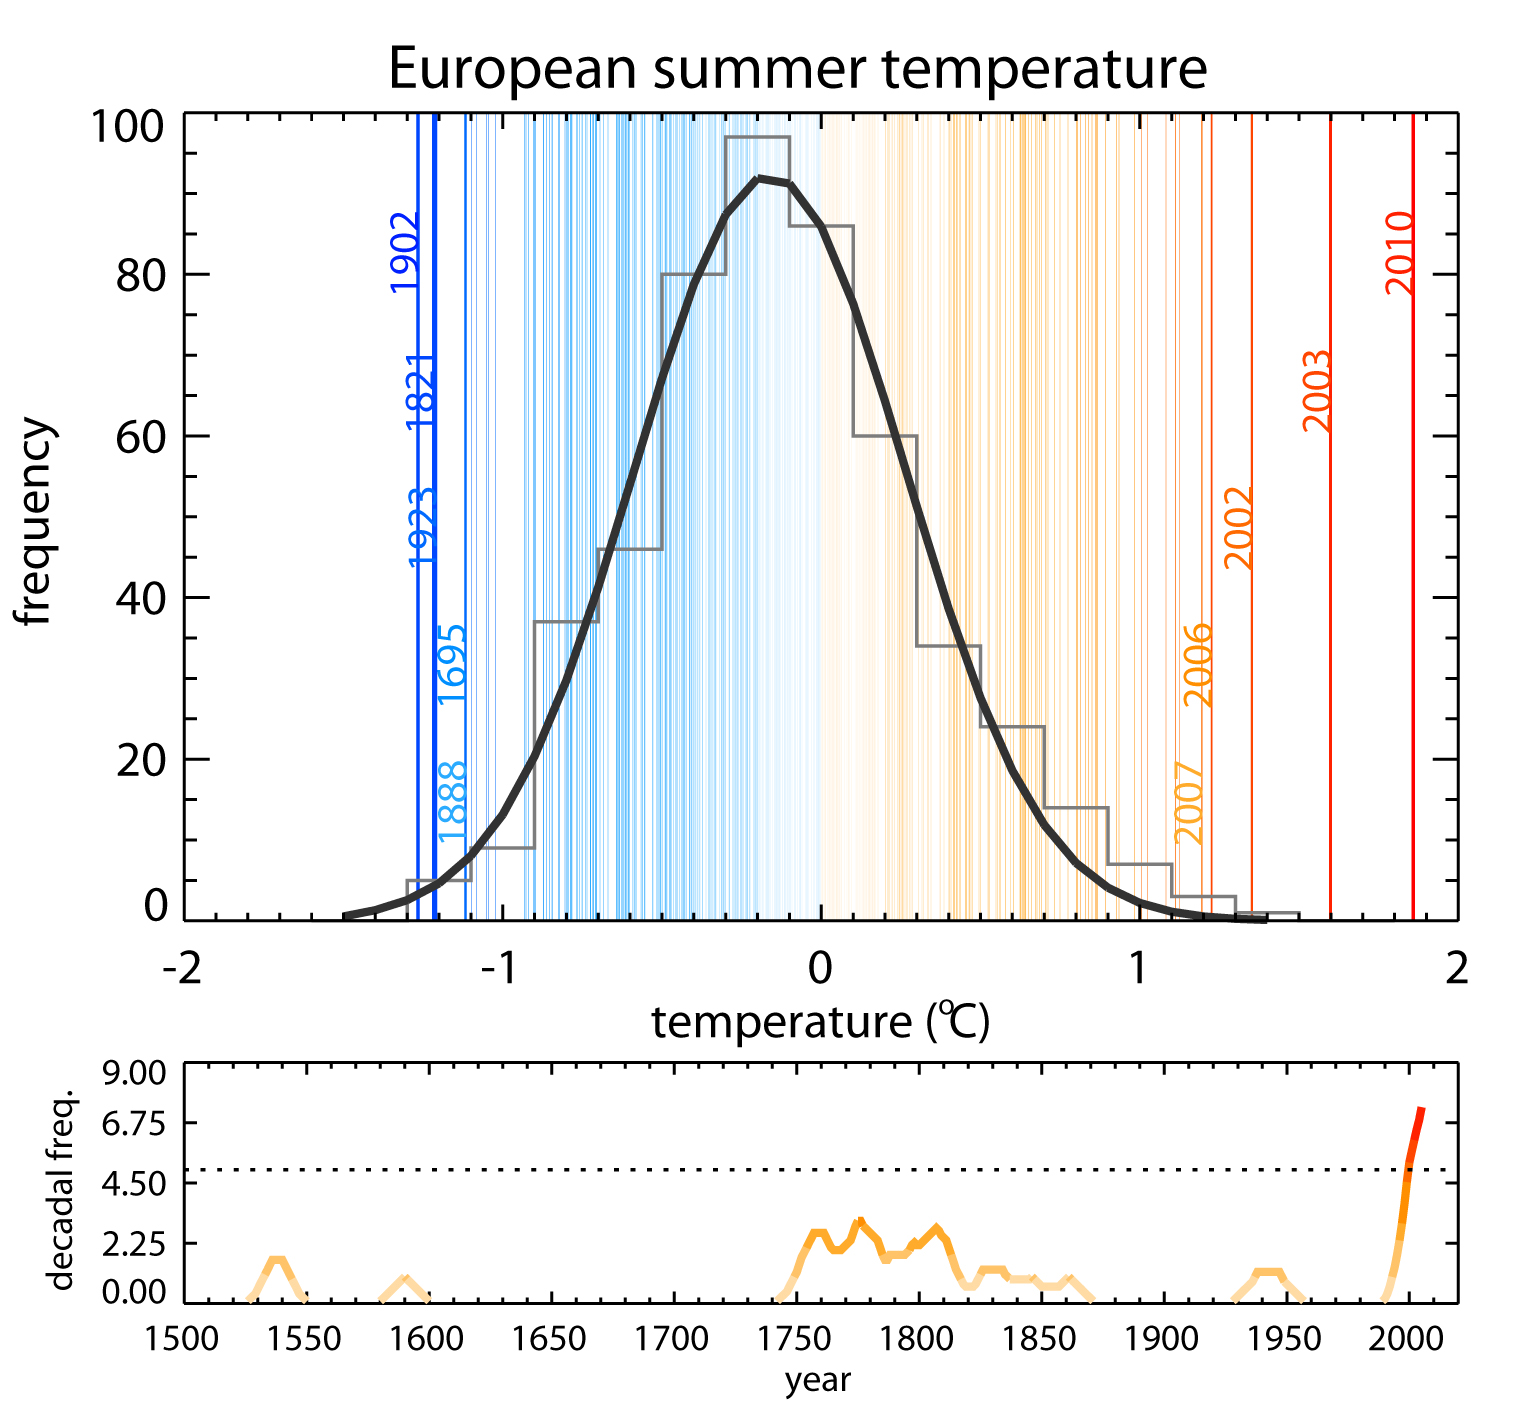 --source
The five warmest and coldest summers are highlighted. Grey bars represent the distribution for the 1500-2002 period, with the curve in black showing how common a given temperature is. The bottom panel shows frequency of extreme summers by decade. Dotted line shows maximum decadal values that would be expected by random chance.
And then there's this tidbit:
Russia alone saw more than 55,000 heat-related deaths, extensive wildfires, and approximately 25 percent crop failure last year. The total economic loss was around 1 percent of Russia’s gross domestic product, according to preliminary estimates referred to by the European scientists.
--source
The five warmest and coldest summers are highlighted. Grey bars represent the distribution for the 1500-2002 period, with the curve in black showing how common a given temperature is. The bottom panel shows frequency of extreme summers by decade. Dotted line shows maximum decadal values that would be expected by random chance.
And then there's this tidbit:
Russia alone saw more than 55,000 heat-related deaths, extensive wildfires, and approximately 25 percent crop failure last year. The total economic loss was around 1 percent of Russia’s gross domestic product, according to preliminary estimates referred to by the European scientists.
-
Albatross at 14:17 PM on 6 October 2011Review of Rough Winds: Extreme Weather and Climate Change by James Powell
There has been talk of blocking again on this thread. An expert in the field Dr. Lipo recently had this to say at ScienceDaily: "Lupo believes that heat sources, such as radiation, condensation, and surface heating and cooling, have a significant role in a blocking's onset and duration. Therefore, planetary warming could increase the frequency and impact of atmospheric blocking." "It is anticipated that in a warmer world, blocking events will be more numerous, weaker and longer-lived," Lupo said. "This could result in an environment with more storms. We also anticipate the variability of weather patterns will change dramatically over some parts of the world, such as North America, Europe and Asia, but not in others." I highly recommend this PhD thesis by Jana Sillmann titled "Extreme Climate Events and Euro-Atlantic Atmospheric Blocking in Present and Future Climate Model Simulations" From the abstract: "This comparison shows that the model is able to realistically capture the observed climatological large-scale patterns of the extreme indices, although the quality of the simulations depends on the index and region under consideration. In the future climate, as represented by the IPCC emission scenarios B1 and A1B, all considered temperature-based indices (yearly minimum and maximum temperatures and frequency of tropical nights) encounter a significant increase worldwide. The precipitation-based indices (max. 5-day precipitation amount and 95th percentile of precipitation) also increase significantly, particularly in those regions that are relatively wet already in present climate. Analogously, dry spells increase especially in regions with dry conditions under present climate." And "Blocking frequencies and their seasonal distribution are well captured by the model and especially for the winter minimum temperature significant correlations with blocking events are found in central Europe. In the future climate, the blocking frequency is slightly diminished but the influence on the European winter climate remains robust." Her research has been published, see Sillmann and Croci-Maspoli (2009), and Sillmann et al. (2011). See also this conference paper by Lupo et al. (2008), they looked at trends in blocking between 1970 and 2007 and found that: "In the NH, the most important result was that the recent increases in blocking were hemisphere-wide, but the increase was slower in the Atlantic region. These increases in blocking occurrence this study agreed with the results of the Lupo et al. (1997) which implied more blocking activity in a warmer world." Might need to look at other indices, other than blocking indices, for example, Alessandro (2011). -
Rob Painting at 13:55 PM on 6 October 2011The Deep Ocean Warms When Global Surface Temperatures Stall
Micawber @ 31- "What first alarmed me was the graphic at the beginning of the post. “Ocean Heat Content 1955 – 2008” Enough of the emotive content thanks. Try to restrict yourself to discussion of the topic at hand. Peppering otherwise reasonable-ish posts, with allegations of scientific misconduct and other snark, is akin to a waiter spitting a big goober into a diner's well-prepared meal - it's extremely bad manners, and will ensure deletion in the future. And please note that ship-based water intakes and buckets have absolutely nothing to do with measurements of ocean heat down to 700 metres - as Tom Curtis has already pointed out. -
Stevo at 13:53 PM on 6 October 2011Between St. Roch and a cold place
Bern @6 I'm curious about "weather wasn't good for ice melt and compaction". Does this relate to wind and current conditions which push the ice together as opposed to dispersing it, or is it more complex than that? -
muoncounter at 13:43 PM on 6 October 2011Review of Rough Winds: Extreme Weather and Climate Change by James Powell
Norman "I live in an area where extreme weather patterns are already the norm" If they are the norm, they are by definition not extreme. Extreme: of a character or kind farthest removed from the ordinary or average Norm: general level or average The quote in 190 evidently didn't impress you, so I'll repeat it: Before 1990 a heat wave occurred about once every 8 years, but during the last decade the country averages one heat wave per year. Once again, let's look to some relevant science. Barriopedro et al 2011: We provide evidence that the anomalous 2010 warmth that caused adverse impacts exceeded the amplitude and spatial extent of the previous hottest summer of 2003. "Mega-heatwaves" such as the 2003 and 2010 events broke the 500-year-long seasonal temperature records over approximately 50% of Europe. --emphasis added Two heat waves, 7 years apart both broke 500 year records on a continental scale. Now that's extreme! -
Norman at 13:16 PM on 6 October 2011Review of Rough Winds: Extreme Weather and Climate Change by James Powell
muoncounter @ 190 "The absolute numbers are less important than the proof of concept: aerosols and greenhouse gases are measurably changing temperatures and precipitation on the 50 year time scale. The effect is real and ongoing; all the hot days and cold days in Omaha cannot disprove that." Nor was my data selection designed to prove or disprove anything about global patterns. "I don't think 2 years of temperature data demonstrates anything other than you live in the midwestern US, far from the supposedly moderating influence of an ocean. The Old Farmers Almanac could tell you that." It does demonstrate I live in an area where extreme weather patterns are already the norm. But on a personal note, people complain about severe cold much more then the really hot days in my area of the world. A 97 F (heat wave in Belgium) in Omaha just means a nice swimming day. And you being from Texas know heat quite well but you probably would hate -20 F mornings. I think the link that Anne-Marie Blackburn posted in 181 is very useful as it does suggest linking mechanisms that I have been asking for, changes in atmopheric circulation patterns. -
muoncounter at 12:35 PM on 6 October 2011Lessons from Past Climate Predictions: Arctic Sea Ice Extent
John Brookes#12: "one of them will make a prediction that is pretty close," You know what they say about stopped clocks. -
muoncounter at 12:32 PM on 6 October 2011Review of Rough Winds: Extreme Weather and Climate Change by James Powell
Norman#186 "I am posting the data to demonstrate the frequency of hot and cold extremes in the area where I live." I don't think 2 years of temperature data demonstrates anything other than you live in the midwestern US, far from the supposedly moderating influence of an ocean. The Old Farmers Almanac could tell you that. Here is what you are competing with: Belgium experienced two heat waves in July 2006. Before 1990 a heat wave occurred about once every 8 years, but during the last decade the country averages one heat wave per year. --emphasis added You can read the remaining details for yourself. But let's try some science for a change. Bichet et al 2011: We show that between 1870 and 2005, prescribed SSTs (encapsulating other forcings and internal variability) determine the decadal and interannual variabilities of the global land temperature and precipitation, mostly via their influence in the tropics (25S–25N). ... between 1930 and 2005 increasing aerosol emissions have reduced the global land temperature and precipitation by up to 0.4C and 30mm/yr, respectively, and that between about 1950 and 2005 increasing greenhouse gas concentrations have increased them by up to 0.25C and 10mm/yr, respectively. Finally, we suggest that between about 1950 and 1970, increasing aerosol emissions had a larger impact on the hydrological cycle than increasing greenhouse gas concentrations. The absolute numbers are less important than the proof of concept: aerosols and greenhouse gases are measurably changing temperatures and precipitation on the 50 year time scale. The effect is real and ongoing; all the hot days and cold days in Omaha cannot disprove that. "authors such as James Powell would help people on the fence of this issue " Question: Are you on the fence on this issue? -
John Brookes at 12:26 PM on 6 October 2011Lessons from Past Climate Predictions: Arctic Sea Ice Extent
I can't believe all those WUWT people could be so wrong! They always seem so wise, whenever I drop in there. One only has to see the level of scorn they heap on non-believers to realise just how much they must know. But don't worry. One year, one of them will make a prediction that is pretty close, and then the rejoicing and mutual back patting will be a thing to behold. A quick check at WUWT reveals a lot of recent posts, but none discussing the annual arctic sea ice minimum. I wonder why they aren't interested in it? -
Tom Curtis at 12:14 PM on 6 October 2011The Deep Ocean Warms When Global Surface Temperatures Stall
Micawber @35, Peter Hogarth @37 has stolen most of my thunder, so I recommend you read his comment carefully. Again, it is vitally important that you distinguish between Sea Surface Temperatures, to which comments about buckets and intakes are relevant, and Ocean Heat Content, to which they are not. The former is of topic in this thread, while the later is not. There are measurement issues with both, but they are not the same issues. With regard to OHC, I have nothing useful to add to that which Peter (and Albatross) have already provided. With regard to SST, I recommend you read the review article by Kawai and Wada, 2007. Of particular interest to you would be table 1 which indicates the sub-layer normally measured by different instrument types. Kawai and Wada conclude with a discussion of the implications of diurnal and seasonal differences in temperatures between SS sub-layers on modelling and on observational data. In addition to Kawai and Wada, you may wish to refer to Science of Doom's discussion of SS sub-layers, if for no other reason than the list of relevant papers he provides. Having been through those papers, perhaps you would then like to raise these issues on a relevant topic. In the meantime I will simply note that your concerns that these issues are not being addressed by detailed observations by scientists is misplaced. -
Norman at 12:11 PM on 6 October 2011Review of Rough Winds: Extreme Weather and Climate Change by James Powell
skywatcher @ 180 "So you accept that the globe is hotter and there is more water vapour in the air? This is a good start! Do you also accept that hotter air temperatures will lead to more evaporation, faster drying out of the land, and once the land is dry, even higher temperatures (as the energy isn't used in evaporation)? And do you accept that more water vapour in the air golobally leads to increased precipitation globally (what goes up must come down)? Do you think all this precipitation is drizzle?" I can agree with all the statements you made. The question is not about increased air temperatures or more rainfall. It is about extreme events increasing. That is where the uncertainty lies. Even if I agree with the statements in your quote, it does not lead to the certainty that extreme events will increase. They may very well do this, I do not know, but I would wish to know with greater certainty with some empirical data and good linking mechanisms. It is not a linking mechanism to say warmer average temps will lead to more extreme temps or that more moisture in the air will lead certainly to more extreme rainfall amounts. You are the one who linked to the Stu Ostro document. This meterologist goes to great length to demonstrate that extreme weather events are caused by blocking patterns...ridges and troughs at the 500 mb level in the atmosphere. He does not go to equal lengths to demonstrate that these are increasing because of global warming. -
Norman at 11:58 AM on 6 October 2011Review of Rough Winds: Extreme Weather and Climate Change by James Powell
muoncounter @ 182 "Please avoid citing disinformation denial sites as 'references;' a practice that does little save damage your credibility." I did post the link with this caution: "if you ignore the author's opinions at the end of the document you can see if his analysis is valid." The point of the link was that it demonstrated a linking mechanism to explain heat waves in Europe (blocking patterns). My suggestion is that authors such as James Powell would help people on the fence of this issue by demonstrating links on how global warming will increase these blocking patterns in the atmosphere and why it will do so. -
Norman at 11:54 AM on 6 October 2011Review of Rough Winds: Extreme Weather and Climate Change by James Powell
muoncounter I forgot to label the data but I did infer it. The temps posted are temperature deviations from normal highs. Recorded temperature high minus normal high temperature. -
Norman at 11:52 AM on 6 October 2011Review of Rough Winds: Extreme Weather and Climate Change by James Powell
muoncounter @ 182 I have been logging temperature data for Omaha Nebraska for a while (683 days of data). I guess where I live extreme weather is not as big a deal as in Texas as we have extremes quite often. Both hot and cold. If a heat wave is 5 consecutive days with temps 9F above the normal average, I will call a cold snap a period where the high temp is below 9F from the normal high for 5 consecutive days. Here is the data I have so far and will demonstrate that heat waves and cold snaps seem very routine for my area and it might be why I am not as quick to see evidence that extreme weather is increasing. December 2009 (cold snap): -11,-18,-9,-22,-15,-10 January 2010 (cold snap): -16,-20,-30,-23,-27,-23,-14,-22,-31,-24 February 2010 (cold snap): -10,-10,-11,-17,-18,-24,-17 March 2010 (heat wave): 15,19,23,29,11 (here is one where a heat wave might be welcome...the normal high for Omaha during this time is 58F during the heat wave it was in the 70's and 80's) April 2010 (heat wave): 12,20,19,14,13 May 2010 (cold snap): -16,-14,-9,-17,-15,-22,-13 November 2010 (heat wave): 13,22,20,21,10 March 2011 (cold snap): -10,-13,-17,-20,-15,-11,-17,-10,-11 April 2011 (cold snap): -10,-14,-21,-12,-14 May 2011 (heat wave): 10,9,15,25,26,9 September 2011 (cold snap): -16,-20,-24,-22,-12 Please note muoncounter. I am not using this data to form any global conclusions about trends. I am posting the data to demonstrate the frequency of hot and cold extremes in the area where I live. From the perspective I know, weather extremes are very normal. Severe storms and numerous tornado warnings in the summer, blizzards and bitter cold in the winter, extremely wet flooding years and then very hot dry drought years. If I lived in a location with more stable weather over long periods to be interupted by some very unusual weather events, I may have a different attitude to these threads. -
rickplan at 11:49 AM on 6 October 2011Between St. Roch and a cold place
RE #9 The Manhattan did not accomplish the feat on its own; in addition to the Canadian icebreaker, it was accompanied by a US Coast Cutter icebreaker (have forgotten the name). A friend of mine was a mechanic on the Coast Guard ship. I remember his slide shows when he returned from the trip. There was a lot of ice and very little open water. -
Norman at 11:34 AM on 6 October 2011Review of Rough Winds: Extreme Weather and Climate Change by James Powell
muoncounter @ 182 Your link to the definition of Heat Wave: "The definition recommended by the World Meteorological Organization is when the daily maximum temperature of more than five consecutive days exceeds the average maximum temperature by 5 Celsius degrees (9 Fahrenheit degrees), the normal period being 1961–1990.[3]" This may not work to be the definition. Would it be considered a heat wave in the northern states if it was 9F warmer in January? Or would this be a most pleasant condition. -
Norman at 11:30 AM on 6 October 2011Review of Rough Winds: Extreme Weather and Climate Change by James Powell
Anne-Marie Blackburn @ 181 It would seem the most likely culprit for many examples of extreme weather events (drought, high heat, cold, excess rainfall other than hurricane) are the blocking high events (example: in winter in US a strong high pressure system that does not move much will pump very cold air down from Canada and lead to very frigid conditions. In summer a similar pattern can prevent storms from moving into areas cooling them leading to drought and heat waves, drenching rains can take place as the blocking high routes the storm systems over the same saturated areas leading to floods). A strong link to connect global warming to extreme weather events would be a way to show that global warming leads to more blocking events that last longer and cover larger areas. -
Norman at 11:25 AM on 6 October 2011Review of Rough Winds: Extreme Weather and Climate Change by James Powell
Anne-Marie Blackburn @ 181 Your link is not active, I would like to see the article. "With regards to the European heat wave, I understand that anomalous meteorological conditions were the main cause of the event, but I don't see how, without a quantitative analysis, you can conclude that human-induced global warming did not contribute to the event. Nor can you state categorically, of course, that global warming did contribute to it." I would not form such a conclusion. Your post is the same point I have been making. But if it is difficult to conclude one way or the other then it perhaps is a weak link or the signal should be stronger. I have stated, in various posts, that I am not making any statements of certainty about global warming's effect on extreme weather events. I am questioning what appears to be a thinking that extreme weather events are on the increase and the cause is global warming. A quote from your review of James Powell book "But climate change, through rising temperatures and water vapour levels for example, is changing the odds of extreme events occurring." I am not certain of this statement without some good empirical supporting data. I do believe the data is out there in the many data basis of historical collected data but I would not be able to compile it. Perhaps a large study done by graduate students in the field of climatology or meterology.Moderator Response: [DB] Fixed link in 181. -
Michael Hauber at 11:00 AM on 6 October 2011Lessons from Past Climate Predictions: Arctic Sea Ice Extent
The Search Outlook has been running since 2008 making sea ice predictions each year. The 2008 outlook predicted a minimum similar to 2007 with some above and some below. The actual 2008 sea ice ended in the upper range of these predictions, but not spectacularly so. In 2009 the Search Outlook predicted sea ice conditions not too far off 2007, but more predictions were for above than below. However in the end every single prediction was too low. There was one prediction at 3.2m, the rest between 4.2 and 5, and the actual result was above 5.3m. The 'skeptics' were quite pleased with this failure and I remember many comments about how incompetent the scientists were and that any average Joe could do better. And then next year the 'skeptic' side made the attempt and as you documented they mostly did fairly badly. However one success on that side was Joe Bastardi in 2010 predicting that the minimum that year would be quite low. But even back then he was predicting the recovery in 2011 would be very strong and that of course has failed badly. Of note is that the scientists were overly pessimistic in 2008 and 2009, and seem to have learned from these mistakes and provided much more accurate predictions. The 'skeptics' mocked the initial mistakes, then preceded to make worse predictions of their own, and then come back next year to make exactly the same mistake again. It will be interesting to see how the more aggressive predictions of mostly ice free by late this decade that have been around for a few years now go. PIOMAS has continued to decline on track with this prediction, but satellite measures of extent seem way behind and something like 2030 seems more reasonable based on extent. -
logicman at 10:56 AM on 6 October 2011Between St. Roch and a cold place
JMurphy: that Wikimedia image is 100% not USS Skate at the pole in 1959. Skate was the first sub to surface at the pole. In March 1959 she surfaced through fairly thick ice having found no nearby open water in which to surface. The crew stood on that ice as they held a memorial service for Sir George Hubert Wilkins, MC and Bar, and scattered his ashes. I have the book - Surface at the Pole, Commander James Calvert, USN - and have covered this pseudo-skeptic meme in my blog on a few occasions, notably: science20.com/chatter_box/arctic_ice_october_2010 -
DSL at 09:29 AM on 6 October 2011Increasing CO2 has little to no effect
Aye, agreed. -
Understanding climate denial
Philippe Chantreau - Indeed, Dr. Pielke did make some comments decrying anonymous posters, and I have heard that others have experienced issues on some sites. Just noting that I have not (again, so far). I usually consider such attacks (as they are not arguments) an Argument from Authority fallacy. I much rather prefer discussions based on what is said, rather than based on who said it. -
Rob Honeycutt at 09:24 AM on 6 October 2011Increasing CO2 has little to no effect
DSL... I think we're saying the same thing. The point I'm trying to make to Alleycat is to be careful what you ask for. The "correction" may take more the form of a "hard reset" than a nice soft bounce back. I think skeptics sometimes find comfort in the idea that the planet will pull all that carbon back out of the atmosphere naturally. And that's realistic... over the next 10+ million years. I, for one, don't care much about what the planet will be like in that amount of time. What I care about is that we at least try not to create undue (and avoidable) hardships on near term future generations. As it is already, with another, what, 0.6C of warming baked into the system and not a lot of progress towards significantly changing our ways, the latter half of the 21st century is going to be pretty hellish for billions of less well off people. It's awful but I don't think that is avoidable. What I hope is still avoidable is that hard reset. -
GFW at 09:19 AM on 6 October 2011Lessons from Past Climate Predictions: Arctic Sea Ice Extent
So, I looked up SSMIS and it sounds like a superior (certainly newer) set of instruments relative to AMSR-E. Is there a reason researchers like Uni Bremen hadn't switched already? (Like it's a fine instrument but not as good for this particular task?)
Prev 1453 1454 1455 1456 1457 1458 1459 1460 1461 1462 1463 1464 1465 1466 1467 1468 Next


