


 Arguments


Recent Comments
Prev 1456 1457 1458 1459 1460 1461 1462 1463 1464 1465 1466 1467 1468 1469 1470 1471 Next
Comments 73151 to 73200:
-
Alleycat at 07:59 AM on 5 October 2011Increasing CO2 has little to no effect
CO2 is a heavy gas that tends to stay close to the ground. (otherwise plants couldn't consume it) Heat always rises, it does not fall, even when radiating in all directions, the hotter the air the faster it rises. So explain to me how CO2 is keeping any heat from simply slipping past it and rising into space? Additionally, on a cloudy day, temperatures go down, not up. Heat rising with water vapor in it tends to create more clouds and thunderstorms, which cool things even more. I can see how (at night) cloud cover would keep some heat from escaping the atmosphere, but once you're more than a few feet off the ground (even in the heat of summer) the air temperature drops dramatically. I have personally observed this as a glider pilot. Even 3000' off the ground you can see ice crystals form on your canopy with the sun shining and ground temp at 90 degrees. So someone explain it to me (taking real world observations into account).Moderator Response: CO2 is well mixed in the atmosphere, as has been repeatedly measured with ground stations at various altitudes, aircraft, and spacecraft. Not an assumption, but a repeated observation. That's different than what happens in a small enclosed system such as a jar. Clouds keep the surface warm at night because they prevent some infrared radiation from escaping to space. During the day they do the same thing but also prevent some of the Sun's radiation from reaching the surface, and the energy prevented from coming in can exceed the energy prevented from getting out to space. Heat does not rise. Hot air does. It cools as it rises because its pressure drops because its surroundings are at lower pressure. -
damorbel at 07:51 AM on 5 October 2011The 2nd law of thermodynamics and the greenhouse effect
Re #298 Moderator Response: [Dikran Marsupial] "To avoid any further obfuscation, I will re-word the question. Do you agree that body A will radiate photons in random directions at random intervals, with total power proportional to the fourth power of the temperature of body A (i.e. according to the Stefan-Boltzmann law), and that this remains true regardless of the temperature of body B?" Yes.Moderator Response: [Dikran Marsupial] Good. Do you agree that the photons radiated from body A are carrying away some of the thermal energy from body A with them? -
Jonathon at 07:24 AM on 5 October 2011Climate Change Could be Expensive for Canada
Composer, Albatross (#5) mentioned that an earlier report concluded that the pros are probably going to outweigh the cons. This recent report, while acknowledging that there are pros, only mentions them briefly, completely excludes them from their calculations. I cannot say if the pros will outweigh the cons, but to completely omit them yields a false impression.Moderator Response: [John Hartz} You missed the point of my prior moderator comment. By design, the analyses contained in the report were focused on the costs of climate change to Canadians. It was not intended to be a cost-benefit analysis. The report is what it is. -
Composer99 at 07:19 AM on 5 October 2011Climate Change Could be Expensive for Canada
Jonathon: It was your reaction to the report, rather than the report itself, which I found to be of interest in this comment thread. I have no problem with a report produced for Canadian policy-makers which focuses on Canada. I would have a problem if the policy-makers only review the Canadian situation. You seem to be concerned that Canadians are getting a false impression about AGW from the NRT report. Based on your comments thus far, am I correct in guessing that you conclude that the benefits from AGW for Canada would outweigh the costs for Canada? A simple yes or no response will do. If yes, my question is: Even if it is the case that Canadians would stand to benefit materially from AGW for a number of decades, whether Canadians (or any subset of Canadians) should ignore the overwhelmingly negative implications of AGW elsewhere when making policy. -
L. Hamilton at 06:55 AM on 5 October 20112011 Sea Ice Minimum
Relating to my Gompertz graphic above, and other discussion about S curves, I just posted several updated versions including one based on the complete 1972-2011 Uni Bremen extent time series,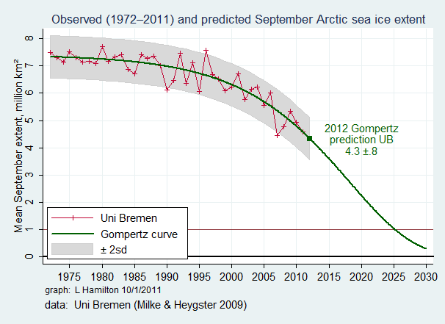 and another for PIOMAS volume,
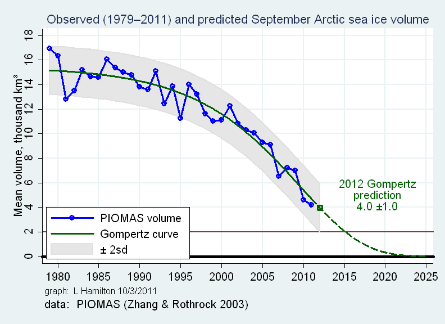 More explanation/discussion at Neven's place:
http://neven1.typepad.com/blog/2011/10/september-2011-sea-ice-extent-looking-ahead.html
http://neven1.typepad.com/blog/2011/10/september-2011-sea-ice-volume-looking-back-and-ahead.html
More explanation/discussion at Neven's place:
http://neven1.typepad.com/blog/2011/10/september-2011-sea-ice-extent-looking-ahead.html
http://neven1.typepad.com/blog/2011/10/september-2011-sea-ice-volume-looking-back-and-ahead.html
-
Albatross at 06:54 AM on 5 October 2011Michaels Mischief #3: Warming Island
Pauls, I'm sorry but we are going to have to agree to disagree. "I don't disagree with this but we're not comparing the melt rate at two different locations." I gave an example, I am well aware that we are discussing what might have transpired at a given location (i.e., Warming Island). You say "logicman's argument was that the 'nearby' station shouldn't be used to infer temperature anomalies at Warming Island because the climate conditions are different." That is not what logicman said. He said: "Even though only 75km apart, the Daneborg and Warming Island microclimates are not, I suggest, comparable." And "Most definitely a single station's temperature series is not enough to prove that a location 800km distant exhibited exactly the same trends year on year." Nothing about anomalies. Also, the temperature chart that Michaels showed was annual temperatures, not annual anomalies, so those data presented by Michaels really do not say much about the temperatures at Warming Island. I do agree that the anomalies at nearby stations can probably be used to infer the anomalies or rate of warming at Warming Island, but unless one knows the offset, one cannot infer the absolute temperature, and that is what the ice responds to. But us not forget what Michaels said: "As it turns out, maps show that Warming Island, indeed, was very much an island a mere 50 years ago, when Greenland, in fact, was warmer than it has been for the last 10 years." None of the data presented here support such a confident assertion by Michaels. The period of warmer temperatures was actually much earlier than the 50s (when temperatures were actually declining) and as shown by Box et al., the claim that the temperatures in Greenland 50 years ago were warmer than recent temperatures is demonstrably false. Some might use stronger language than I to describe the claims made by Michaels.... -
keithpickering at 06:46 AM on 5 October 2011Between St. Roch and a cold place
FYI, the St. Roch still exists, and is on permanent display in the Vancouver Maritime Museum.Moderator Response: Yes, and the first link in the post is to that museum; but, unfortunately, the actual pages for the St. Roch are currently being redeveloped and are not accessible. -
Jonathon at 06:41 AM on 5 October 2011Climate Change Could be Expensive for Canada
John, I have no problem with the report focusing on Canada. Others seem to be objecting that the costs and benefits are not seen in a global light. But as you say, the focus was designed to be solely about Canada. -
Albatross at 06:26 AM on 5 October 2011Michaels Mischief #3: Warming Island
Pauls, "Certainly Michael's argument for why it was has been taken apart here, but that doesn't necessarily mean he's incorrect." Actually, the preponderance of evidence strongly suggests that Michaels and his apologists are very likely incorrect. 1) The temperature data from nearby stations suggest that temperatures peaked in the thirties, showing a decline/drop until 1957 (see Michaels' own data, and the data shown by Dana and Robert). Those same data show that current temperatures are in fact warmer than they were back then. 2) Similarly, positive degree data (Box et al.) shown by Tom Curtis show two important things: i) The number of melt days in the 30s and 40s were, on average, fewer then those observed of late; ii) The number of melt days declined from the maximum in the late 30s (which was lower than maxima of late) until around about 1970, after which they increased again, with a sharp increase after 1990. 3) Photos of nearby glaciers (again shown by Curtis above) show that the glaciers in the 30s were in much better shape back then than they are of late. 4) The transient warming observed earlier in the 20th century certainly did not result in a ~180m increase in sea level. The fact that Michaels uncritically accepted the map as proof that Warming Isl. was present in 1957, speaks to his confirmation bias and once-sided skepticism. Do we really want to delay taking action on AGW because of disinformation from someone like Michaels? Box et al. (2009) talk of a warming period between 1919 and 1932 over Greenland, long before the 1957 map. More importantly though is what the past tells us about the future, and that is that the ice sheet is sensitive to warming, that warm spell in 1919-1932 was transient, indications are that we can expect Greenland to continue warming for many decades to come (barring of course volcanic activity or prolonged negative phase of the NAO): "Climate warming has pushed the Greenland ice sheet beyond its threshold of viability in recent years (Rignot et al. 2008). The ice sheet seems poised not to grow without substantial regional and global climate cooling. It therefore seems much more likely that not that Greenland is and will be for the foreseeable future be a deglaciating Pleistocene Ice Age relic." And that is the very inconvenient fact that Pat Michaels and Watts desperately want to distract us from. PS: Box et al. (2009) do note that there is evidence of glaciers and ice sheets retreating in the 20s and 40s in response to the warming (contrary to what Michaels and Watts would have you believe that is evidence that climate sensitivity is high not low), but not the fifties. However, as shown by Tom Curtis above, we know from the analysis of several glaciers in Greenland is that the glaciers back then were much larger/extensive than they are now. -
DSL at 06:20 AM on 5 October 2011The 2nd law of thermodynamics and the greenhouse effect
While I agree with Philippe, I do like the re-wording of the question. -
Philippe Chantreau at 06:08 AM on 5 October 2011The 2nd law of thermodynamics and the greenhouse effect
Dikran, you are wasting your time.Moderator Response: [Dikran Marsupial] Yes, I know I probably am, but I am trying to give damorbel a chance to demonstrate that he is more than just a troll and willing to engage in a proper discussion. Currently he is wasting the opportunity with extreme pedantry. -
pauls at 06:08 AM on 5 October 2011Michaels Mischief #3: Warming Island
Albatross - Absolute temperature does matter for melting ice is the, how many "melting" days there are. Two nearby locations can warm at a similar rate or have anomalies of similar magnitude, but if one is starting from a lower base temperature (beause of microclimate, for example) it will take that station longer to reach a critical threshold such as the melting point. I don't disagree with this but we're not comparing the melt rate at two different locations. We're comparing melt at a single location at two different times: the 1950s and the 2000s. It has then been pointed out that a 'nearby' weather station shows temperature anomalies that were about the same in the 1940s & 1950s as in the 2000s. So logicman's argument is still valid. logicman's argument was that the 'nearby' station shouldn't be used to infer temperature anomalies at Warming Island because the climate conditions are different. Barry was asking how this could be since it is within the 1200km distance used by GISS to infer spatial correlation. I've given my answer in post 24. I don't think citing the difference between anomalies and absolute temperatures supports logicman's argument and I don't think it is relevant in this case. -
Philippe Chantreau at 06:03 AM on 5 October 2011Between St. Roch and a cold place
Nice work JM. Another "skeptic" argument demonstrating how skepticism is all but lacking.Moderator Response: [JMurphy] Thanks. The 'argument' has never sounded convincing but some people just seem to accept it - not true sceptics, as you suggest. -
damorbel at 06:00 AM on 5 October 2011The 2nd law of thermodynamics and the greenhouse effect
Re #296 Moderator Response: [Dikran Marsupial] You wrote "This is obfuscation. I explicitly said that the temperature of the bodies was a point that will be discussed later" Temperature will be discussed later? Then what do you mean when you write:- 1/(in #290):- "Do you agree that any body at a temperature above zero degrees Kelvin will radiate" 2/(in #291):- "power per unit surface area proportional to fourth power of temperature" 3/(in #294):- "is proportional to the fourth power of its temperature, according to the Stefan Boltzmann law?" 4/(in #295):- "Unlike the first black body, the second is at zero Kelvin" 5/(in #296):- " so now consider the case where B is above zero Kelvin, but cooler than A" 6/(in #297):- "O.K., say B is at the same temperature as A." And so forth?Moderator Response: [Dikran Marsupial] Your pedantry does you no favours. O.K. I shall reword it for you, we will discuss the change in temperature of the two bodies later. Now please give a direct answer to the question I posed. If you want to demonstrate that you are merely a troll, this sort of pedantry, whilst avoiding answering the question is exactly the right way to go about it. I am trying to do you a favour here by encouraging a more productive discussion by going through it step by step to see if you are willing to engage with the discussion. You a wasting an opportunity here, but it is your loss. -
Bob Lacatena at 05:42 AM on 5 October 2011Review of Rough Winds: Extreme Weather and Climate Change by James Powell
175, Eric,...Masters' energy concept and Ostro's "confluence" of natural factors with AGW. Those are too loose and too vague...
I agree. The connection between energy and weather is logical, but lots of things seem logical at first thought but turn out to be far more complex and nuanced. -
Albatross at 05:20 AM on 5 October 2011Michaels Mischief #3: Warming Island
Pauls @29 and Barry, "What is being discussed is a change in conditions over time at Warming Island, not the absolute temperature, so it is anomalies that matter in this case too" I was trying to clarify the confusion about the auto-correlaton length for the anomalies. Absolute temperature does matter for melting ice is the, how many "melting" days there are. Two nearby locations can warm at a similar rate or have anomalies of similar magnitude, but if one is starting from a lower base temperature (beause of microclimate, for example) it will take that station longer to reach a critical threshold such as the melting point. So logicman's argument is still valid. But that is air temperature, we know also that ocean temperatures are warming and some of the recent melt was probably also attributable to the warmer ocean temperatures in that region. -
Jonathon at 05:20 AM on 5 October 2011Climate Change Could be Expensive for Canada
Composer99 Except for the Arctic ice cap, none of those places are within provinces or territories of Canada. Therefore, why should they have been included in a report about Canada? I do not believe that anyone here was encouraging climate change. Even those posters who suspect that Canada will benefit financial are not espousing climate change. The report was carefully cherry-picked to only include those items which produced the desired outcome. If you think that heating bills will not be affected, you may want to think again. Focusing on only the cooling side of energy bills is akin to presenting data that the Antarctic peninsula has lost ice, therefore all of Antarctic is melting, or that Tuvalu has gained area, therefore all pacific islands are growing. Do you see the problem with focusing on a relatively small fraction of the whole?Moderator Response: [John Hartz] The analyses summarized in this report were by design focused on the potential costs of climate change to Canada. If that gives you heartburn, so be it. -
Eric (skeptic) at 05:12 AM on 5 October 2011Review of Rough Winds: Extreme Weather and Climate Change by James Powell
Sphaerica, I generally agree. Some phenomena like intense rainfall have a much more linear relationship to AGW than others like tornadoes or (to some extent) hurricane formation and intensity. Maybe a good compromise for a book like this is to briefly describe the connections, the direct ones like increased evaporation causing floods and exacerbating droughts. Then the indirect ones like instability, lapse rate, horizontal temperature gradients, etc which will vary nonlinearly with AGW but are also much more prone to natural variations. The author should either explain it somehow or leave it out (e.g. strong tornadoes) but not just repeat Masters' energy concept and Ostro's "confluence" of natural factors with AGW. Those are too loose and too vague IMO and do not justify adding strong tornadoes into the book. -
robert way at 04:44 AM on 5 October 2011Michaels Mischief #3: Warming Island
Tom Curtis at 23:54 PM on 4 October, 2011 Pauls @24, I believe it is a mistake to assume ice behavious is a simple function of annual temperatures. In fairness, the statistical relationship between temperature and sea ice minimums for a year is very strong. http://clearscience.wordpress.com/2010/11/19/predicting-past-sea-ice-extents/ The issues I have with Middleton are the use of GISP2 and greenland anomalies to characterize sea ice extent. I think I demonstrated somewhere recently that the relationship between ice volume and arctic air temperature is R2 = 0.77 (I was going to do a post on it one time). That's a pretty strong result. Maybe I should respond? haha -
damorbel at 04:38 AM on 5 October 2011The 2nd law of thermodynamics and the greenhouse effect
Re #296 Moderator Response: [Dikran Marsupial] you wrote:- 1/ "say B is at the same temperature as A. (i) Would you agree that the emission of photons from A is not affected by this ". Yes, as long as the temperature of A is not changed by this.2/ "or does it [A] continue to emit photons with total power according to the Stefan-Boltzmann law " I think this is the same question, no 'or' about it; if A is still above 0K then A continues to emit photons, some of which will continue to be intercepted by B. 3/ "ii) Some photons from A will still hit and be absorbed by B, thus transferring some energy from A to B." No, there would be no change in the energy of either A or B because they are at the same temperature.Moderator Response: [Dikran Marsupial] This is obfuscation. I explicitly said that the temperature of the bodies was a point that will be discussed later. I asked whether you agree that the emission of photons from body A remained as before, with photons emitted at random intervals and in random directions with total power given by the Stefan Boltzman law (which already describes the dependence on temperature). To avoid any further obfuscation, I will re-word the question. Do you agree that body A will radiate photons in random directions at random intervals, with total power proportional to the fourth power of the temperature of body A (i.e. according to the Stefan-Boltzmann law), and that this remains true regardless of the temperature of body B? -
Composer99 at 04:32 AM on 5 October 2011Climate Change Could be Expensive for Canada
Jonathon: What part of 'global' in AGW are you missing? Are Bangladesh, the Netherlands, the southern US, tropical countries world-wide, small Pacific islands, the Amazon basin, and the Arctic ice cap so insignificant that Ontarians should encourage global climate change to save some money on their heating bills? Also, given the wide range and scope of impacts (e.g. the destruction of pine forests as noted upthread, or the ongoing glacier melt and Arctic impacts), focusing on heating bills strikes me as a carefully-chosen cherry-pick. -
Crux of a Core, Part 3... Dr. Ole Humlum
...Regarding previous comment - But of course, you knew that, since we're commenting on the Crux of a Core thread in the first place. I have to be more careful about context when following recent comments - sigh. -
Crux of a Core, Part 3... Dr. Ole Humlum
citizenschallenge - That site, and Ole Humlum in general, have been discussed here. Search on "Humlum", which will take you to here, here, or here. Ole Humlum has repeatedly focused on the GISP2 core (a local record), leaving out or incorrectly matching the recent instrumental record, cherry-picking short time frames, and in general making a hash of the data to support his "it's not happening" points. Rob Honeycutt's Crux of a Core series addresses this topic quite thoroughly. -
citizenschallenge at 02:55 AM on 5 October 2011Crux of a Core, Part 3... Dr. Ole Humlum
Does anyone know of others who have been examining and debunking Climate4you? I've been doing various web searches but am coming up disappointingly empty. Seeking further info -
pauls at 02:46 AM on 5 October 2011Michaels Mischief #3: Warming Island
Albatross - What is being discussed is a change in conditions over time at Warming Island, not the absolute temperature, so it is anomalies that matter in this case too. 'Why shouldn't the anomaly trends at 800km-away Angmagssalik be representative of those at Warming Island given Hansen's oft-referenced 1200km radius?' is the question Barry is asking. -
pbjamm at 02:19 AM on 5 October 2011Debunking Climate Myths from Politicians
A ray of hope from Republican former Congressman Bob Inglis. Perhaps more conservatives will have the courage to speak about the conflict of Conservatism vs Science. "When it comes to energy and climate, these are not normal times. We’re following sentiment, not science, we’re turning a blind eye to accountability, and we’re failing to use the power of markets." -
Albatross at 02:15 AM on 5 October 2011Michaels Mischief #3: Warming Island
Barry @22, Please note KR's post @27. There lies the answer-- Hansen's group is looking at the correlation of anomalies. From the NASA GISTMEP site: "The reason to work with anomalies, rather than absolute temperature is that absolute temperature varies markedly in short distances, while monthly or annual temperature anomalies are representative of a much larger region. Indeed, we have shown (Hansen and Lebedeff, 1987) that temperature anomalies are strongly correlated out to distances of the order of 1000 km. " -
Bob Lacatena at 01:38 AM on 5 October 2011Review of Rough Winds: Extreme Weather and Climate Change by James Powell
Eric, I think the tornado issue is a strawman anyway. No one ever said that every weather event had to increase in frequency and intensity, or that such increases must be detectable in the same time frames. It is quite possible that some events (floods, droughts) will increase in frequency and intensity, others (hurricanes) only in either frequency or intensity, and some (tornadoes) may even diminish in one or both of intensity and frequency. Or they may diminish at first, and then undergo an unexpected increase at a later date, when a new tipping point is reached. Tornadoes in particular seem to rely on extreme temperature gradients rather than available energy. So an increase in temperatures with a reduction in the gradients may decrease the frequency and usual intensity of storms. But the higher energies and temperatures available in the system may also make short outbursts of more or more intense storms more possible and frequent than before. So you'd see an overall reduction in storms and intensity, and yet begin to have more experience with the nasty scenario of a weekend of a flurry of nasty, evil storms. So that's something you'd wind up measuring one way (overall statistical decrease) when reality to the people withstanding the onslaught is very different. -
damorbel at 00:55 AM on 5 October 2011The 2nd law of thermodynamics and the greenhouse effect
Re #296 Moderator Response: [Dikran Marsupial] you wrote:- 1/"so now consider the case where B is above zero Kelvin, but cooler than A. (i) does this affect the radiation of photons from A," No. 2/"or does it [A] continue to emit photons with total power according to the Stefan-Boltzmann law " I think this is the same question, no 'or' about it; if A is still above 0K then A continues to emit photons, some of which will continue to be intercepted by B. 3/ "ii) Some photons from A will still hit and be absorbed by B, thus transferring some energy from A to B." Yes.Moderator Response: [Dikran Marsupial] O.K., say B is at the same temperature as A. (i) Would you agree that the emission of photons from A is not affected by this and that it still emits photons at random intervals in random directions, such that the total power radiated is proportional to the fouth power of its temperature (as per Stefan-Boltzmann)? (ii) Would you agree that some of these photons emitted from A strike and are absorbed by B, transferring some energy from A to B? -
Michaels Mischief #3: Warming Island
barry - "Does this not raise questions about the utility of Hansen's (and others) 1200km radius choice for the whole globe?" There's definitely correlation of anomalies, as has been demonstrated over and over again. However, in this case, those stations are entirely too far to to judge the actual temperature. Anomalies correspond over great distances, but the offsets at each location are very much determined by local geography and weather patterns. An anomaly dataset from 800km just doesn't tell you what the offset at Warming Island would be. Angmagssalik might have been quite warm - regardless of how the temperature anomaly tracks, just how much colder is the more northern Warming Island location? -
IanC at 23:55 PM on 4 October 2011It's ozone
Shibui, The ozone hole is a result of both the cold and CFCs. The abnormally cold stratosphere allows the formation of clouds, which serves as a catalyst for the destruction of ozone. The reaction also requires chlorine, which is supplied by CFCs. -
Tom Curtis at 23:54 PM on 4 October 2011Michaels Mischief #3: Warming Island
Pauls @24, I believe it is a mistake to assume ice behavious is a simple function of annual temperatures. David Middleton makes that assumption at WUWT makes that assumption about sea ice extent (see link @6), and produces this reconstruction of 20th century sea ice extent: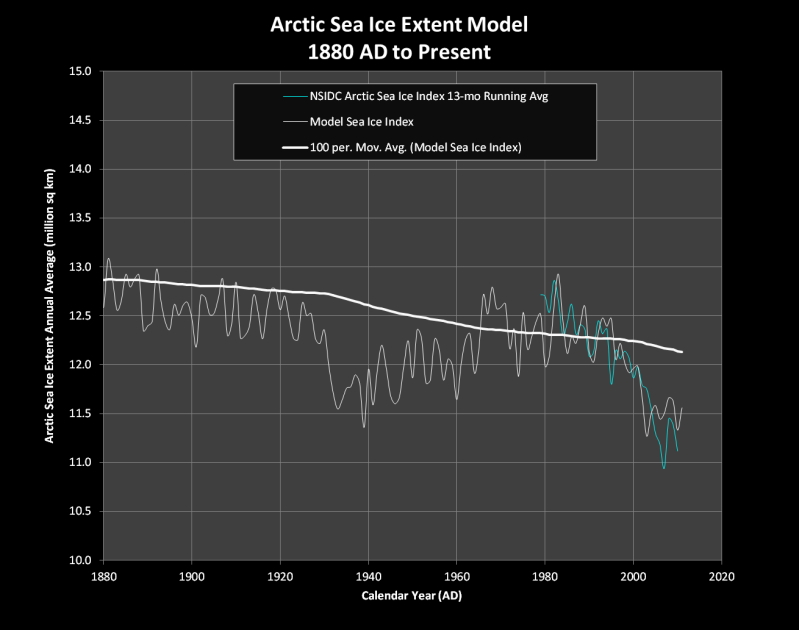 Unfortunately for his reconstruction, there are extensive records of Arctic sea ice extent predating the satellite era:
 Middleton uses a 13 month running average of ice extent, which is comparable to the annual average (black squares) in the second chart. As you can see, while Middleton's reconstruction lies under 13 million Km^2 for almost the entire duration, and drops as low as (approx) 11.4 million Km^2 in 1939, the actual sea ice extent trends around 13.5 million Km^2 until the 70's, and never drops below 13 million Km^2 in the 1930's and 1940's.
The ice bridge that used to connect Warming Island to Liverpool Land was a glacial tongue, not sea ice. Therefore the sea ice extent is not directly relevant, but the caution against simply assuming a simple correlation between ice melt and temperature.
If I were to make an estimate regarding the existence, or otherwise, glacial tongue in the 1940's and 1950's, I would probably refer to a reconstruction of Greenland glacial melt such as this by Box 2009:
Middleton uses a 13 month running average of ice extent, which is comparable to the annual average (black squares) in the second chart. As you can see, while Middleton's reconstruction lies under 13 million Km^2 for almost the entire duration, and drops as low as (approx) 11.4 million Km^2 in 1939, the actual sea ice extent trends around 13.5 million Km^2 until the 70's, and never drops below 13 million Km^2 in the 1930's and 1940's.
The ice bridge that used to connect Warming Island to Liverpool Land was a glacial tongue, not sea ice. Therefore the sea ice extent is not directly relevant, but the caution against simply assuming a simple correlation between ice melt and temperature.
If I were to make an estimate regarding the existence, or otherwise, glacial tongue in the 1940's and 1950's, I would probably refer to a reconstruction of Greenland glacial melt such as this by Box 2009:
 As you can see, it provides no particular reason to expect the glacial tongue to have been absent mid 20th century. Indeed, where glacial melts have left datable moraines, they also indicate that recent melt is greater than that in the mid 20th century.
 Consequently, I would not be surprised if the glacial tongue did connect Warming Island to the mainland in the mid 20th century.
You are right about one thing, however, that this is an issue of trivial importance. I find the genuine process of scientific discovery, as by Schmidt, fascinating, and enjoyed this blogpost for that reason along. But if I were to try and find a wider significance, it would not be in the trivial issue of whether Warming Island was, or was not an island in 1957. Rather, it would be in the complete lack of skepticism shown by Michael's in his initial argument, and by the fake skeptics such as Middleton in picking it up, and uncritically repeating it.
Consequently, I would not be surprised if the glacial tongue did connect Warming Island to the mainland in the mid 20th century.
You are right about one thing, however, that this is an issue of trivial importance. I find the genuine process of scientific discovery, as by Schmidt, fascinating, and enjoyed this blogpost for that reason along. But if I were to try and find a wider significance, it would not be in the trivial issue of whether Warming Island was, or was not an island in 1957. Rather, it would be in the complete lack of skepticism shown by Michael's in his initial argument, and by the fake skeptics such as Middleton in picking it up, and uncritically repeating it.
-
CBDunkerson at 23:43 PM on 4 October 2011The Last Interglacial Part Four - Oceanic Influences
FundME, neither of your two scenarios is even remotely possible under current conditions. On the other hand, sufficient climate change to cause the deaths of billions of people is theoretically possible. That kind of disruption would also certainly lead to wars which, if nuclear (or worse) weapons were involved, could potentially eliminate our species. If you are not concerned by that then you can indeed ignore climate change. -
muoncounter at 23:35 PM on 4 October 2011The Last Interglacial Part Four - Oceanic Influences
Fund#13: "only two scenarios that I believe should concern me." What makes you say that? Or more precisely, what part of the scientific literature on global climate change suggests that those are the only two areas of concern? What part of the scientific literature allows such an easy dismissal of all the other areas of concern that are part of global climate change? BTW, that is better suited to the thread 'its not bad,' which you will find linked under 'Most used climate myths' in the left-hand column of every page. -
Anne-Marie Blackburn at 23:17 PM on 4 October 2011Review of Rough Winds: Extreme Weather and Climate Change by James Powell
Erik (sorry for misspelling your name earlier) I can't agree with your assertion that the suggestion from the chapter is the heat and moisture are the only needed ingredients. In the first sentence of the chapter on tornadoes, he mention the two main factors that drive tornadoes: instability in the atmosphere and wind shear. I guess we're going to have to agree to disagree on this - I don't think that he needs to explain the science in detail since he's only trying to assess whether climate change contributed to the tornadoes in question. And he makes no claim that it has, only that it's a possibility. -
Shibui at 23:01 PM on 4 October 2011It's ozone
OK - so it's the cold rather than a drop in CFCs? Or, maybe it's due to the cold, period(?). -
FundME at 22:49 PM on 4 October 2011The Last Interglacial Part Four - Oceanic Influences
Thanks to everyone for replying. My hypothetical time slice of the present represented by a graph showing Temperature and CO2 concentrations could only be moved backwards in time as far as the beginning of the Pleistocene. Any further back and tectonics make it useless. However I believe it would have been futile to examine even this period with an eye to predicting the future behaviour of our climate by looking for similar conditions in the past. There are a lot of interesting hypothesis that postulate the consequences of a given set of climatic conditions. But as to cause and effect there are so many, in fact I think there are too many, competing ideas for the average layman to wade through with any confidence in their veracity. There are only two scenarios that I believe should concern me. 1) A runaway greenhouse effect leading to Venusian conditions. 2) Global cooling If we are to believe people like Monkton the runaway greenhouse effect is constrained by the past because the climate sensitivity has been limited (who knows by what) or we have to say that there is a lot of uncertainty in the past record and no past conditions match today's conditions to such a degree that it allows us to make such conclusions(low sensitivity). Back to another Planet.Moderator Response: Please take discussion of your two scenarios to the thread "It’s not bad." -
Eric (skeptic) at 22:49 PM on 4 October 2011Review of Rough Winds: Extreme Weather and Climate Change by James Powell
True, I didn't notice he said the frequency has not changed. But he follows that with Masters' comments on a "higher energy state" which, AFAIK, is not well-defined. A better followup would be about the ingredients for tornadoes which may increase or decrease (or stay the same) with GW. The suggestion from the chapter is the heat and moisture are the only needed ingredients. But the heat and moisture travel from the gulf every spring, at least several times, but the tornado outbreaks are much more rare than that. Also the heat and moisture remain after tornado season dies down. It suggests that there are more important ingredients and those ingredients should at least be mentioned WRT AGW. -
Kevin C at 22:44 PM on 4 October 2011Michaels Mischief #3: Warming Island
Does this not raise questions about the utility of Hansen's (and others) 1200km radius choice for the whole globe?
That's a good question. The right way to answer it is to look at the data. Hansen's 1200km figure is, as I understand it, derived from looking at correlations of the daily or monthly data (can't remember which) as a function of distance. That's useful if you are interested in monthly temperatures. If you are only interested in longer term trends, then you may be able to use a much larger radius. We can test this by throwing out a lot of stations and seeing if we can still reconstruct a time average of the ITR (say by taking annual averages) from a much sparser mesh. Nick Stokes has done exactly that here, using just 60 evenly spaced land stations to reconstruct a good approximation to the global land-and-ocean temperature. The averaging in this case is over a much greater range than Hansen's, and the lower number of stations means that the station noise plays a bigger role. Nonetheless, you get a very similar answer, suggesting that for long term temperature trends the 1200km figure may be an underestimate. Looking into this further by using cross-validation to accurately quantify how far you can average for an annual temperature estimate, or even a 60-month running mean, would make a good blog science project. -
pauls at 22:39 PM on 4 October 2011Michaels Mischief #3: Warming Island
barry - On Hansen's methods, the assertion of correlation within a 1200km radius isn't meant to imply that every location within it can be accurately represented by a single weather station. Temperature change at any particular location should be a function of both local and regional climatic factors. For his purposes Hansen doesn't really care what the local climate is like so the method is intended to smooth out different local climatic factors at several locations within the 1200km radius, leaving us with a representation of only the regional contribution. This does, however, raise a question of why this tiny island matters in the context of global warming. Looking at various temperature charts from around the region it seems plausible that conditions were warm enough in the 40s/50s that some proportion of the island may have been exposed. Whether it was or not is another matter, and I'm not sure it will be easily resolved. Certainly Michael's argument for why it was has been taken apart here, but that doesn't necessarily mean he's incorrect. This seems to be a topic with only symbolic significance in the context of global warming. -
Jonathon at 22:33 PM on 4 October 2011Climate Change Could be Expensive for Canada
Ianw01, I am sure that metropolitan areas like Toronto have greater cooling demands than those of us further north. I have been to southern Ontario in the summertime, and it can get hot (not Texas hot, but hot for up here). Any increase in summertime temperatures will lead to increased electricity demand and bills during that time. However, compare those costs to the wintertime heating bills. I can also assure that the summer does not last a full three months, while the winter can drag on much longer. A simple check would to compare your AC bills with your gas bills. The Ontario Ministry of Energy published this comparison several years ago, and it shows typical costs for heating and cooling. Natural gas is most common in southern Ontario, and the average homeowner spends about 10x in heating compared to cooling. http://www.mei.gov.on.ca/en/energy/conservation/?page=heating-and-cooling-your-home_chapter-13 The NRT report did not include the costs of heating, but only cooling, which was my original beef. Would you not agree that omitting 90% of the costs is somewhat misleading? Consider the savings if the largest temperature rises continue to occur during nighttime lows and wintertime compared to summer highs - and this is only Ontario. As mentioned in an earlier post, the wine industry was a spoof on the comparison to Napa Valley, CA. -
Anne-Marie Blackburn at 22:12 PM on 4 October 2011Review of Rough Winds: Extreme Weather and Climate Change by James Powell
Eric Powell's book is a Kindle Single, not a comprehensive book on the link between extreme weather and climate change - I think this is worth bearing in mind when assessing what he's written. It's also worth remembering that he's trying to answer a specific question, namely whether there is now a preponderance of evidence showing that climate change is under way. Which is not the same as reviewing the literature on extreme weather and climate change. My point, though, was that it's wrong to say that all he's done is look at recent events and drawn some conclusions from those alone. He clearly hasn't, and Norman would know that if he'd read the book. As for tornadoes, Powell clearly states that there's been little to no change in strong to violent tornadoes between 1950 and 2010. You could argue that he could've explained things in more details to show why there are uncertainties, particularly in the case of tornadoes and hurricanes. But again, who is he addressing and what question(s) is he trying to answer? Is there really a need to go into all the details, or is a general overview sufficient? -
damorbel at 21:58 PM on 4 October 2011The 2nd law of thermodynamics and the greenhouse effect
Re #295 Moderator Response: [Dikran Marsupial] you wrote:- "Do you agree that some photons from A will hit and be absorbed by B, thus transferring some energy from A to B? " Yes.Moderator Response: [Dikran Marsupial] O.K., so now consider the case where B is above zero Kelvin, but cooler than A. (i) does this affect the radiation of photons from A, or does it continue to emit photons with total power according to the Stefan-Boltzmann law (ii) Some photons from A will still hit and be absorbed by B, thus transferring some energy from A to B. Can we agree on that? -
Eric (skeptic) at 21:36 PM on 4 October 2011Review of Rough Winds: Extreme Weather and Climate Change by James Powell
The author certainly could have been more thorough in explaining the predictions, how the events fit and how they might not. As Norman points out above, the trend in strong-to-violent tornadoes is down. The predictions are ambiguous. The author mentions the source of heat and moisture, but fails to point out the other required ingredients. Those other ingredients may trend up or down with AGW, the predictability is very low. Also the author nicely points out the AGW-driven seasonality and areal changes with hurricanes but not with tornadoes (which AFAIK, there isn't any). In short a bit more detail and precision can go a long way to addressing criticisms. The story may pass muster initially with the uninitiated but they are going to be very susceptable to suggestions that they have not been given the whole story. Of course, that is always possible and his book would be 500 pages long to cover all possible critiques. But I believe that in a few cases it is inadequate as written. -
logicman at 21:23 PM on 4 October 2011Michaels Mischief #3: Warming Island
barry: it is of course perfectly acceptable to use a collection of data to make general inferences. And yes, from any Greenland temperature series we can make some very broad inferences about Greenland as a whole. But please see my comment #8 where I cite Michaels himself saying words to the effect that a few stations are not enough. Most definitely a single station's temperature series is not enough to prove that a location 800km distant exhibited exactly the same trends year on year. However, such a trend identity is what Michaels seeks to prove visually by linking a single GISS graph to only two three available satellite images. The amount of ice off Greenland's east coast varies quite a lot between years. There was also great variability in the frequency of occurrence of the Odden Ice Tongue which linked Greenland to Jan Mayen. The Odden has not been observed since 1997. The Odden would have affected the Warming Island area greatly, and Angmagssalik not at all. Please note that Ernst Hofer called his book 'Arctic Riviera' because as a newcomer to Greenland he had been astonished how warm it was in summer in the sheltered fjords, away from the stream of coastal ice.Ernst Hofer has published his photographs with the title "Arctic Riviera", he has thereby indeed given a characteristic description of the fjord-region of North-East Greenland, which, owing to favourable circumstances, enjoys a distinctly mild climate. To the west the inland ice forms an immense high plateau, which produces what is actually a desert climate, and off the east coast there lies a belt of drift-ice, several hundred miles in breadth, which keeps off the moist Atlantic air-masses from the coast. In consequence, the weather in the interior of the fjords in the period from the middle of July to the middle of September is mostly bright, dry, and calm. During this period the glaciers supply enough water to produce a small Arctic oasis with rich flora and fauna in the midst of the desert climate. The midnight sun warms the steep walls of the fjords and produces temperatures that can otherwise rarely be registered in such northern degrees of latitude. Thus the present picture-volume is justified in bearing the title of "Arctic Riviera". Lauge Koch, Preface, Arctic Riviera, 1957
-
damorbel at 20:47 PM on 4 October 2011The 2nd law of thermodynamics and the greenhouse effect
Re #294 Moderator Response: [Dikran Marsupial] you wrote:- "in an vacuum of infinite dimension (so it is not recieving photons from its environment)" Fair enough. And:- "Do you agree that it emits photons at random intervals and in random directions, such that the total power (over all of its surface area and over all wavelengths) is proportional to the fourth power of its temperature, according to the Stefan Boltzmann law? " Yes.Moderator Response: [Dikran Marsupial] Good. O.K., so now lets introduce a second, identical blackbody (labelled "B") that is close to, but not touching the first ("A"). Unlike the first black body, the second is at zero Kelvin, so it is not emitting any photons. Do you agree that some photons from A will hit and be absorbed by B, thus transferring some energy from A to B? -
barry1487 at 20:41 PM on 4 October 2011Michaels Mischief #3: Warming Island
We are told often enough that temperature stations within 1000 or even 1200kms distance show similar trends, and that this observed condition is the basis for some choices regarding infilling and extrapolating temperature data for the instrumental record.Final question. If nearby locations have similar variations in their climate, irrespective of each station's local climate, what do we mean by ‘nearby’? This too isn’t an idle question; it can be investigated, and the answer is many 100’s of kilometres at low latitudes, up to 1000 kilometres or more at high latitudes. In Climatology this is the concept of ‘Teleconnection’ – that the climates of different locations are correlated to each other over long distances.
http://www.skepticalscience.com/OfAveragesAndAnomalies_pt_1A.html and http://www.skepticalscience.com/OfAveragesAndAnomalies_pt_1B.html Is it consistent now to argue that Michael's selected station is a poor choice, even though it lies 800kms distant? Or, ifAngmagssalik and Warming Island have different climate regimes. Angmagssalik is south of the Arctic Circle, Warming Island is north of it and so is much colder, especially during winter. Angmagssalik weather station is in a fjord. Warming Island is on an exposed coast. The weather station at Angmagssalik is sheltered from the ice-stream which, as Scoresby noted, affects the local climate very strongly.
Does this not raise questions about the utility of Hansen's (and others) 1200km radius choice for the whole globe? -
ianw01 at 20:25 PM on 4 October 2011Climate Change Could be Expensive for Canada
Well Jonathon, you are on your own with your air-conditioning statements. Having lived in several cities in eastern and western Canada, I can assure you that summertime electricity demands are a big deal for ~3 months of the year, particularly in highly populated southern Ontario and Quebec. For example, please see the actual record consumption values and forecasts published by the Independent Electricity System Operator. Now granted, most of those people are technically south of the 45th parallel, but I'm sure you weren't trying to mislead anyone by omitting roughly 1/3 of the Canadian population. (Here is a place to start if you want to improve on that estimate.) You make some intuitively appealing claims around winter heating costs and the wine industry - so how about some references? Then we can compare them to the costs in the report that should be the topic of this discussion. -
Rob Painting at 19:44 PM on 4 October 2011Sea level fell in 2010
LewisC - trying to estimate numbers from that graphic is not a reliable method. I assume the data will find its way into the scientific literature - but I will check up on that. The idea that the atmosphere is holding the equivalent of an extra 7.3mm of sea level, during 2010-2011, is a tad absurd. The exchange of water between the ocean and land surface can lead to mean sea level fluctuations up 8mm during ENSO events. See Llovel (2010) cited in the post. During the extreme El Nino of 1997/1998 sea level rose a whopping 20mm over the short-term, so we know that large fluctuations are possible. More telling, perhaps, is that La Nina is when we typically see cooler surface temperatures, and therefore a corresponding decrease in atmospheric water vapor. El Nino, on the other hand, is when heat is given up by the ocean surface to the atmosphere, and this warming increases the water vapor content of the atmosphere on a global scale. See Trenberth & Smith (2005). Of course, the oceans are still warming and the land ice is still melting, so long-term sea level will rise. This might be a rather large "pothole" on the road to higher seas though - given that La Nina looks set for a double-dip. -
Anne-Marie Blackburn at 19:20 PM on 4 October 2011Review of Rough Winds: Extreme Weather and Climate Change by James Powell
NormanIt is picking some extreme events around the world and forming a conclusion.
No, you are cherry-picking a couple of sentences from the review and drawing your own conclusions, which suggests you still haven't read the book. As I say in the rest of the review, Powell places these events in a historical context (i.e trends) and he looks at what papers and/or experts are saying with regards to different events. He also cites the literature that shows that some events probably already have a climate-change component to them. In other words, he looks at the predictions that have been made and finds that some events are already consistent with these predictions. The conclusion is not based on picking some extreme events worldwide - it is based on analysing the data, looking at trends and seeing whether what we are witnessing is consistent with a warming world.
Prev 1456 1457 1458 1459 1460 1461 1462 1463 1464 1465 1466 1467 1468 1469 1470 1471 Next


