


 Arguments


Recent Comments
Prev 1467 1468 1469 1470 1471 1472 1473 1474 1475 1476 1477 1478 1479 1480 1481 1482 Next
Comments 73701 to 73750:
-
indulis at 21:23 PM on 28 September 2011Monckton, the Anti-Nurse
Actually Monckton didn't just say he was a Lord (he is entitled to do that- no pun intended!), he implied to the US Congress, and has said on a number of occasions that he is a member of the House of Lords. That is, he has falsely claimed to be a member of the British government. Hence the letter from the British Parliament politely telling him to STOP DOING IT. -
cRR Kampen at 21:21 PM on 28 September 2011Understanding climate denial
Dale #5, what the deniers deny is essentially the fact that CO2 is a greenhouse gas. There is no more to it.Response: [John Cook] SkS has been building a database of climate myths for years now and the argument that CO2 is not a greenhouse gas is not one of the more popular arguments. Most of the prominent climate "skeptics" readily concede CO2 is a greenhouse gas. -
cRR Kampen at 21:19 PM on 28 September 2011Understanding climate denial
John Russell #6, merely facts (which are taboo) are red rags. I decided to employ 'denier' or e.g. 'liar' where facts are denied or people lie. This in realms like WUWT where arguments play no role. Keeping your cool means getting the bulls in a rage pronto, gets them to show their worthless cards. And this, sir, is setting the battle on enemy ground. -
Dale at 21:11 PM on 28 September 2011Understanding climate denial
@5 (response) Thanks for the reply John. I will read the articles with that in mind. -
Norman at 20:50 PM on 28 September 2011Review of Rough Winds: Extreme Weather and Climate Change by James Powell
DB #77 The 0.01 watts/meter of contrails is its effect on the entire globe (the contrail coverage of the globe is small) but in localized areas that may have a high degree of contrail formation (based upon upper atmpospheric conditions) the effect can influence the local region (still a small part of the globe) to a greater degree. Would be similar to a thick cloudy night in a local region. It will keep the temps much warmer in that region but will have little effect on the global temp.Response:[DB] We are left with this: In this absence of actual research or performing the radiative equations (line by line is best) to demonstrate the feasability of your hypothesis, you present unsupported conjecture.
In like fashion, I could be the recipient of a large grant from a Nigerian bank (as I get those email notifications daily), but it remains conjecture until I supply them with necessary bank account details for them to process the deposits (and subsequent withdrawals).
-
John Russell at 20:43 PM on 28 September 2011Understanding climate denial
@Dale. If people follow my advice regarding 'those in denial', the issue you raise does not arise. -
John Russell at 20:40 PM on 28 September 2011Understanding climate denial
@yocta: I'd give up on Youtube. Every good soldier knows that wherever possible you need to choose the battlefield where you'll confront the enemy. Regarding the word 'denier'. As this is a red rag to a bull, I avoid it; preferring instead to use the phrases like 'those in denial'. There always a way to rephrase your response to avoid using the 'd' word. The other point to make is that when addressing a particular individual in a comment thread, it's not that person you're trying to influence -- most of the vociferous are usually beyond hope -- it's the 'don't knows' and genuine sceptics looking on that are important. How you conduct the 'argument' -- remaining calm, considered and consistent -- is critical to being influential. You're the one that has to come across as the voice of reason. You must attempt to make your opponent in denial to come across as being unreasonable. So never become too involved in him (isn't he's almost always male?) and instead imagine the undecided onlooker standing over your shoulder as you write. Last: never lose your cool. He who stays in control of his emotions, wins. -
Dale at 20:36 PM on 28 September 2011Understanding climate denial
John, Don't you find the phrase "climate change denier" a tad ridiculous? I challenge you to find anyone older than primary school who denies that climate changes (natural or otherwise). Wouldn't "man-made global warming denier" be a more accurate phrase? Except that's not entirely accurate either in all cases. What do you call a person who agrees with man-made global warming principles but disagrees with one component of it? For example, wouldn't it be more accurate to call Dr Spencer a "high climate sensitivity denier"? Or astronomers, shouldn't they be "increasing atmospheric IR deniers"? For geologists it is probably prudent to call them "fast short-term global warming deniers" (since they believe the climate changes catastrophically over long periods). The problem is, there is no clear-cut "do you believe or not". There are many 'shades of grey' (even within the peer-reviewed science those 'shades of grey' shine through). You even see those 'shades of grey' in comments and articles on this site. IMO, instead of trying to define "them" (deniers, sceptics, whatevers) isn't it more important to define who you are first?Response: [John Cook] The point of my article is that this is not about labels, it's about understanding the process of denial. The process of denial is bringing to the fore supporting, comfortable arguments while suppressing or denying counter evidence. Examples of this process are cherry picking, or changing the subject, when presented with uncomfortable evidence. Conversely, genuine skepticism is about considering the full body of evidence. -
FundME at 20:34 PM on 28 September 2011Sea level rise due to floating ice?
Within this closed system (Jar) the salinity of the water in the Jar would increase as the ice formed due to the salt leaching out of the ice. When the Ice melts it lowers the salinity of the water back to where it was in the first place. Bringing us back to square one. One needs an ever decreasing sea ice volume as in the real world for the example to work. With very little sea ice left in the Northern Hemisphere its addition to the rise in sea level is ever diminishing to 0. -
Eric (skeptic) at 19:58 PM on 28 September 2011Review of Rough Winds: Extreme Weather and Climate Change by James Powell
Norman, you probably already know this, but unlike the GAT indexes, records (and the ratio shown in post 85) are not corrected for local site effects and UHIE. In one case, National airport in DC, the extent of gravel has grown: http://i433.photobucket.com/albums/qq51/palmer2/national-asos.jpg and the low temperatures are routinely higher than dozens of nearby weatherbug stations (higher than all other stations on radiational cooling mornings). I am quite sure there was no effect on record highs, but there seems to be a warming effect on lows on clear, calm mornings. I don't know if it affected record high minimums in this particular case. -
yocta at 19:41 PM on 28 September 2011Understanding climate denial
Great and timely article! I'm battling my own troll now over on a youtube clip on artic ice who is so full of contradictions I don't know where to start. It feels like hitting a brick wall. You tube "climate skeptics" are the worst of all. They just keep popping up everywhere. Should I continue feeding him or just live by the old DNFTT maxim? -
Paulie200 at 19:04 PM on 28 September 2011The Climate Show #19: A Tale of Two Poles
Lloyd Flack @ comment 1. The case for pirates being fewer in number in the more recent climatological record relies on a seriously outmoded definition of "pirate." While the incidence of pirates in their traditional littoral waters has fallen dramatically (Somalia and the Indian Ocean notwithstanding) current pirates have undergone a spatial relocation to well organized operations at the worlds financial institutions. (i.e. AIG, CitiBank, along with a slew of Brit, German, and other banks and financial institutions worldwide. And who can listen to Oztralia's own Rupert Murdoch and NOT think "If he only had an eye patch and a parrot. Arrrrrrr matey!") I suggest that the number of pirates has increased in a manner even more alarming than global temperatures, and that the two are positively, and often causally, related. (As to the Climate Show, that was really good, and informative, and I'll be looking for the next one. John Cook is as lucid, mellow and informed on video as he is in his writing on his blog. But the best part of that show for me is that I think I can now tell the difference between an Ozzie, who would be the geest, and the Kiwi host, who has geusts on his show ;) -
cynicus at 18:47 PM on 28 September 2011Understanding climate denial
John, "Ironically, he closed down his site due to discouragement, not knowing whether he'd changed a single mind through his blogging. It's a sentiment many of us bloggers can relate to, I'm sure." While few 'skeptics' can be convinced by the evidence I think there is a much larger group that is ill-informed and either: has no real opinion on AGW, thinks it's mostly theory an not manifesting yet, thinks it will not harm them, etc. I usually invite this large group to visit SkepticalScience (and other sites) to educate themselves on the topic. This is the group that hasn't dug in yet and likely can be persuaded by solid arguments and evidence, this is the group that every blogger should have in mind. In short: SkepticalScience and other bloggers on the science side are simply doing an invaluable job. The sentiment of being unable to change peoples minds is misplaced I think. -
cynicus at 18:25 PM on 28 September 2011Understanding climate denial
Stevo, "Oddly enough, a follow-on effect is that I'm more inclined to examine my decisions and attitudes on other topics more deliberately and critically as a result. " That's exactly what I'm experiencing as well. After about 5-years of following climatechange discussion I find myself factchecking and doing source-lookups on a whole range of subjects before accepting the opinion of some (anonymous) internet person (or from friends/relatives). The AGW discussion experience makes me very skeptical on every subject. I notice being so skeptical is a pain when 'discussing things' with friends/family and has a tendency to stop an interesting discussion dead in it's tracks. There's a lot of bulls**t and non-informed opinion going round as 'fact'. -
skywatcher at 18:22 PM on 28 September 2011Greenland is gaining ice
The Times atlas controversy appears quite ridiculous. They initially very publicly claimed Greenland had lost 15% of its area, then had to start backpedalling as the complaints from the cryospheric community came rolling in (see RealClimate for a summary). mainly because the Times Atlas in their various statements kept claiming initially that their maps were accurate, then that it was not their fault, it was the fault of the NSIDC, then in their latest concession claim it highlights uncertainty in climate science! Yet all it does is highlight their own incompetence, in taking a >500m thickness map and thinking that this showed ice extent. From HarperCollins' last statement: "The one thing that is very apparent is that there is no clarity in the scientific and cartographic community on this issue ... ". Dead wrong. There is plenty of clarity on the issue in the science community, it's just that the Times Atlas cartographers got it totally wrong and can't admit it. In the age of Google Earth and freely-available MODIS imagery, as well as with a media engine keen to highlight "uncertainties" in climate science, such an error, which clouds public understanding of Greenland's actual melt, verges on the unforgivable.Response:[DB] "the Times Atlas cartographers got it totally wrong and can't admit it."
As one who spent many years as a professional cartographer, this statement (and your closing paragraph) are spot-on.
The mind boggles.
-
Bernard J. at 18:13 PM on 28 September 20112011 Sea Ice Minimum
Heh, leave alone for the moment the WUWT ice extent predictions. I'd like to know what they think the sea ice volume will do next year, and the year after, and the year after that... -
Zihaya at 17:55 PM on 28 September 2011Greenland is gaining ice
We need accurate data from any source materials for a valid result. But there is a re-draw map controversy. Times Atlas is at the middle of a debate after publishing a map that revealed a 15 percent decrease in ice mass. Greenland ice mass maps causing political uproar . Greenland is losing some ice mass due to melting. Environmental change due to global warming brings big changes. -
Dikran Marsupial at 16:47 PM on 28 September 2011Murry Salby - Confused About The Carbon Cycle
Anybody have any news on Salby's paper yet? I emailed him to enquire where it will appear but got no reply. -
Riccardo at 16:42 PM on 28 September 2011Monckton, the Anti-Nurse
"If the IPCC report, in total, can be considered climate theory" Quite a loose definition of climate theory. Climate theory describes how the climate system works, regardless of any human impact. There would be, and indeed there was, a climate theory even before significant anthropogenic emissions. If the theory highlights a problem, the possible solutions of the problem are not part of the theory. The law of gravitation does not include the best way to avoid an asteroid impact on the earth. -
Stevo at 16:39 PM on 28 September 2011Understanding climate denial
Whilst never being a denier, I did have some lingering doubts about AGW. Reading this site has certainly been an eye openner for me. SkS's insistance on citing peer reviewed science, and the helpful explanations of the regular contributors has shown me the direction in which the evidence overwhelmingly points. Oddly enough, a follow-on effect is that I'm more inclined to examine my decisions and attitudes on other topics more deliberately and critically as a result. -
Rob Painting at 16:22 PM on 28 September 2011Ocean Heat Content And The Importance Of The Deep Ocean
Critical Mass @ 46 - you'll have to be a tad more specific - BP covers a lot of ground there. Some of it is correct, some not so. -
adelady at 16:10 PM on 28 September 2011Review of Rough Winds: Extreme Weather and Climate Change by James Powell
Norman, have a really good, long look at the graphic in this post at CapitalClimate . Note that this catalogue of record breaking events is based on thermometers. Physical measurements unrelated to population or other issues. Just looking at the previous all-time record, the normal and the 2011 figures must give cause to pause. And then have a look at the ratio of cold/hot records set for August in the US. Something's going on.
-
SteveFunk at 15:41 PM on 28 September 2011Monckton, the Anti-Nurse
Stephen Baines, #11-- 50% is a high sample percentage if the participants are selected at random, but if the participants are self-selected, there is an inevitable bias. Hartz #12, Skywalker #13-- If the IPCC report, in total, can be considered climate theory, Part three, Mitigation of Climate Change, includes economics. It would be equally valid to define climate theory just as the physics and chemistry of climate change, but then you are just presenting a problem without a solution. -
skywatcher at 14:24 PM on 28 September 2011Review of Rough Winds: Extreme Weather and Climate Change by James Powell
Sphaerica, well said. What's also interesting is that five or ten years ago we weren't really having this discussion. There were a few wild events (e.g. the European heatwave), but for the most part, the extremes weren't breaking the mould. As you say, take that logic forward, and we'll see that we're on a trajectory. 5 or 10 years ago: "can't link this / that weather event to AGW, there's been extremes like this before". now: "blimey, there's a lot of very weird events happening, and quite a few records are being smashed, maybe these extreme events have a component of climate change within them?" in 10 or 15 years: "Ah. It's really obvious. The weather's totally mad and it's obviously closely linked to the much hotter world we created." By then it's too late to stop the next step, which might well be "Take cover all!" -
Bob Lacatena at 14:17 PM on 28 September 2011Monckton, the Anti-Nurse
20, Philippe, Actually, what I can't get used to is the fact that one political party, who is in a position of extreme responsibility and power within the U.S. government, invited him and the likes of him, and allowed him to testify, uncontested, before Congress, and they weren't woefully and publicly embarrassed by what he'd said and what they'd done by inviting him. I hope Monckton will be held accountable one day, but more importantly, I hope that the politicians who are selling out the future of this country by recruiting the likes of Monckton will be held accountable one day. -
Bern at 14:16 PM on 28 September 2011Monckton, the Anti-Nurse
Actually, as I understand it, Christopher Monckton is 3rd Viscount Monckton of Brenchley. And while he's not entitled to sit in the House of Lords, a quick search on Wikipedia reveals this article, which states: "The ranks of marquess, earl and viscounts commonly use lord as well" Not knowing much at all about peerages & titles, I can only assume that it's correct, and that he is entitled to use the title "Lord", although the frequent implication (and occasional outright statement) that he is a member of the House of Lords (sitting or not) is false. -
Philippe Chantreau at 14:09 PM on 28 September 2011Monckton, the Anti-Nurse
I know. The one thing I can't get used to is him lying to Congress. I seriously hope he will be held accountable some day. In the meantime, there should be no rest in debunking the nonsense he continuously spews. -
Bob Lacatena at 14:09 PM on 28 September 2011Review of Rough Winds: Extreme Weather and Climate Change by James Powell
Norman, I think that part of what you should recognize is that it is still very early in the climate game. We've barely raised temperatures so far, and we haven't yet reached the level of warming we've set the CO2 thermostat to. And yet we see events like these. But they're events that you can find wiggle room to argue about and doubt and tell yourself it's okay. When temperatures increase further, things will get more frequent and the things that do happen will be worse. You might be able to argue a bit by holding up 1980 or 1934 now, but in 10 or 20 years time there will be 5 new examples for every old one, and it will be obvious that they'll keep coming. And 10 or 20 years after that it will be that much worse still. I don't think you are that wrong to say "this isn't necessarily so different" right now. This event or that event might not be due to climate change. But I do think you are very wrong to be so focused on the present, with a hopeful eye towards the future, figuring that this is the worst it will get, and you can't even be sure this is related to climate change. It doesn't matter if this one event or that one event is or isn't a direct, attributable result of climate change. There will be more. They will get worse. And when that time comes, there will be no going back. There's no rewind-do-over-oops button that lets us undo the mistakes. If the day comes when you are able to sit down and say "wow, this sucks, and it's obviously due to climate change" then it's way, way too late. -
Brian Purdue at 14:00 PM on 28 September 2011Monckton, the Anti-Nurse
Philippe - That's why I put "Lord" in brackets - but try telling Monckton that. His rely was "get used to it". -
skywatcher at 13:59 PM on 28 September 2011Review of Rough Winds: Extreme Weather and Climate Change by James Powell
#81 - No worries! #80 - A variety of datasets indicate that disasters involving fire, flood and storm appear to be increasing more rapidly than do those involving earthquake or volcano (both absolute numbers as linked above, or insurance IIRC. Some, like Pielke, disagree based on their (limited) datasets. [I wonder how the earthquake or volcanic data would look with a 'Pielke correction' applied. Large decrease?] When geological disasters increase more slowly than weather disasters, what is your explanation? On contrails, your linked paper (Travis et al 2002) does not seem to be the end of the story: From the IPCC AR4 report: "The Travis et al. conclusions are weak because they are based on a correlation rather than a quantitative model and rely (necessarily) on very limited data (Schumann, 2005). Unusually clear weather across the USA during the shutdown period also has been proposed to account for the observed DTR changes (Kalkstein and Balling, 2004). " Where did the 1.8C number come from, as the maximum effect in Travis02 is much less than that? -
Norman at 13:47 PM on 28 September 2011Review of Rough Winds: Extreme Weather and Climate Change by James Powell
munoncounter @58 Have you looked at the drought of 1934 to compare it to 2011? Drought of 1934 to compare to 2011 August. The nice thing about the NOAA drought index is you can animate a month of data from 1900 to 2011. I suggest a try and you can see what is and is not normal. There have been some extensive and extreme droughts over this time period as well as some very wet years that cover large areas. Not sure about the extremes from the 2011 year when looking at the longer history of these type of events. -
Philippe Chantreau at 13:41 PM on 28 September 2011Monckton, the Anti-Nurse
Official letter at the UK parliament web site is here: http://www.parliament.uk/business/news/2011/july/letter-to-viscount-monckton/ -
Norman at 13:38 PM on 28 September 2011Review of Rough Winds: Extreme Weather and Climate Change by James Powell
skywatcher @79, Thanks for the clarification and I see what you were getting at. Sorry for the misunderstanding on my part. -
Philippe Chantreau at 13:36 PM on 28 September 2011Monckton, the Anti-Nurse
Monckton should not be referred to as "Lord" Monckton. He is not a member of the House of Lords. He has claimed to be a non-voting member but the House has issued a statement denying the existence of such a thing, and asking Monckton to cease claiming membership of any kind. His use of a symbol resembling that of the House is typical of his way of operating. -
Norman at 13:30 PM on 28 September 2011Review of Rough Winds: Extreme Weather and Climate Change by James Powell
adelady @71 I do look at links that others refer to. I am not convinced that things are worse. I do not think there is enough good data to determine at this time. I know about the many posts with disaster charts showing things are getting worse. I do not think a disaster classification is an independent variable. Basically a disaster deals with loss of life or property. Since property values and populations grow and move, it makes it an shifting variable. A means of describing extreme weather needs to be developed (like the tornado scale or hurricane scale) that does not depend upon people in the equation. Only wind speed and size are used to describe the severity of a tornado or hurricane regardless if this hurricane stays out at sea or the tornado only touches down in an empty field. It is a true independent variable. Once you would get enough of these logged and monitored you could make a claim if they are increasing or decreasing in number. Disaster statistics use the dependent variable (people and property both with vary and change or time and region). Here is my case in point. You have a flood plain. Has not seen a flood in 100 years but no one was living there. People decide it is safe and start moving on the plain. Then a flood comes and a situation that would not have been a disaster before has now become one because of the dependent variable involved. I know the most severe tornadoes have had a declining number over the years. -
skywatcher at 13:23 PM on 28 September 2011Review of Rough Winds: Extreme Weather and Climate Change by James Powell
Agreed muoncounter. #73 Norman, I'll have to spell out what I meant. It seems I missed a word in my comment above, I was talking about record average temperatures - my apologies for the confusion. I would hope you did not think the climate average monthly temperature for Dallas in August was 91F! Dallas August 2011: Average temp was 93.4F. The rest of the top 10 record average August temperatures, in a record that goes back to 1899 (I think): 91.1 (1952) 90.3 (1951) 90.2 (1999, 2000) 89.8 (2006, 2010) 89.3 (1943) 88.8 (1954) 88.5 (1980) from Norman's earlier NOAA link I'm not talking about smashing monthly averages, but smashing the monthly average records. Records such as these, involving averages, and involving a dataset going back many decades, ordinarily would be broken by a fraction of a degree here and there, maybe by up to 1F, especially when the dataset is shorter. At Waco the monthly average record fell by 3F, that is, the second-hottest ever month was 3F cooler than August 2011, for Dallas, the second-hottest month was 2.4F cooler than August 2011. That easily qualifies as "extreme". The average August temperature for Dallas (1899-2010) for reference is 84.9F, but the size of anomalies from the average depends on your climatology and continentality, so are not that relevant. Records falling by large amounts by comparison to the pattern of previous records is something to take note of. When this happens over a wide area and in different parts of the world, it's significant. -
Norman at 13:18 PM on 28 September 2011Review of Rough Winds: Extreme Weather and Climate Change by James Powell
skywatcher @72 "Norman, other's have already debunked teh contrails part, but I'll add that you continue to cherry-pick your numbers" I am not sure it has been debunked. The original researcher behind the claim still believes the contrails will reduce local DTR's by up to 1.8 C (around 3 F) I was on this thread about the topic: SkS thread on DTR topic. Check the link in Post 106 of this thread if interested.Response:[DB] "I am not sure it has been debunked."
Linear Contrails from aviation have a slight warming effect of +0.01 Wm-2.

Global mean radiative. Anthropogenic RFs and the natural direct solar RF are shown. (IPCC AR4 Section 2.1)
Please do the math and show us how a contrail radiative forcing of +0.01 Wm-2 translates into a reduction in local DTR's by up to 1.8 C?
Until then we will consider it debunked.
-
danno at 13:15 PM on 28 September 20112011 Sea Ice Minimum
watching how deep the denial goes today, it's hard for me to imagine there is any way to bring them around. -
Norman at 13:12 PM on 28 September 2011Review of Rough Winds: Extreme Weather and Climate Change by James Powell
muoncounter, If you would be so kind to inform me how you so easily post a graphic on the thread. My second attempt made a link to the graphic but it did not appear in the post. It might make it easier for people to follow if I post a graphic in my post.Response:[DB] If you go to the Posting Tips section, use the html string there with the width 450 limiter in it. Using that string, replace everything between the quote marks with your graphic's URL (in both places).
Use the Preview function to verify the image will appear before posting the comment.
-
Norman at 13:04 PM on 28 September 2011Review of Rough Winds: Extreme Weather and Climate Change by James Powell
Sorry for the mess, I will try once more to post an image. Response:
[DB] Fixed image.
-
muoncounter at 12:49 PM on 28 September 2011Review of Rough Winds: Extreme Weather and Climate Change by James Powell
Norman: See label: Warmest summer on record -- source
July daytime/nightime record highs
-- source
July daytime/nightime record highs
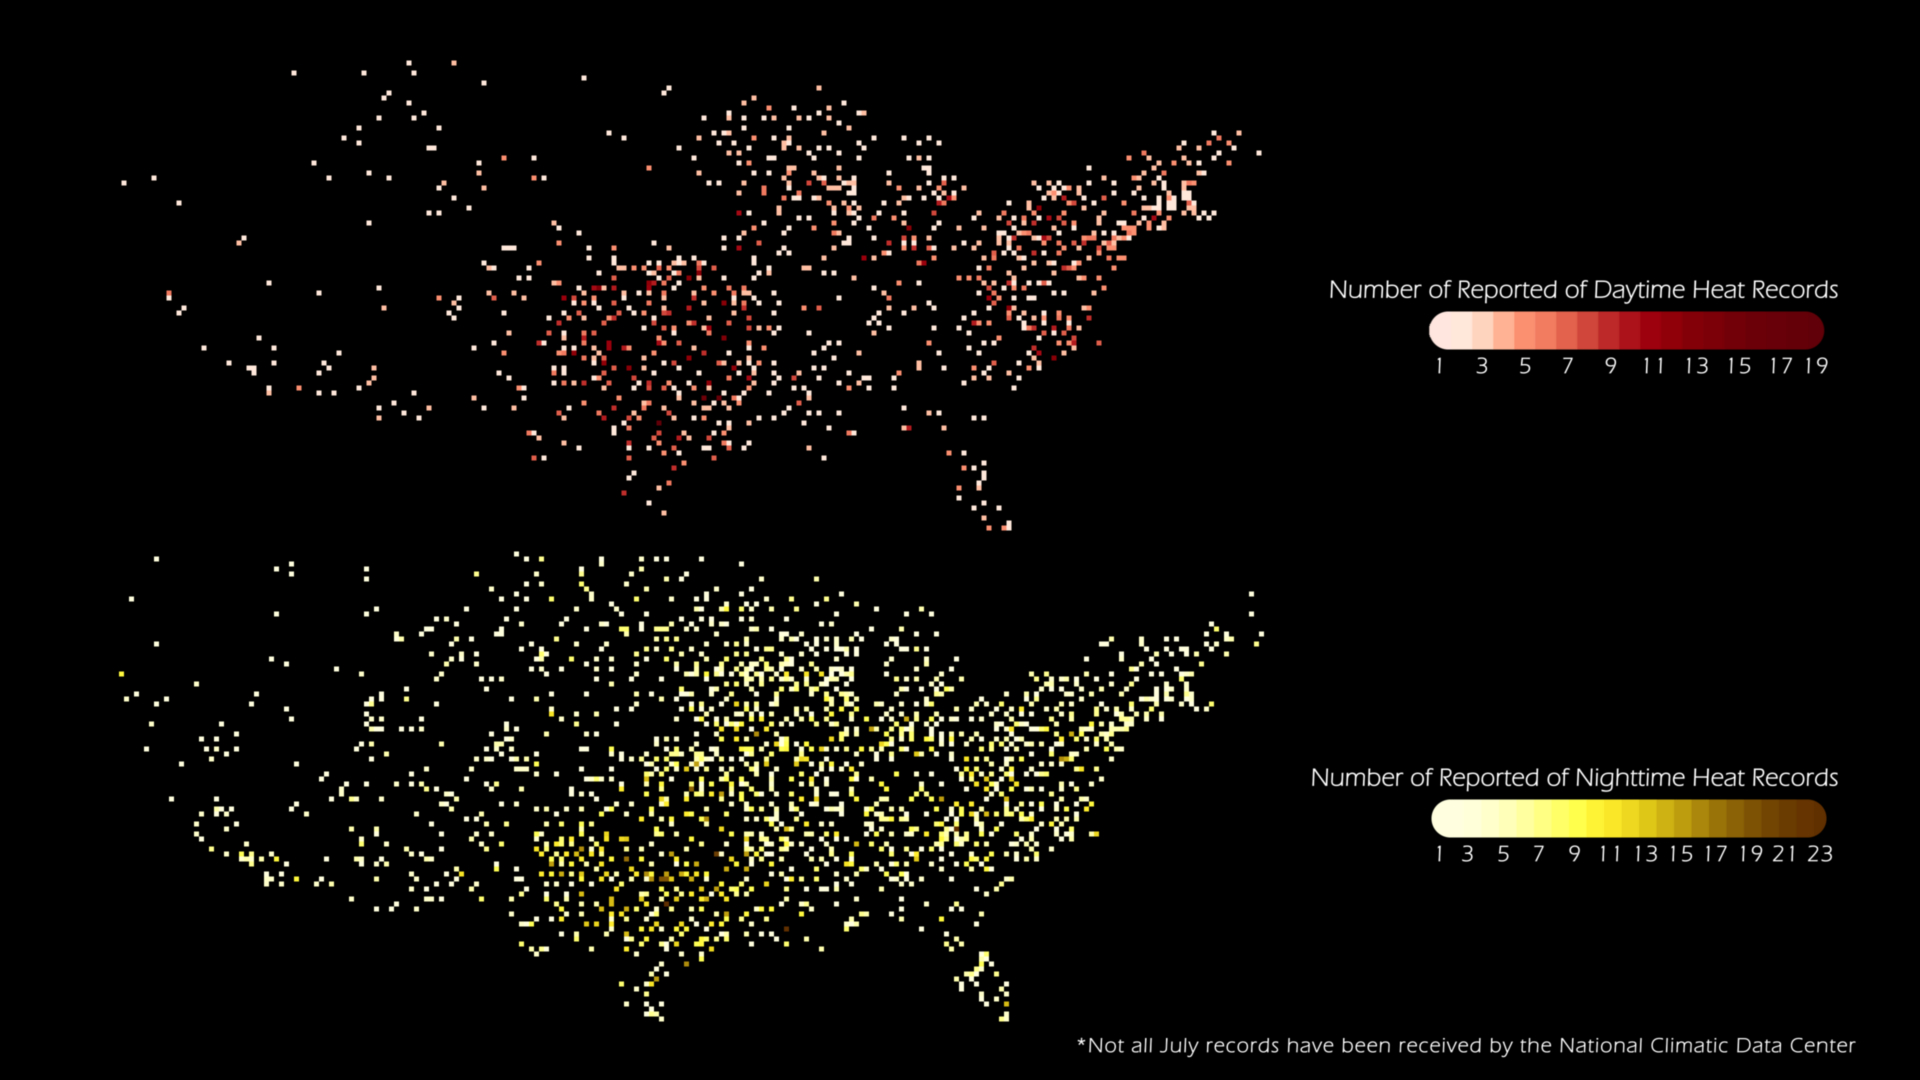 -- source
No one is saying that 1980 Dallas wasn't very hot. But the hallmark of this heatwave is that its not just very hot in Dallas, its not just very hot in Texas, its widespread and its very hot.
-- source
No one is saying that 1980 Dallas wasn't very hot. But the hallmark of this heatwave is that its not just very hot in Dallas, its not just very hot in Texas, its widespread and its very hot.
-
Norman at 12:16 PM on 28 September 2011Review of Rough Winds: Extreme Weather and Climate Change by James Powell
skywatcher @60 "Following the link on the NOAA page for Waco also shows the extremes. When average temperatures for a month are broken by >2F (Dallas) and 3F (Waco), and for the entire summer by >1F, you don't have to wonder if it is extreme. You do realise how hard it is to break a monthly average temperature record by that much?" I am not sure where you live but it is not as difficult to break monthly averages as you perceive. I have been logging daily temperature high and lows for Omaha Nebraska for a couple of years. I have the monthly anomalies for 21 months. Of those 21 months, 7 have anomalies above or below 3 F. Greatest high was around 7 above. in April 2010. Lowest was -6.58 in February 2010. Four more monthly anomalies were above or below 2 F. So 11 of the 21 were above or below 2 F. I cannot see how you conclude this is an extreme. -
Stevo at 12:05 PM on 28 September 20112011 Sea Ice Minimum
Danno, I fear your prediction is more accurate than wacky. -
jmsully at 11:56 AM on 28 September 2011Monckton, the Anti-Nurse
An apology from WUWT is out of the question since Monckton just doubles down. -
adelady at 11:36 AM on 28 September 2011Sea level rise due to floating ice?
agnostic, the volume of the ocean is 1.3billion cubic km. The maximum volume of Arctic sea ice 20-30 years ago was just over 30thousand cubic km. This year's minimum sea ice is a mere 4.3 thousand cubic km where the 'long-term average' minimum was ~13 thousand. In terms of affecting ocean wide salinity the figure to worry about is the minimum - or not. Seeing as we've already lost more of the old minimum, 9,000, than now remains at minimum, 4,300, any salinity impact should be showing up. My best guess would be that any further impact on oceans would be local and transient, as well as being totally swamped by other heating impacts. -
danno at 11:02 AM on 28 September 20112011 Sea Ice Minimum
here's a wacky prediction: they'll still be denying once we hit an ice free arctic for the first time. just a natural cycle, scientists want more grant money, government wants to tax you. -
Eric (skeptic) at 11:00 AM on 28 September 20112011 Sea Ice Minimum
FWIW, my sea ice prediction from last March is here: http://voices.washingtonpost.com/capitalweathergang/2011/03/weather_image_of_the_day_arcti.html (I post as eric654 there). My predictions of early loss and a July-August recovery were not too bad but not radical. The bottom line though I was wrong about the minimum and expected more ice than we now have. La Nina should have helped the ice and negative NAO should have also helped hold the ice (e.g.. http://rkwok.jpl.nasa.gov/publications/Kwok.1999a.pdf) -
Riduna at 09:56 AM on 28 September 2011Sea level rise due to floating ice?
If Arctic sea ice melts, it reduces ocean salinity. How does this affect ocean penetration by warmer currents such as the Gulf Stream? -
Brian Purdue at 09:46 AM on 28 September 2011Monckton, the Anti-Nurse
It’s nice to post to a website where the concentration is on genuine climate science – with the obviously needed rebuttal of climate skeptics. But this is a personal attack defence comment. (Lord) Monckton is the last person to be levelling the accusation of “troll” at anyone because trolling is his modus operandi (Monckton Latin speak for technique). Monckton finds an ideal home at WUWT because it invariably uses the word when anyone dares to challenge climate skeptic “orthodoxy”. They immediately get the troll label pinned on them, either by Watts or his willing outriders. A troll accusation was made against “The other Brian” by Monckton and Watts, so I suggest they both watch - http://www.youtube.com/watch?v=TRCyctTvuCo - and skip to 8 minute 25 seconds. The following proves that “The other Brian” had just transcribed, almost verbatim, (more Monckton Latin speak) the words used by Peter Hadfield (Potholer 54) in his forensic analysis of Monckton’s “Bunkum” science. Hardly trolling; but Monckton let fly with his well-worn brand of trolling - “The science is in, the truth is out, the game is up, and the scare is over. Get used to it, get real, get a job, and get a life”. What more needs to be said! PS I suppose an apology from WUWT would be out of the question? -
skywatcher at 09:45 AM on 28 September 2011Monckton, the Anti-Nurse
I wonder if Dr Pielke Sr still thinks Watts is devoted to the highest levels of scientific rigour, or whatever he said. Watts uncritically promotes Monckton's garbage (as well as that of D'Aleo and a load of others). You've got to love the hubris of the statement "With remarkably few changes, the present article comes to a legitimate conclusion opposite to that of Sir Paul." Gosh, I didn't realise you could totally alter a sentence with only a few changes. Gosh, I didn't realise you could totally alter an aardvark with only a few changes...
Prev 1467 1468 1469 1470 1471 1472 1473 1474 1475 1476 1477 1478 1479 1480 1481 1482 Next


