


 Arguments


Recent Comments
Prev 1474 1475 1476 1477 1478 1479 1480 1481 1482 1483 1484 1485 1486 1487 1488 1489 Next
Comments 74051 to 74100:
-
lucia at 05:06 AM on 24 September 2011Lessons from Past Climate Predictions: IPCC AR4 (update)
Hi Albatross-- I've commented here before. I just don't visit often and comment here less.Dana was simply being true to the original graphic that was shown.
It seems to me that being true to the original graphic would require Dana to use HadCrut. The original graphic containing data in this post appears to be the one Dana calls "figure 1" and corresponds to figure 9.4 in the AR4-wg1. The caption reads for figure 9.4 in the AR 4 reads:"as observed (black, Hadley Centre/Climatic Research Unit gridded surface temperature data set (HadCRUT3); Brohan et al., 2006)"
Dana's choice of GISTemp represents a switch to a different data set.I hope to see you acknowledge your own mistakes (we all make them, no shame in that) and correct your blog post too (if needed) so as to keep you readers informed.
Assuming your meant to suggest that the observations in Dana's figure 1 are from GISTemp, I hope to see you acknowledge your mistake. :) I conceded that the 2010 in it's entirely was not El Nino. Few years are all one thing or another. But the data in the figure are annual averages and the global surface temperature in 2010 was dominated by El Nino. This is particularly so because the temperatures lag the MEI. You may think it's a mistake to call it an El Nino year, but I consider 2010 an El Nino year and I consider choices of what to include in figures meaningful. I also consider the surface temperature for 2011 dominated by La Nina and I will continue to think so even if El Nino were to unexpectedly turn up at this point or even if it had turned up in August.. On your response to (c): None of those represents reason Dana can't write "was published in 2007' or "was published four years ago" rather than "was published recently". You think it's enough to have readers scan back? I don't. You think it's a nit-pick? I think Dana is using tendentious language and construction. So, there you go. Kevin CI'll write two responses on this. In this first one I'm going to disagree with Lucia and Carrick on the problems of polar temperatures in the ITRs.
I haven't suggested GISTemp is biased. I said that Dana chose the data set with the highest trend; this choice happens to better support this claim than choosing other trends. That's all I've claimed. In my original comment, I didn't point out that his choice of GISTemp results in an inconsistency in that his figure 1 and figure 3 use different observational data sets, but I have pointed that out at my blog. But since Albatross seems to be under the impression the choice of GIStemp results in consistency, I provide the caption for the IPCC figure showing they used HadCrut, not GISTemp. By the way- your pink figure with the observations is similar to the ones I plot when the final of NOAA, HadCRut and GISTemp post. I don't have any objection to someone showing all three observational data sets, or arguing that one is better than the others. But I do consider omitting a set cherry picking. For some reason I don't recall, I did 25 month smoothing a while back. (I think i've varied-- but right now for a quick look, the script has 25 months coded in:) The choice of 25 months means the peak lags the El Nino/La Nina cycle, so the averages were recently coming down from local maxima since monthly temperatures were lower than they were 25 months ago.
As Zeke was one of the discoverers of Dana's initial error, it cannot be supposed he is trying to distort the data.
Zeke coblogs at my blog; I agree he is not trying to distor the data. I'll have to ask Zeke if he discovered this before or after I published my blog post. :) I usually avoid speaking for Zeke as he is perfectly capable of speaking for himself. But I would like to point out that Zeke's figure doesn't appear to be either an endorsement nor a criticism of Dana's graph. When Zeke posted the graphic my blog, Bill noticed that Dana appears to shifted the baseline so that it doesn't match the one chosen by the. The IPCC projections are all "relative to a baseline of 1980-1999", but Dana appears to have picked a different one. Zeke then wroteBill Illis, I was trying to recreate his graph. In this case both have a 1990-2010 baseline period. It appears that Dana did graph the correct data, but incorrectly calculated the slope of the last decade. That said, comparing trends is much more useful, is its rather hard to eyeball correlation in noisy data.
There is further discussion of this. This is Zeke.Carrick, I think you have the legend backwards in your graph. This discussion does raise the interesting question of how to objectively determine the best baseline for use in comparison. Obviously for visual comparison purposes you would want to use a pre-validation period baseline, but I’m not sure how to choose between one (say 1950-1980) or another (1970-2000). For trends of course, it doesn’t matter.
Note that Dana does not use a pre-validation baseline. There are two things that need to be considered Dana's decision to pick a different baseline than that specified by the IPCC: 1) It's just choice Dana, not the IPCC made. 2) Dana did not disclose his rebaselining of the model and observations. 3) Using a baseline of 1990-2010 forces the means for the model and observations to match during that period. Models would have to be very, very bad for the differences to be apparent with this choice. Given this, it's not too surprising that the models seem to agree with data. Agreeing on average has been enforced by subtracting the difference in the means. Dana's choice to not use a "pre-validation baseline" tends to force better agreement between projections and observations; this is why it should not be used. On your response to (c): None of those represents reason Dana can't write "was published in 2007' or "was published four years ago" rather than "was published recently". You think it's enough to have readers scan back? I don't. You think it's a nit-pick? I think Dana is using tendentious language. So, there you go. Kevin CI'll write two responses on this. In this first one I'm going to disagree with Lucia and Carrick on the problems of polar temperatures in the ITRs.
I haven't suggested GISTemp is biased. I said that Dana chose the data set with the highest trend; this choice happens to better suppor this claim than choosing other trends. In my original comment, I didn't point out that his choice of GISTemp results in an inconsistency in that his figure 1 and figure 3 use different observational data sets. But since Albatross seems to be under the impression the choice of GIStemp results in consistency, I provide the caption for the IPCC figure showing they used HadCrut, not GISTemp. By the way- your pink figure with the observations is similar to the ones I plot when the final of NOAA, HadCRut and GISTemp post. I don't have any objection to someone showing all three observational data sets, or arguing that one is better than the others. But I do consider omitting a set cherry picking. For some reason I don't recall, I did 25 month smoothing a while back. (I think i've varied-- but right now for a quick look, the script has 25 months coded in:)
The choice of 25 months means the peak lags the El Nino/La Nina cycle, so the averages were recently coming down from local maxima since monthly temperatures were lower than they were 25 months ago.
As Zeke was one of the discoverers of Dana's initial error, it cannot be supposed he is trying to distort the data.
Zeke coblogs at my blog; I agree he is not trying to distor the data. I'll have to ask Zeke if he discovered this before or after I published my blog post. :) When Zeke posted the graphic my blog, Bill noticed that Dana appears to shifted the baseline so that it doesn't match the one chosen by the. The IPCC projections are all "relative to a baseline of 1980-1999", but Dana appears to have picked a different one. Zeke then wroteBill Illis, I was trying to recreate his graph. In this case both have a 1990-2010 baseline period. It appears that Dana did graph the correct data, but incorrectly calculated the slope of the last decade. That said, comparing trends is much more useful, is its rather hard to eyeball correlation in noisy data.
There is further discussion of this. This is Zeke.Carrick, I think you have the legend backwards in your graph. This discussion does raise the interesting question of how to objectively determine the best baseline for use in comparison. Obviously for visual comparison purposes you would want to use a pre-validation period baseline, but I’m not sure how to choose between one (say 1950-1980) or another (1970-2000). For trends of course, it doesn’t matter.
There are two things that need to be considered Dana's decision to pick a different baseline than that specified by the IPCC: 1) It's just choice Dana, not the IPCC made. 2) Dana did not disclose his rebaselining of the model and observations. 3) Using a baseline of 1990-2010 forces the means for the model and observations to match during that period. Models would have to be very, very bad for the differences to be apparent with this choice. Given this, it's not too surprising that the models seem to agree with data. Agreeing on average has been enforced by subtracting the difference in the means.Moderator Response: [Dikran Marsupial] Fixed a couple of blockquote tags, I hope this is what was wanted! -
JosHagelaars at 04:46 AM on 24 September 2011Lessons from Past Climate Predictions: IPCC AR4 (update)
I'm still figuring out the baseline used in Figure 3 of this post, see my reaction #19. I can create the last graph in reaction #23, the baseline there is 1990-2010. I can also create the RealClimate graph where the GISS data are downward adjusted with the Giss-T-average of 1980 - 1990 being 0.244. It seems to me the graph in Figure 3 is constructed with some sort of a difference in the averages of the IPCC and Giss data around 2000 and used that difference to adjust the IPCC data. Is that correct? When I adjust the IPCC data to the Giss baseline of 1951 - 1980, using an offset of -0.309, the model data are clearly above the Giss-T. Is there something with the model data which explains these differences? It's probably me, but I still don't get that. -
Review of Rough Winds: Extreme Weather and Climate Change by James Powell
Jonathan - the "Absolutely yes" in my reply was to "is the climate really different". I found your "nothing more than a temperature change" the odd part of that paragraph. A temperature change is a climate change, affecting weather, plant life, sea level, etc. My apologies if that was unclear. Did you follow the Antarctica link I provided? Did you see Fig. 2, where an entire group of studies show a high rate of mass loss, a factor more than 5x higher than the study you point to? I believe that the weight of evidence (so to speak) points in the direction of significant Antarctic mass loss, although you have found a (single) study that disagrees. -
silence at 04:33 AM on 24 September 2011Galactic cosmic rays: Backing the wrong horse
No. I'm suggesting that there wasn't a big climate change as a result of the Laschamp excursion, which had a much bigger change in cosmic ray impacts on the Earth's atmosphere than the recent variations we have seen. This would imply that the smaller more recent variations would have no discernible impact. -
dana1981 at 03:52 AM on 24 September 2011Lessons from Past Climate Predictions: IPCC AR4 (update)
Robert #27 - well said. That's exactly why I didn't use HadCRUT - we know it's biased low, so why use it? Of course we know certain parties want to use it precisely because we know it's biased low. -
Jonathon at 03:50 AM on 24 September 2011Review of Rough Winds: Extreme Weather and Climate Change by James Powell
KR, First off, Antarctic ice is not decreasing at a considerable rate. In fact, the change in mass does not exceed the measurement uncertainties. http://www.springerlink.com/content/9k58637p80534284/ I find your last paragraph somewhat confusing. First, you agree with me (absolutely yes), then you say that I am astoundingly wrong. All this, while you seem to agree with my position about what constitutes a climate change. [inflamatory deleted]Moderator Response: [Dikran Marsupial] Please keep the discussion civil. -
muoncounter at 03:45 AM on 24 September 2011Galactic cosmic rays: Backing the wrong horse
silence#2: "Laschamp excursion" Per Guillou 2004, the global decrease in magnetic field at 40kya was "revealed in polar ice as an abrupt change in the rate of cosmogenic nuclide flux." No one is questioning modulation of GCR flux by the interplanetary magnetic field and geomagnetic field. But did whatever internal mechanism that caused the Laschamp also affect temperatures? That makes GCR flux a symptom, not an agent of climate change. A geomagnetic excursions hasn't happened any time lately: These events, which typically last a few thousand to a few tens of thousands of years, often involve declines in field strength to between 0-20% of normal. Are you suggesting recent climate change is due to a new Laschamp-type event? Are we in the midst of one? Where's your evidence of that? -
John Hartz at 03:42 AM on 24 September 2011Lessons from Past Climate Predictions: IPCC AR4 (update)
@Noesis #24 Would you be interested in joining the SkS author team to work on this? -
Alexandre at 03:39 AM on 24 September 2011Lessons from Past Climate Predictions: IPCC AR4 (update)
Man, I wonder if those more beligerant commenters have the same standards of criticism when they read something at WUWT. -
Review of Rough Winds: Extreme Weather and Climate Change by James Powell
Jonathan - For your reference, a Strawman Argument is a logical fallacy where one argues against a distorted, exaggerated or misrepresented version of someones position, rather than their actual position. As a logical fallacy, it proves exactly nothing. Antarctic ice is not stable at all - while sea ice has increased a bit, land ice is decreasing at a considerable rate. Your statement is flatly wrong. "...if climate change does not refer to a wholesale conversion, then it is nothing more than a temperature change. Is the climate really different if spring arrives a week (or two) earlier, more rain and less snow falls, and temperatures are higher?" Absolutely yes. Even a slight temperature change can change rainfall patterns, melt polar ice, alter the crops that can be grown in a particular region, shift pests into areas that never had them before, and lead to multiple species extinction as habitats go away. I find that last paragraph of yours rather astoundingly wrong. -
muoncounter at 03:30 AM on 24 September 2011Galactic cosmic rays: Backing the wrong horse
DOlivaw#1: You're correct, of course. Better to say that the sum total of years of cosmic ray activity isn't connected to climate. -
Paul from VA at 03:28 AM on 24 September 2011Lessons from Past Climate Predictions: IPCC AR4
@Muoncounter #22, I created a new temperature trend chart with thicker lines. Updated graph link Y axis is start year. X Axis is length of data in years fit. This is all monthly GISTEMP data, but one can get similar results for HADCRUT or UAH data sets. I got all of my data from wood for trees. Years with a disproportionate influence on temperature trend show up as a diagonal down and/or horizontal line. Pinatubo for instance, shows up as a cool diagonal (trends ending on it are cooler) and a warm horizontal (trends starting from it are warmer). -
Stephen Baines at 03:21 AM on 24 September 2011Galactic cosmic rays: Backing the wrong horse
Brother, I have to work on my typing/prepost editing. -
Stephen Baines at 03:20 AM on 24 September 2011Galactic cosmic rays: Backing the wrong horse
It would actually be really neat if this GCR idea turned out to be true. Is it likely ,too? No. But that is exactly what would make it so cool! The things is, the odds of GCRs leading to a reassessment of AGW is even more unlikely than the odds of GCRs being important to climate. The physics of GHG is pretty clear, and we're doing a fine job of prediction without GCRs. If GCRs are playing a role, understanding that role is likely to put the effect of GHG on climate into even more relief by reducing the background "random" noise a bit more. That gets buried in this terrible framing of climate science as GHG vs everything else. It's a complete distortion of the real scientific debate. This is not an alternative hypothesis counter to AGW, it is an additional hypothesis that could move the science forward. -
silence at 02:59 AM on 24 September 2011Galactic cosmic rays: Backing the wrong horse
I'd love to hear more about the Laschamp excursion, and the non-impact that had on the climate. -
robert way at 02:58 AM on 24 September 2011Lessons from Past Climate Predictions: IPCC AR4 (update)
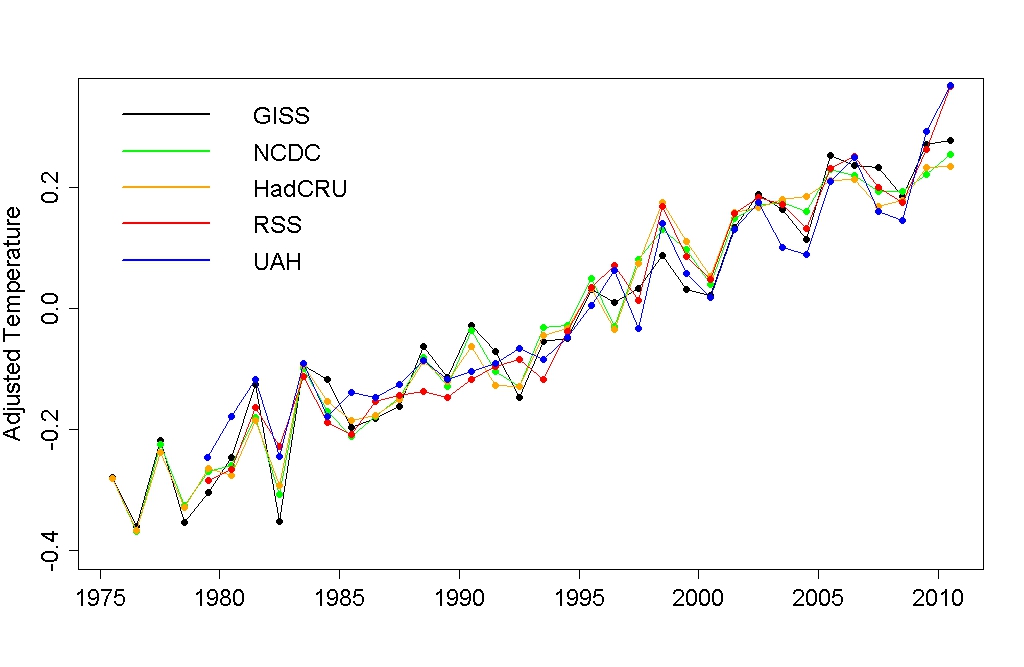
I tried posting this at Lucias but it didn't work so since it is related I will bring it up here: Re: Lucia #81953 "While saying it, Dana could still admit that that particular choice for observational data set gives the largest observed trend and happens to support the narrative s/he is conveying to his/her reading audience." "Dana might want to include the observational data set that happens to be the IPCC’s choice in their figure. I’m pretty sure that’s not GIStemp. It’s HadCrut." They may have chosen to use HadCrut but will they in 10 years? My guess is no. It has been demonstrated by others (including JeffID) that Hadleys method will ALWAYS underestimate the trend. We all know that so why is there even a debate on this subject? ECMWF has already also concluded that Hadley has undersampled the warmth, particularly in the Arctic. This is also something we know. I'm getting tired of people saying "the IPCC did it so we can too" despite the huge differences in knowledge we have on these issues. We can't just plug our ears and pretend like Hadley isn't undersampling the warmth. Maybe some people would like to. I can tell you straight up for a region I've submitted a paper on Hadley's method wouldn't even work going back past 1950 despite using a Least Squares method allowing the reconstruction back into the 1880s. This is called an evolution of science and we now know that if you want to use less available station data. Use Hadley. Real "Skeptics" want to evaluate as much data as possible... And for those people who comment on GISS polar interpolations I hope you have the same reservations about UAH which does a similar process? Where is the arms up in the air over that? Can you pick which one is usually always undersampling Arctic warmth from this: It is a no brainer... Let us have a look at the residuals versus all methods... oh wait, it appears Hadley is underestimating the warmth greater through time and it is statistically significant... i.e. undersampling the trend.

-
Jonathon at 02:54 AM on 24 September 2011Review of Rough Winds: Extreme Weather and Climate Change by James Powell
Sphaerica, For some reason, you seem to like strawmen. I do not know what implications they have. As I mentioned earlier, it may be more a matter of semantics, but your observation list is not examples of a changing climate, but simply, a temperature increase (by the way, Antarctic ice mass is relatively stable). Finially, if climate change does not refer to a wholesale conversion, then it is nothing more than a temperature change. Is the climate really different if spring arrives a week (or two) earlier, more rain and less snow falls, and temperatures are higher? -
DaneelOlivaw at 02:53 AM on 24 September 2011Galactic cosmic rays: Backing the wrong horse
Interesting if now confusing and complex. Just one nitpick, wouldn't it be more correct to say: "Thus one of the strongest known GLEs, producing much more ionization than the typical GCR, had no direct connection to WEATHER." A sudden increase in ionization, no matter how strong, would only affect the weather for a short amount of time so in the context of those experiments it's seems to me that it's not right to talk about climate. -
Stephen Baines at 02:48 AM on 24 September 2011SkS Responses to Pielke Sr. Questions
mea culpa...my followup to VTG @75 was also not helpful. Though technically correct and useful context, background chatter has an influence on the tone of the debate and distracts from the clear flow of ideas. It had the effect of amplifying the general group tone of frustration... Dana @ 160. Just to be clear, you are right of course that Pielke touched on much of what the webpage conclusions say - but I would say in a rambling diffuse way, albeit sometimes punctuated by moments of clarity. My thought was that the webpage conclusions provide the skeleton of his position in clear and concise terms. The comments offer some color and detail that fills in the gaps in those conclusions in a bit. -
dana1981 at 02:03 AM on 24 September 2011Lessons from Past Climate Predictions: IPCC AR4
That's pretty good Zeke. My only concern is the choice of baselines - my thought being that since the IPCC model projections begin in 2000, for the best comparison (if you're trying to evaluate the model accuracy), that's when the models and data should match up. My approach was to take the 5-year running average for both models and data, and adjust the baseline such that they match in 2000. -
Zeke Hausfather at 01:56 AM on 24 September 2011Lessons from Past Climate Predictions: IPCC AR4
Here is what I would consider the ideal version of Dana's Figure 3: It uses all three major surface temp series as well as the 1980-1999 baseline generally used by the IPCC for instrumental record/model comparisons.
-
dana1981 at 01:28 AM on 24 September 2011Lessons from Past Climate Predictions: IPCC AR4 (update)
Excellent explanations by Tom Curtis in #23. I don't have much to add, except on the point of choosing 2000 as the starting point. The explanation is quite straightforward - that's the year the IPCC projections begin, as you can see for yourself by examining the data file linked in the post and here. People need to bear in mind that SkS is not RealClimate or the Blackboard or any other site. Lucia for example has a very specific target audience, which is different from the SkS target audience, which is as broad as we can make it. Yes, I could have done a more detailed analysis including error bars and such, but this post is intended for a general audience, which might be turned off by too much statistical detail. On SkS we have a wide variety of posts and technical levels, in keeping with our basic, intermediate, and advanced myth rebuttal levels. This post (in fact most of the 'Lessons' series) is intended for the basic and intermediate level audience, who may be interested to know approximately how well models project temperature changes. Pete - yes, there's also JMI. I don't know the details about that data set though. -
Bob Lacatena at 01:15 AM on 24 September 2011Review of Rough Winds: Extreme Weather and Climate Change by James Powell
6, Jonathon,I am not sure we can say that the climate has changed.
Yes, and no. We cannot say the climate has changed yet. That's the whole point. If we wait that long, it's game over. But it is in the process of changing and we know that on our current course it will change. We can certainly say the climate is changing. The number of extreme events and the extremity of those events has certainly increased. Other observations, such as the loss of ice mass in Greenland and Antarctica, the retreat of glaciers, earlier springs, and many others all emphatically demonstrate that the climate is in fact changing. Your premise that it has not changed yet is a strawman. Similarly, your later implication that climate change be defined as the wholesale conversion of entire ecosystems ("Temperate regions are still temperate, semi-arid are still semi-arid, polar, etc.") is another strawman. If you think that such dramatic and unassailable changes are the only things that will affect the future of mankind, you are in for a shock. -
Pete Dunkelberg at 00:46 AM on 24 September 2011Lessons from Past Climate Predictions: IPCC AR4 (update)
Isn't there also a Japanese global temperature data set? If so, it may be an interesting topic for another post. -
Noesis at 00:44 AM on 24 September 2011Lessons from Past Climate Predictions: IPCC AR4 (update)
I would like to make a suggestion to the operators/moderators about the format of SkS. I read some of the posts on the blogs lambasting SkS over the updated article issue, and I can't help but agree with some of the points they raise. I think it might be in SkS's best interest to keep a "Wiki-like" history link at the top of the articles so that people can go back and see previous versions with a short explanation of why they were updated. I think it's perfectly reasonable to update articles as new evidence emerges and actually a good thing, but I also understand that people who are not inclined to be favorable to anyone who agrees with the mainstream consensus will use the updated article talking point to try and discredit the site. A history section for each of the "permanent" pages would mute complaints of sneaky updating, and allow you to keep old comments around for future reference, simply move the old version of the article with comments intact into the history section and allow the new updated article to start over with a blank comment section. I'm under no illusions that this will be easy or fast to implement, but it's a suggestion on how you might improve the site to make it more resilient to criticisms that you are "covering up" errors. I've been reading this site for a while now, and think it's a very useful reference and hope my suggestion can help make it even better.Moderator Response: Thank you. This is a good idea. -
chris at 00:27 AM on 24 September 2011CERN - Saying Nothing About Cosmic Ray Effects on Climate
tblakeslee, The 62 co-authors didn't make a "brave decision". They participated in a study and rightfully have their contributions acknowledged as co-authors. That's how science stuff works. There is nothing whatsoever that is controversial about the most recent study from the CERN CLOUD study, nor is there anything very controversial about Svensmark's original observation that cosmic-ray-sourced electrons can influence the aersol particulation of sulphuric acid in a chamber with controlled humidity levels. What was controversial is the assertion that variations in cosmic ray flux have a significant effect on climate mediated through cloud formation. Whether this hypothesis has any merit in the real world, we know that it has negligible relevance for the very marked warming since the middle of the 20h century. -
tblakeslee at 00:04 AM on 24 September 2011CERN - Saying Nothing About Cosmic Ray Effects on Climate
sorry about the repost. I was trying to refresh. Do you really believe that Kirkby got in trouble back in 1998 for telling the press,"The theory will probably be able to account for somewhere between a half and the whole of the increase in the Earth's temperature that we have seen in the last century," After more than a decade of battles to get the CLOUD experiment done, he is much wiser now. You are right that CERN papers often have a long list of authors. People want to share the credit for significant experiments. The 62 co-authors of this paper made a brave decision to lend their name to the work even though it was very controversial because it replicated and extended the results of Svensmark's SKY experiment which was soundly rejected by the establishment. You are also right that there is new work on the sun showing that Alfven waves account for the high temperature of the corona. Alfven tried unsuccessfully to sell this idea starting in 1942. In spite of his Nobel prize, he was often forced to publish his work in obscure journals. Most astrophysics textbooks still virtually ignore his work, which is essential for understanding the magnetic fields that keep us safe from cosmic rays and affect cloud formation over the oceans. -
Jonathon at 23:51 PM on 23 September 2011Review of Rough Winds: Extreme Weather and Climate Change by James Powell
Well said CB. The Current Texas drought is ocurring during a La Nina. Previous La Ninas have not resulted in drought, however, the worst droughts have all occurred during La Ninas. Therefore, I would agree with your statement about this weather event being more likely, but not caused by La Nina. Similary, La Nina enhances Atlantic hurricanes, but SST, the jet stream, wind shear and other weather systems all combined to influence Irene. Individual weather events are the result of several factors acting together. While the temperature of the planet has changed over the past 150 years, I am not sure we can say that the climate has changed. This may be more an issue of semantics, but the majority of the world has only experienced minor temperature and precipitation changes. Temperate regions are still temperate, semi-arid are still semi-arid, polar, etc. I firmly believe that there is a big difference between an increased likelihood of certain weather events, and global climate change. -
John Hartz at 23:48 PM on 23 September 2011SkS Responses to Pielke Sr. Questions
@Actually thoughtful #186: I generally concur with your assessment. I specifically agree that a comment thread is not the ideal venue for a discussion of matters of science. For better or for worse, it was the only venue available in this particular instance. As I have previously stated, I made some rookie mistakes as the primary moderator of this thread and regret not having deleted the first five comments. Having said that, I was disappointed in Dr. Pielke's abrupt departure. The dialogue between Dr. Pielke and Albtross is typical of what occurs between scientists in the peer review process. -
Tom Curtis at 23:43 PM on 23 September 2011Lessons from Past Climate Predictions: IPCC AR4 (update)
Carrick @16: 1) Given three data sets, a, b, and c, which have not been falsified as indices of Global Mean Surface temperature, congruence of the multi-model mean with any of the three means the multi-model mean has not been falsified as a projection of future evolution of the multi-model mean. As the lack of falsification is all that Dana claimed, no issue arises from his choice of just one index, Gistemp, to compare the multi-model mean with. 2) In fact there is good reason to believe that two of the indices understate trends in GMST, in that they do not include data from a region known to be warming faster than the mean for the rest of the globe. In contrast, while there are unresolved issues relating to Gistemp, it is not clear that those issues have resulted in any significant inaccuracy. Indeed, comparison of Gistemp north of 80 degrees North with the DMI reanalysis over the same region shows Gistemp is more likely to have understated than overstated the trend in that region: Your claim that gistemp's method of extrapolation is untested is simply false. What is more, I would suggest this is not a case of your having knowledge from peer reviewed literature of a lack of testing; but rather of you having simply made the claim up because you did not know the contrary and the claim was convenient.
3) Dana uses the average of the model runs because weather is chaotic, so that no individual run can be considered a prediction. The model mean, however, can be considered a projection of the "typical" weather state, something which can be projected. In contrast, the mean of the temperature indices does not represent a "typical" weather state. Rather it represents one possibly accurate measure of one particular evolution of the weather over time. There is no reason to believe that mean is a more accurate measure than Gistemp, and indeed given considerations under point 2 above, it is likely to be less accurate than gistemp.
However, because the model mean is a statistical prediction, what it predicts is not the global temperature at any give time. Rather it predicts that the global temperature will lie within its error bars 95% of the time, and that the long term trend will closely match the long term trend of the multi-model mean. To that extent, while your criticism is entirely invalid, that of Kevin C @18 is not. A correct presentation would be similar to that by Real Climate (moderator inline comment @18). That Dana chose a less technically correct comparison for purposes of simplicity is unexceptional, however, in that it leads to no misunderstanding.
4) Dana did not choose 2000 as the start year. The IPCC chose 2000 as the start year of model projections both in its graphic (see figure 2 in the main post) and in the data. Given that Dana was commenting the IPCC's projections, he was constrained to use the same start date for those projections as the IPCC's projections. You are in fact criticizing Dana here for not misrepresenting the IPCC projections.
There could not be a clearer example of somebody determined to criticize without regard for the merits of the case than you have provided by this example.
However, your suggestion of using Tamino's ENSO corrected temperature index has merit:
Your claim that gistemp's method of extrapolation is untested is simply false. What is more, I would suggest this is not a case of your having knowledge from peer reviewed literature of a lack of testing; but rather of you having simply made the claim up because you did not know the contrary and the claim was convenient.
3) Dana uses the average of the model runs because weather is chaotic, so that no individual run can be considered a prediction. The model mean, however, can be considered a projection of the "typical" weather state, something which can be projected. In contrast, the mean of the temperature indices does not represent a "typical" weather state. Rather it represents one possibly accurate measure of one particular evolution of the weather over time. There is no reason to believe that mean is a more accurate measure than Gistemp, and indeed given considerations under point 2 above, it is likely to be less accurate than gistemp.
However, because the model mean is a statistical prediction, what it predicts is not the global temperature at any give time. Rather it predicts that the global temperature will lie within its error bars 95% of the time, and that the long term trend will closely match the long term trend of the multi-model mean. To that extent, while your criticism is entirely invalid, that of Kevin C @18 is not. A correct presentation would be similar to that by Real Climate (moderator inline comment @18). That Dana chose a less technically correct comparison for purposes of simplicity is unexceptional, however, in that it leads to no misunderstanding.
4) Dana did not choose 2000 as the start year. The IPCC chose 2000 as the start year of model projections both in its graphic (see figure 2 in the main post) and in the data. Given that Dana was commenting the IPCC's projections, he was constrained to use the same start date for those projections as the IPCC's projections. You are in fact criticizing Dana here for not misrepresenting the IPCC projections.
There could not be a clearer example of somebody determined to criticize without regard for the merits of the case than you have provided by this example.
However, your suggestion of using Tamino's ENSO corrected temperature index has merit:
 The trend of the temperature indices once corrected for ENSO, VEI, and solar variation? 0.17 degrees C per decade, against which the 0.18 degrees C per decade AR4 projection is not bad at all. (Note, Tamino only reports the trend over the entire 1975-2010 interval. By eye, the 2000-2010 trend does not differ significantly, but you are welcome work it out more accurately.)
5) Dana did use consistent baselines. This can be seen by comparing his figure 3 with Zeke's version of Dana's original figure (or indeed the RC graph inline @18):
The trend of the temperature indices once corrected for ENSO, VEI, and solar variation? 0.17 degrees C per decade, against which the 0.18 degrees C per decade AR4 projection is not bad at all. (Note, Tamino only reports the trend over the entire 1975-2010 interval. By eye, the 2000-2010 trend does not differ significantly, but you are welcome work it out more accurately.)
5) Dana did use consistent baselines. This can be seen by comparing his figure 3 with Zeke's version of Dana's original figure (or indeed the RC graph inline @18):
 As Zeke was one of the discoverers of Dana's initial error, it cannot be supposed he is trying to distort the data.
Moderator Response: fixed comment per user request
As Zeke was one of the discoverers of Dana's initial error, it cannot be supposed he is trying to distort the data.
Moderator Response: fixed comment per user request -
VeryTallGuy at 23:42 PM on 23 September 2011SkS Responses to Pielke Sr. Questions
Well, now the dust has settled a little I’d just like to add my thanks to the mods and also to agree with those suggesting a slightly different way of engaging with Dr Pielke in the future. I’d also like to acknowledge my #75, even if within the comments policy, was unhelpful – borne not just of frustration on this thread but also an earlier encounter linked up the thread. Notwithstanding that, finally I’d like to thank Dr Pielke for his time here and hope he comes back again. I learned from both of his forays to this site. -
Jonathon at 23:03 PM on 23 September 2011Lessons from Past Climate Predictions: IPCC AR4 (update)
Yes Tom, In another 10 years or so, if the projection matches observations, then it will add another piece. -
dorlomin at 22:39 PM on 23 September 2011Lessons from Past Climate Predictions: IPCC AR4
dana1981Wow I didn't even have to wait until morning. Lucia sure is quick on the draw.
dana is being personally singled out for attention by the 'lukewarmers'. It is their modus operandi. -
Tom Curtis at 22:15 PM on 23 September 2011Lessons from Past Climate Predictions: IPCC AR4 (update)
Jonathon @20, Dana states that the AR4 projections "will add another piece" (my emphasis) to the puzzle of climate sensitivity, and goes on to indicate that it will take another 10 years of data to do so. -
Jonathon at 21:55 PM on 23 September 2011Lessons from Past Climate Predictions: IPCC AR4 (update)
With regards to which observational data aset should be used, that would rely on which set was used in order to determine the projections. Therefore, whichever temperatures were used in Figure 2, should be used in Figure 3. As mentioned by Dana, the temperature observations will fall within the uncertainy range in the projections, although the uncertainty range in not clearly stated. It appears that the quoted observed trend of 0.15C/decade is from 1/1/2000 through the end of 2010; GISS data to the present yields a trend of 0.12C/decade. It appears that this is still within the uncertainty range, but on the low side, which Dana clearly states. Dana does fine stating, "The IPCC AR4 was only published a few years ago, and thus it's difficult to evaluate the accuracy of its projections at this point." However, claiming that this adds another piece to the puzzle of climate sensitivity, is a bit premature. No conclusion can be drawn yet as to the accuracy of the projection. -
JosHagelaars at 21:54 PM on 23 September 2011Lessons from Past Climate Predictions: IPCC AR4 (update)
Informative post, thanks. I tried to reproduce the Figure 3, but maybe I'm using a wrong offset in constructing the graph. Using the GISS data from and de IPCC data as referenced here, I get an average for the IPCC data (20C3M values) of -0.309 °C for the period 1951 - 1980. This period is the baseline of the GISS data. Correcting the IPCC data with this offset I get a graph where the A2 scenario is higher than the one shown in Figure 3. For instance the value for the A2 scenario for 2000 is 0.256, using my offset I get 0.565. Eyeballing the value in figure 3 for A2 in 2000, it is about 0.45. Could somebody please explain my error and what the offset should be ? -
CBDunkerson at 21:32 PM on 23 September 2011Review of Rough Winds: Extreme Weather and Climate Change by James Powell
The whole question 'what caused weather event XYZ' is inherently flawed. You'll frequently hear 'skeptics' claim things like, 'no it was not global warming, it was El Nino'... seemingly unaware that this claim is just as clearly false as blaming global warming alone would be. If the ENSO cycle were "responsible" for the recent Texas drought/wildfires, Mississippi flooding, hurricane Irene, massive tornadoes, et cetera (as many 'skeptics' confidently proclaim) then we would see these events during every ENSO cycle. We do not, because weather is never 'caused' by just one thing. The very concept of the 'butterfly effect' demonstrates this... it argues that in a chaotic system (like Earth's weather) small changes (like a butterfly displacing air by flapping its wings once) can cause large deviations (like a hurricane which would not otherwise have occurred). The aspect of the concept which many people seem to miss is that there are ALOT of butterflies in the world. Along with billions of other things which influence the weather. If a different butterfly on another continent gets hit by a car that could prevent the butterfly-hurricane from forming. Ditto a cloud drifting between the sun and an area of blacktop and thus preventing a thermal updraft from forming. Et cetera. ENSO, like global warming, just makes certain kinds of weather more likely. It does not 'cause' them entirely on its own any more than global warming does because all weather events are caused by the collective action of billions of factors. That being said, global warming has changed the climate of the entire planet. Some butterflies which would not be alive had AGW not taken place are... others have died because of AGW. Evaporation, clouds, precipitation, albedo, and dozens of other factors have changed the world over. Thus, it could be reasonably said that ALL weather we see now is due to global warming. It is all an aspect of the current climate, which has been changed by AGW. Thus, I can guarantee that if the past 150 years or so of global warming had not taken place Hurricane Irene would not have happened exactly the way it did. It could have been nice and sunny... or there could have been an even worse storm, but that exact weather event would not have taken place. Far too many of the 'butterflies' which contributed to the way it played out were changed by AGW. So really, as the article above also notes, the only meaningful metric of the 'effect' of global warming (or ENSO) on the weather is a change in frequency of various types of events. -
Antarctica is gaining ice
DB I see that the responses to the comments in question have been updated and the whole thing makes perfect sense now. Tone trolling should rightly be ignored, but IMO Bishop Hill did have a point, although they vastly overstated the significance of it. That Sks is coming under fire presumably means you're doing a good job, so keep it up! -
Kevin C at 20:55 PM on 23 September 2011Lessons from Past Climate Predictions: IPCC AR4 (update)
The more serious problem with this article in my view is the quoting of trends without error estimates, or indeed at all. If an undergraduate quotes a trend in a lab report without a standard deviation, uncertainty interval or P-value, we have to mark it down, and rightly so. And if we calculate uncertainties on the any of the ITRs over the last 11 years what do we find? IIRC we can't distinguish between then, or between them and the 4AR estimate, or between them and the no-warming case. (Sorry, I should check that, but I don't have my code to hand. Bear in mind to get the right answer you have to factor in the autocorrelation - both Lucia and Tamino have written on this at length, but as a crude estimate multiply the OLS estimate of standard deviation of the gradient on the monthly data by 2.5. As a sanity check, calculate 12 month and 22 month non-overlapping averages for the 11 years and calculate a gradient on the averages - you should get roughly the same uncertainties in each case.) That's ignoring the uncertainty in the 4AR projections, which is substantial. Visually, you can draw a whole range of gradients, including negative ones, within the uncertainty bounds. Factor in that and the whole exercise is completely meaningless. What is the correct way to present an discussion of the 4AR predictions, given that there isn't enough data to draw any real conclusions? Maybe we can have a constructive discussion of that? What I would do is plot the AR4 data with the uncertainty intervals from 1990-2020, and plot the ITR moving average on top of it. For reasons stated above I still prefer GISS, but you could plot all three. Ideally of course this would be updated annually. Something like this figure from the Monckton article "IPCC overestimate temperature rise": The other thing that is missing, which formed an important part of some of the other articles is a comparison of the emission predictions - both GHGs and aerosols, and also discussion of which scenarios are most realistic and why.
Moderator Response: [grypo] Real Climate also used a similar method.
The other thing that is missing, which formed an important part of some of the other articles is a comparison of the emission predictions - both GHGs and aerosols, and also discussion of which scenarios are most realistic and why.
Moderator Response: [grypo] Real Climate also used a similar method.
-
Lazarus at 20:50 PM on 23 September 2011Review of Rough Winds: Extreme Weather and Climate Change by James Powell
I love the graphic - it reminded me of something... http://lazarus-on.blogspot.com/2011/01/what-is-one-degree.html Don't worry, I didn't try to copyright it. In fact I wish I could have stolen it for my own use. -
Kevin C at 20:31 PM on 23 September 2011Lessons from Past Climate Predictions: IPCC AR4 (update)
I'll write two responses on this. In this first one I'm going to disagree with Lucia and Carrick on the problems of polar temperatures in the ITRs. This is speculative and of general relevance rather than specific to this post, but I think there is a good basis for arguing that the GISTEMP approach is less biased than HADCRUT or NOAA. This is a good topic for further study. In the second I'll suggest why I think the article above still needs a rewrite. So, polar temperatures. Everyone is familiar with the concept of polar amplification? Here's a figure from U Columbia, although we should really recalculate it without NASAs interpolation: . Clearly the arctic at least is behaving rather differently than the rest of the planet. Again, as a further check we would want to do some sort of test of sensitivity to choice of stations, cross validation, bootstrap etc.
If we use the HADCRUT/NOAA method of simply omitting the arctic, then that is the same as saying the the arctic is behaving as the average of the rest of the planet. That doesn't look like a good starting hypothesis to me. Doesn't it seem more likely that the N pole is behaving more like the nearest arctic stations, rather than postulating a another inflection with latitude?
Another interesting experiment would be to calculate a global temperature from Nick Stokes' spherical harmonics in the latest version of TempLS. My guess is that these will show a higher trend than GISTEMP, because I suspect the pole will show as a peak. If might be possible to test whether it is physically meaningful by cross validation.
. Clearly the arctic at least is behaving rather differently than the rest of the planet. Again, as a further check we would want to do some sort of test of sensitivity to choice of stations, cross validation, bootstrap etc.
If we use the HADCRUT/NOAA method of simply omitting the arctic, then that is the same as saying the the arctic is behaving as the average of the rest of the planet. That doesn't look like a good starting hypothesis to me. Doesn't it seem more likely that the N pole is behaving more like the nearest arctic stations, rather than postulating a another inflection with latitude?
Another interesting experiment would be to calculate a global temperature from Nick Stokes' spherical harmonics in the latest version of TempLS. My guess is that these will show a higher trend than GISTEMP, because I suspect the pole will show as a peak. If might be possible to test whether it is physically meaningful by cross validation.
-
Antarctica is gaining ice
Given the concerns on Bishop Hill I would suggest that Sks remove comments 3, 5 and any other early comments that were replying to this post before it was updated to make a definite distinction between land and sea ice. If Sks did, for example, write the response to comment 3 after updating the post, then (-Accusations of dishonesty snipped-), when it actually seems like they were pointing out that the original incarnation of this page was unclear and certainly incomplete. I hope the Sks team sees my point. Our 'side' of the debate is by far the stronger, supported as it is by the weight of peer-reviewed science, and so there need be no reliance on misinformation, no matter how small a nugget of misinformation it is. Therefore all humility and reticence must be shown on sites like Sks, and things like this that have been overlooked must be corrected. Not doing so risks giving those of an anti-science persuasion an excuse to focus on something other than the science! Of course, the current incarnation of this page is an excellent description of the state of Antarctic ice, no problems there.Response:[DB] Accusations of dishonesty snipped.
"Therefore all humility and reticence must be shown on sites like Sks, and things like this that have been overlooked must be corrected."
SkS endeavors to keep its focus on the science, not on rhetoric, ideology or invective. Hue and cry from the "skeptics" on things transparently not based in science amount to little more than tone trolling and are typically ignored.
However, your point is made, taken and noted.
-
damorbel at 19:53 PM on 23 September 2011The 2nd law of thermodynamics and the greenhouse effect
Re #288 [trolling snipped] Moderator Response: [Dikran Marsupial] you wrote:- "It is not acceptable for any poster to disrupt the discission in this manner" Dikran, I just do not agree with your physics.Moderator Response: [Dikran Marsupial] Note yet again I have pointed out your error (I did specify what kind of temperature measurement I discussed) and again you do not acknowledge your error (if it was me I would have appologised - we all make mistakes, it is no big deal, unless you can't acknowledge them, in which case you have entirely the wrong attitude for scientific discussion). If you don't agree with my physics, just possibly it is because your understanding of the phycics is wrong, rather than that of the worlds climatologists and physicists. However you will convince nobody that your position is correct if you conduct the discussion in the manner that you have chosen. To be clear, we welcome a discussion of the physics, but not constant repetition of arguments that have been refuted repeatedly already on this thread and on others, without addressing those refutations -
damorbel at 18:55 PM on 23 September 2011The 2nd law of thermodynamics and the greenhouse effect
Re #283 Moderator Response: [Dikran Marsupial] you wrote:- "you that was arguing that CO2 in the atmosphere has no effect on temperatures not me" With thermodynamics you have to be precise, What temperature are you referring to when you speak of a planet's temperature? [trolling snipped]Moderator Response: [Dikran Marsupial] Sorry this is blatant trolling. I specified mean surface temperatures (I have put it in bold now to make it more obvious), so I specified exactly what I meant. Enough is enough, if you continue in this manner I will reluctantly recommend that your posting privelidges are rescinded. It is not acceptable for any poster to disrupt the discussion in this manner. -
Carrick at 17:01 PM on 23 September 2011Lessons from Past Climate Predictions: IPCC AR4 (update)
Albatross: I'm afraid nit picking is not constructive, especially when the nits have no basis or are in error. I hope to see you acknowledge your own mistakes (we all make them, no shame in that) and correct your blog post too (if needed) so as to keep you readers informed. Best, Albatross. Just because you assert this doesn't make it so. There is nothing "nit" in the points that Lucia has made. 1) Dana has chosen the highest of the three surface temperature records to compare against. This is a fact not a nitpick. 2) While there is an argument for using GISTEMP, it's not a very good one...GISTEMP relies on an untested method for extrapolating temperatures into the high Arctic, one that is is likely wrong. 3) Further there is an inconsistency in methodology here: Dana uses the average of the models, which is not actually a defensible thing to do, but selects out a single temperature series (the one with the most rapid growth in temperature, [inflamatory deleted]) to compare against as the "exemplar" that other temperature series must live up to. 4) By innocently selecting 2000 as his starting year, he's front-loaded his data with a low-valued extrema, which has a substantive effect on the temperature series. 2000 was in the throes of a La Nina cooling event, he either needs to correct for this (see how on Lucia's or Tamino's blog), or he needs to shift his starting point to 2001. Doing this latter operation changes the slope from 0.15°/decade to 0.074°C/decade. 5) He needs to use consistent baselines in making the comparisons. A factor of two isn't a "nit". Picking a starting year that contains an outlier isn't a nit. Using inconsistent baselines is not a nit. And by the way 2001 is the start of the decade, not 2000, so the "we picked 2000 to represent the start of the decade" argument doesn't fly either. If you want my recommendation [inflamatory deleted] I would use the mean of the temperature series if you're going to compare to the mean of models. It's at least a consistent treatment. Here is my own version of Dana's graph. It clearly labels the "verification period" (where data was available to compare the models against, which ended in 2004 for AR4) versus the "validation period" (where data were not yet available, but are now) I don't personally make a huge deal of the disagreement between model and data over that period, other than to state it exists. [inflamatory deleted]Moderator Response: [Dikran Marsupial] While constructive criticism is very welcome here, posturing and inflamatory statements are unhelpful and should be avoided, by both sides of any disagreement. -
Rob Painting at 16:37 PM on 23 September 2011It's the ocean
Dana69 - See SkS post: Ocean cooling corrected, again And note the warming oceans down to 1500 metres:
-
actually thoughtful at 16:04 PM on 23 September 2011SkS Responses to Pielke Sr. Questions
Response to moderator comments @182 John Hartz - yes there was muted appreciation for Dr. Pielke's presence here, surely you would agree that a very public (as in posted on his blog site if he allows comments anywhere) thank you from John Cook (as the man behind SkS) would be a class move (or directly to his email if he doesn't allow comments anywhere). Perhaps this has been done. I do NOT subscribe to the false equivalence of deniers and scientists, however I do accept that Dr. Pielke has studied this stuff for a lifetime, and I think his presence on this site is a credit to John Cook and other long-time SkS folks - you have created a site where Dr. Pielke wants to present his case. As far as how it might seem to Dr. Pielke - imagine if you were invited to present/defend a post on WUWT - you might have trepidation (and again, I am not presenting any false equivalence between WUWT and a real science site like SkS). You can thank him for his participation and not dwell on his departure. Daniel Bailey - your internet-as-the-great-equalizer is, in general, a great perspective. I personally was thrilled/humbled when Dr. Trenberth wrote a post on SkS - but I didn't think my post was in any way as important or informative as Dr. Trenberth's. While I don't disagree with Dr. Pielke's science (in so far as I understand it), I still wonder what the fuss is about. He could say "well we need to reduce CO2 regardless" and be consistent with his science, he appears to enjoy controversy for controversies sake (the whole non-dichotomy of option 2A and 2B being a case in point). So, given that I disagree with his conclusions (me short for Pielke shorter: "lets obfuscate instead of acting") I still think he should receive the same respect that Dr. Trenberth received. While of course all posts here (at least after moderation) were at a reasonably high level, I could feel a very different attitude towards Dr. Pielke, perhaps due to the difference in their scientific positions. Mainly I thought the wall of posts/questions would be hard for anyone, let alone someone out of his comfort zone, to respond to in a useful way. It comes down to whether you put "internet equality" ahead of truly understanding Dr. Pielke's position. As many have noted, a blog comment section, as currently structured, is not the optimum forum for that. Thus my original comment at 182. I personally don't think internet equality applies when you have invited a person noted in their field to your site. They should be at least the first among equals, if not given a different/special platform for communicating their opinion. Now if Dr. Pielke wants to comment on a thread he is not featured in, I certainly agree that his posts should be treated exactly like everyone else. But it feels impolite to invite him over for tea (as it were) and then ambush him (again, no bad intentions, just what the medium creates) with endless questions, counters, etc. For the sake of clarity: I don't think Dr. Pielke's reference to papers he has written was particularly helpful (nor his apparent evasion of direct, germane questions), but I do think he deserves a charitable viewing of his argument, especially after SkS invited him over.Moderator Response:[DB] Thanks for the perspectives; thoughtful as usual.
My point, distilled, is that all are held to the same standard here. Many comments were deleted from the thread, but none of RPSr. Though perhaps many should have been. So claims of unfair moderation may have some truth in that everyone else here was held to a higher standard of conduct than RPSr.
[John Hartz] I'm not aware that "many" comments were deleted from this thread. Perhaps you are referring to the thread of Dana's initial article where many commenst were in fact deleted? -
Albatross at 15:50 PM on 23 September 2011Lessons from Past Climate Predictions: IPCC AR4 (update)
Hello Lucia, Welcome to SkepticalScience. I'm very sorry that you have some misgivings about this site and even some suspicions it seems, but please do not be so quick to judge. We appreciate that you assisted earlier in identifying flaws, it is important to get things right and Dana corrected the error lightning speed. While we welcome your opinions, I'm afraid that your minor points have their own issues: "a) Included other observational data sets like HadCrut and NOAA. (If s/he thinks they are inferior GISTemp, s/he should say why he thinks so.)" What Craig said @12. I think that you know as well as we do that each of the datasets has its limitations. What do you think is the best GAT analysis and why? Dana was simply being true to the original graphic that was shown. "b) Discussed whether the comparison in his figure ends with an El Nino year vs. La Nina year. (BTW: If the observations ends with 2010, it ends with an El Nino). The models average over numerous cases so its not important for the models but it matters for the observations." As it happens that is not quite as straight forward as your presume, because 2010 was a transition year. The CPC ONI data show that El Nino conditions persisted until April, with a short window of neutral conditions, followed by the formation of a La Nina in JJA. So while the impacts on global SATs would have potentially lingered for 5 months or so after the El Nino, is is not strictly correct to say that "If the observations ends with 2010, it ends with an El Nino" as you did, 2010 actually ended in a strong La Nina. Besides, as noted by Alex @11, the trend was calculated through mid-2011. "c) Mention the exact year when the AR4 was published rather than merely saying it was published "recently". After mentioning the year, he should explain why his comparison starts in 2000. (Whatever the reason for his choice, he should give it.)" Please read the first sentence of the post. It starts"In 2007, the IPCC...". Also, the year appears in a light blue banner in some of the pages linked to, or in the case of the very first hyperlink to "Chapter 8", the following is also printed at the top of the page: "Climate Change 2007: Working Group I: The Physical Science Basis". I'll let Dana explain why he starts in 2000-- it probably has something to looking at decadal trends. I'm afraid nit picking is not constructive, especially when the nits have no basis or are in error. I hope to see you acknowledge your own mistakes (we all make them, no shame in that) and correct your blog post too (if needed) so as to keep you readers informed. Best, Albatross. -
NewYorkJ at 15:30 PM on 23 September 2011Lessons from Past Climate Predictions: IPCC AR4
I'm reminded of this one just a few days ago, Dana. Anthony Watts: "Oh dear, now we have three peer reviewed papers (Lindzen and Choi, Spencer and Braswell, and now Richard P. Allan) based on observations that show a net negative feedback for clouds, and a strong one at that. What will Trenberth and Dessler do next? Maybe the editor of Meteorological Applications can be persuaded to commit professional suicide and resign?" Bart summarized the incident here. What's remarkable is the above line by Watts remains in the post, shrillness and all, long after some, including the author of the paper he's botching, corrected him. Strange. -
dana1981 at 15:25 PM on 23 September 2011Lessons from Past Climate Predictions: IPCC AR4 (update)
lucia - you are of course entitled to your own opinion, but your own opinion seems to consist of whole bunch of nitpicks [you should have explained 'x' and 'y']. There are a million things I 'could have' explained, and what I 'should have' explained [especially your examples] is extremely subjective. You also might want to read the second word in the post, and also the title of Figure 3. I'm relieved to see that I'm not the only one who makes errors.

Prev 1474 1475 1476 1477 1478 1479 1480 1481 1482 1483 1484 1485 1486 1487 1488 1489 Next


