


 Arguments


Recent Comments
Prev 1562 1563 1564 1565 1566 1567 1568 1569 1570 1571 1572 1573 1574 1575 1576 1577 Next
Comments 78451 to 78500:
-
Tom Curtis at 09:16 AM on 20 August 2011A new SkS resource: climate skeptics and their myths
guinganbresil @53: 1) A person can reasonably be understood as insisting upon the logical consequences of that on which they do insist. Insisting that the names of proponents of views not be mentioned when discussing those views, or that opinions not be indexed by their proponents has the effect of granting the benefit of anonymity to people who are using their apparent immunity to criticism in public life to launch vicious and slanderous attacks against climate scientists. 2) It is quite clear that Skeptical Science has not personalized this. They have done no more than index opinions by the names of the authors of those opinions. The fact that those people espoused those opinions was already a matter of public record, so if anybody has personalized this, it is those authors in not issuing anonymous opinions. You seem fundamentally confused about the difference between critiquing a persons views and launching an attack on their person. Skeptical Science does the former. It tries to restrict the later with its comments policy. Les @10 was frankly, talking nonsense. This is a witch hunt, what we see above is an index. -
Tom Curtis at 09:07 AM on 20 August 2011A new SkS resource: climate skeptics and their myths
guinganbresil @53, like it or not, the first recorded use of the word "denier" was in 1536 (Shorter Oxford English Dictionary). That it was then used some 450 years later to describe holocaust deniers is no reason for it to be suddenly cease being used in any other context. In particular, that climate change deniers are working themselves into a manufactured outrage over that descriptive term is no reason to cease accurately describing them. -
RickG at 08:42 AM on 20 August 2011There is no consensus
Rickoxo, What about Anderegg 2010? -
keithpickering at 08:41 AM on 20 August 2011Settled Science - Humans are Raising CO2 Levels
Minor quibble: The sentence reading: "because plants have a preference for the lighter isotopes (carbon-12 and 13); thus they have lower carbon-13 and 14 to 12 ratios. " ... would be better read as: "because plants have a preference for the lighter isotope (carbon-12); thus they have lower carbon-13 and 14 to 12 ratios." -
Bob Lacatena at 08:40 AM on 20 August 2011There is no consensus
406, Rickoxo, You seem to put a lot of thought into this. I think part of what you need to realize is that this need for scientifically establishing a consensus is itself a red herring. People don't ask to see scientific proof that scientists believe that the genetic code surrounding ATCG is accurate, or that planets really have been discovered around other stars. What we have is: 1) A branch of science where the people who work in the field know what is accepted and what is not to varying, imperfectly fuzzy degrees (i.e. normal science) 2) A group of people who have questioned the validity of the science because they don't like the answer 3) The fact that the vast majority of people in the field do accept the science and the conclusions as far as they go 4) A group of people who then take it a step further and question not only the science, but whether scientists actually agree about the science 5) A scientist who created a study to determine the strength and characteristics of any consensus 6) A group of people who then take exception to the study, insisting that it is invalid for various reasons (not a representative sample, not a well worded question, not applicable to the problem as a whole) Do you see a pattern here? Do you see this happening with any of the other thousands and thousands of areas of science? My own opinion concerning your opinion is that if you don't trust the consensus or Doran, then do what the rest of us have done... read enough scientific papers to move beyond trying to water the consensus down to a yes no question and a percentage of respondents, and instead read enough of the current literature to realize how few people disagree and how many people do agree with each other's findings. Personally, I do wish Doran would repeat his study to accomplish what you're asking. Make it a long questionnaire, with more specific questions and a larger population sample. But honestly, I don't see the point, and I don't need that degree of analysis to define the consensus for me, and I think that most people (I'm not saying you) who are requiring that sort of proof of consensus are just going to move on and add a point number 7 (and then 9, and then 11) to my list above. -
guinganbresil at 08:38 AM on 20 August 2011A new SkS resource: climate skeptics and their myths
Tom Curtis @44, at no time did I "insist that not only should deniers be able to libel climate scientists and launch vicious attacks against climate scientists, but they should also have the advantage of effective immunity..." It is undeniable that Skeptical Science has "personalized this": Names & Pictures, references in the comments to "rogues gallery", "dammed(sic)" etc. The question is whether or not it stoops to Alinsky's level. les @10 rightly warns of a "witch hunt" domain. Moderator [JC] @40, from your response I understand where you are headed with this new SkS resource - it is reasonable and I believe it can be done professionally. I apologize for my evisceral response @40. On my first read, I saw "denier" vice "skeptic" in the post and my error put the whole post in a very negative light - admit it or not, the term "denier" is a not-so-veiled allusion to "Holocaust Denier". There are plenty of other sites to organize personal attacks, it would be a shame for SkS to join them.Moderator Response: [Dikran Marsupial] The term "denier" is in no way an allusion to holocaust denial. "Denial" has a specific meaning in psychology that is pretty close to its usage here, note that Wikipedia gives defintions of:- simple denial - deny the reality of the unpleasant fact altogether
- minimisation - admit the fact but deny its seriousness (a combination of denial and rationalization)
- projection - admit both the fact and seriousness but deny responsibility.
-
Rickoxo at 08:15 AM on 20 August 2011There is no consensus
I get that Doran (2009) is just one study, but we can't argue about every paper and every thread all at the same time, so it makes sense to me to see what Doran (2009) actually proves, especially since I had never heard of it before I got here and folks on this site brought it up and cited it as evidence. DSL, I have no problem saying CO2 is a mechanism for warming and represents the significant role humans have played, I accept that 100% and I bet that most skeptic scientists would agree as well. The issue is the jump you're making from Doran's simple two questions (has the planet warmed since 1800 and have humans played a significant part) to your statement that accepting those two is essentially accepting the theory of AGW. Doran says pretty much what you said at the end of his piece, "It seems that the debate on the authenticity of global warming and the role played by human activity is largely nonexistent among those who understand the nuances and scientific basis of long-term climate processes. I agree that the planet has warmed since 1800, but agreeing with that does not in any way commit me to agreeing that humans caused the majority of that warming. The biggest flaw in Doran's survey is the wording of the human impact question. Having a significant effect does not mean anything about size. You said you were in ed research so you know tests for significance mean very little, effect sizes are everything. I get CO2 has gone up, I mostly get it causes warming but I am not convinced how much warming it's caused, what percent of the variance in temperature from 1800 till now has been caused by humans. Doran never asked this question so he has no grounds to speculate on an answer and when folks here cite the results from this survey as an example of agreeing with AGW science in general, that jump doesn't follow from the data. It could follow from all sorts of other places, but it doesn't get any support from Doran (2009). When Doran said there is no debate over the role of played by human activity, he has no evidence for that statement. The wording of his human impact question is so poor that it leaves open all sorts of possibilities for yes answers on the survey that wouldn't at all indicate agreement with ICPP conclusions or even his own summary. Because he included nothing at all about the degree to which human activity is responsible for the warming since 1800, the degree to which human activity explains the variance in temperatures, just saying 90%+ of scientists surveyed agree that human activity deserves to be in the list of factors is not a helpful piece of information. It says nothing about Doran being a fraud or dumb or anything, just that that survey question isn't useful in supporting the argument for a strong statement of consensus (like IPCC 2007). It also doesn't in any way imply there isn't consensus, it gives no evidence against consensus, but Doran (2009) is not evidence of a consensus of any significant position. If I were a scientist receiving this survey and unless I wanted to lie to thwart what I thought was the intention of the survey, I'd answer yes to both of those questions as well and I don't know of many skeptics that wouldn't as well. But when you have a question that doesn't reliably differentiate betweeen two fairly distinct groups of participants, it's just a bad question. And since we've never seen any of the other data and Doran says these are his two most important findings, it pretty much knocks out any usefulness of his study. In the light of this site as a model of peer review, I saw a response to Doran by Murray Goot (http://www.garnautreview.org.au/update-2011/commissioned-work/the-%27scientigic-consensus-on-climate-change%27.pdf). The author made the same point I'm making, that the question is so poorly worded as to make it of little value, but the author goes on to give a broader lit review saying there's other evidence of consensus so Doran isn't necessarily wrong. Again, I'm saying nothing about there not being consensus, I'm not saying Doran did fraud or anything bad. Writing surveys is incredibly challenging work and sometimes in writing questions, you come up with ones that don't actually give you the information you were hoping to get at. I'd love to see folks on this site get that Doran (2009) is fundamentally flawed and stop referring to it as evidence of consensus. -
Tom Curtis at 07:59 AM on 20 August 2011Settled Science - Humans are Raising CO2 Levels
Dana and Mark, excellent post! You mention that d13C has been declining since about 1850. This is well illustrated by measurements taken from corraline sponges: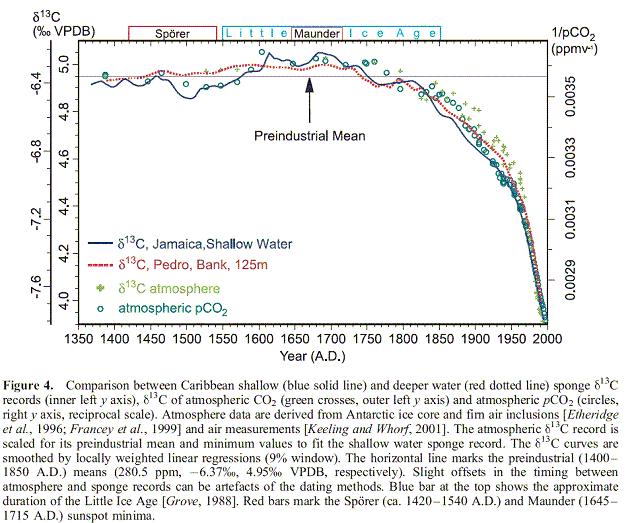 The secondary source of the image is from Ferdinand Engelbeen. Although he is a skeptic of AGW, he retains his ability to think critically, and his page on CO2 is an excellent resource, as is his take down of Beck's nonsense.
Interestingly, Engelbeen has posted his arguments on Wattsupwiththat, so Anthony Watts knows the evidence against Salby's view. Indeed, reading Watt's post on Salby, he never endorses Salby's views. Rather he couchs all comments of the impact of Salby's views in conditionals. It appears he is just feeding his sharks some climate denial chum.
The secondary source of the image is from Ferdinand Engelbeen. Although he is a skeptic of AGW, he retains his ability to think critically, and his page on CO2 is an excellent resource, as is his take down of Beck's nonsense.
Interestingly, Engelbeen has posted his arguments on Wattsupwiththat, so Anthony Watts knows the evidence against Salby's view. Indeed, reading Watt's post on Salby, he never endorses Salby's views. Rather he couchs all comments of the impact of Salby's views in conditionals. It appears he is just feeding his sharks some climate denial chum.
-
Anthony Mills at 07:41 AM on 20 August 2011Climate Skeptic Fool's Gold
My apologies:an attempt to be brief led to a misleading statement.The"about 2W/m2 "was intended to be an indication of the change in radiation forcing due to observed CO2 increases,and this change is at least an order of magnitude less than the latent heat transport.My comment is a response to dana's statements "Climate models have already proven that they can make accurate predictions" and"Because it is based on solid,fundamental physics,climate science---" Central to computer climate models is the coupling at the air-ocean/land interface through a surface energy balance in which the latent heat component is so much larger than the changes in CO2 radiation forcing under consideration .Can this component be calculated using"solid fundamental" physics with a meaningful error bound? If not ,I doubt whether the models can make satisfactory "predictions" of CO2 effects. -
Bob Lacatena at 07:06 AM on 20 August 2011Models are unreliable
382, rcglinski, I'm not sure that anyone could do what you ask except for a primary researcher working with the model in question, and then I think that compiling and presenting that information is a fair amount to ask of that person, even with their familiarity. I also think the models are so complex that the result may be many, many pages long, and require a lot of supporting information. All in all... I think (I could be wrong) that your request is way, way out of line with what is reasonable. Anyone who has that level of interest needs to go to the models and look at them themselves. Beyond that, there is a huge, huge wealth of information below these comments, under Notes, including links to papers, pages about modeling, and blog articles. Maybe a list of links to the pages for the GCMs, as well as those that can be downloaded and run by the really ambitious, should be added to that, but again... if you're that involved that you're going to do that much work, then you can use Google to find them.Response:[DB] Bob, I don't believe the Notes section is viewable. If there's a relevant section in it, you may want to post it in a comment.
-
DSL at 06:39 AM on 20 August 2011A new SkS resource: climate skeptics and their myths
Coincidentally, I just read the first chapter of Stuart Ewen's PR! A Social History of Spin. It is indirectly relevant to this and other threads, and it may answer guiganbresil's concerns about why this thread attacks individuals and, as in neilrieck's link, "Why Americans Continue to Deny Climate Change." Briefly: because SkS wouldn't exist if concerned science knew how to effectively battle the forces arrayed against it. The science doesn't explain itself. Explaining the science isn't enough. Every attempt to misrepresent the science must be addressed, and that must be done efficiently, because organized misinformers are allowed every PR trick in the book. They don't have to make sense; they just have to do what it takes shift public opinion. It then becomes efficient to attack individuals who have become PR-bots repeating the same range of arguments--not ideology-driven arguments, but arguments for the sake of power: arguments for the sake of opinion-making. Devalue a robot to the extent that it becomes useless, and the purchaser of robots is forced to buy another one. And occasionally one of these discarded robots rediscovers his/her humanity. Hammer Bastardi's bizarre physical model. Hammer Spencer's Fun With Variables. Hammer Salby's New Improved Physical Model for a New, Postmodern, A-Historical You. Hammer E&E and their potpourri of industry-friendly, uhhh, research. Hammer their "science" through them. Kill two birds with one stone. As for neilrieck's linked question "Why?": because they've been largely constructed to be receptive to the tools that power uses to make their opinions. Conspiracy? Not at all. Read the chapter. -
BKsea at 06:34 AM on 20 August 2011Settled Science - Humans are Raising CO2 Levels
The response to skepticism of human generated increases in C02 in the atmosphere seems simple to me. We know we transformed a lot of carbon from oil/coal into atmospheric CO2. If some of it has not accumulated in the atmosphere, where did it all go? It did not turn back into oil. Please point to it and demonstrate that it is there now. Likewise, if temperature rise caused natural increases in CO2, it had to come FROM somewhere. Please point to where it was and demonstrate that it is gone. (OK, this is just conservation of mass, but I think it makes the point better than saying "what about conservation of mass" to people who don't understand science) -
rcglinski at 06:10 AM on 20 August 2011Models are unreliable
This page could be improved a lot by considering at least one global circulation model. Pick one that's referenced in IPCC AR 4, describe the initialization state, describe the data series being fed as inputs, show the output over the time period between when the model was written and the present, then compare its predictions to predictions of less complex models like a time series. I actually think a lot of folks who come to this page will be surprised by the lack of such a comparison.Moderator Response: [Dikran Marsupial] You can probably find most of this at climateprediction.net, although you would have to add the time series models yourself. I am not sure there is much point in comparison with the time series models, for a start would they give coherent spatial predictions? This sort of comparison has been done, and the model runs etc archived (search for CMIP3). However writing a good blog article on this would be a huge amount of work and beyond my capabilities (and I have worked with the models!). -
MA Rodger at 06:00 AM on 20 August 2011Settled Science - Humans are Raising CO2 Levels
I seem to be accused @#7 of suggesting that the laws of physics can be rewritten or suggesting some inter planetary flux of CO2 is a possibility. I'm sure more mundane speculations can be dreamt up to fit the role - mundane but of course still fantasy. The carbon cycle is very strongly "settled" as described @#9. It is highly improbable that this siutation will be scientifically challenged. Any scientific challenge really must address that "settled" status quo as emphasised @#8. -
pbjamm at 05:58 AM on 20 August 2011Debunking Climate Myths from Politicians
Here is a refreshing change of pace from Republican Presidential hopeful Jon Huntsman: "To be clear. I believe in evolution and trust scientists on global warming. Call me crazy." -
neilrieck at 05:50 AM on 20 August 2011A new SkS resource: climate skeptics and their myths
While browsing through books in Toronto stores this past week, I noticed that only a small number of books on "climate change" were located in the the sections labeled "general science" or "geoscience". The majority of "climate change" books were found in the section titled "History & Political Science" and included authors like Spencer and Plimer. I'm not sure who suggested this organizational scheme to the bookstores but I think it is safe to assume that anyone outside of the influence of Rupert Murdoch's "megaphone" (publishing and broadcasting empire) already knows the truth. Unfortunately, the fossil-fuel industry is still making such obscene amounts of money that there is no way petroleum businesses in Canada, the United States, or Australia will ever give up without a fight. (think "big tobacco"; they never really went away) Why do Americans Continue To Deny Climate Change? NSR (Waterloo, Ontario, Canada) -
CBDunkerson at 05:30 AM on 20 August 2011Settled Science - Humans are Raising CO2 Levels
Heh, the decreasing atmospheric oxygen level provides an amusing counter to a popular 'skeptic' argument: If increasing CO2 means more and healthier plants then clearly decreasing oxygen means fewer and sicklier humans. :] -
Nicholas Berini at 05:18 AM on 20 August 2011Climate Skeptic Fool's Gold
To add to dana's comment, hindcasting (seeing how models reflect past changes) is a way (probably the best way) to test their accuracy. It is testing the model against real data without having to wait for it to happen.... And as dana very clearly showed in this post hindcasting is not employed by Loehle and Scafetta. -
dana1981 at 04:40 AM on 20 August 2011Settled Science - Humans are Raising CO2 Levels
It just depends on your definition of "settled", and I provided my definition in the post (and comment #3). "Settled" doesn't mean "can never change", but it does mean that given what we know, it's exceptionally unlikely to change. As other commenters have noted, there would have to be something seriously wrong for our understanding of this issue to change. I call that "settled". -
Alex C at 04:37 AM on 20 August 2011Settled Science - Humans are Raising CO2 Levels
In this case it is simple not a matter of interpretation in any respect. From the accounting approach alone we know (not "are very sure," "know") that the CO2 rise must be due to humans. The fact that more is emitted by us than accumulates precludes the notion that the CO2 increase has been a natural product; this is now a matter of mathematical proof, not which evidence is stronger, or of a higher "calibre" (to use MA Rodger's term). If "skeptics" want to show that the CO2 rise is natural, they MUST address this - it's not even worth going into arguments about the number of submarine volcanoes, or the possibility that the 13C ratio change could be due to other natural forms of organic carbon, because it doesn't matter. Either the math is wrong or the observations of accumulation v. emissions are wrong. The first is simply not a point of contention, the math of course works and can only work that way given our observations; and the observations, barring some sort of revelation of horrible instrumental error, are not a point of contention either. This is a prime example of "settled science." -
Dikran Marsupial at 04:28 AM on 20 August 2011Settled Science - Humans are Raising CO2 Levels
MA Roger In the case of the anthropogenic cause of the observed rise in atmospheric CO2, the new evidence that would be required to unsettle the science would be evidence that the carbon cycle violated the principle of conservation of mass. Good luck with that to anyone looking for evidence of that nature - UFOs using CO2 for fuel is one of the more plausible avenues open to you! ;o) If this isn't settled science, one wonders what is!? [pedantry]Technically it does violate conservation of carbon, but only very slightly in that tiny amounts of C14 are constantly being created in the upper atmosphere and tiny amounts of C14 constantly decays back to N, but the amounts involved are not nearly enough to matter[/pedantry] -
MA Rodger at 03:46 AM on 20 August 2011Settled Science - Humans are Raising CO2 Levels
The idea that some piece of scientific learning can be settled or not settled is a bit simplistic. The calibre of new evidence that is required to 'unsettle' some finding becomes greater as the evidence builds. When the evidence has become overwhelming, it would still be possible for someone to present appropriate evidence of fitting calibre to re-open the finding to re-examination. The new appropriate evidence would be presented alongside the exisitng evidence (that it appears to contradict) & the reason for the contradictions examined. The problem for climate science is that there are plenty of village idiots claiming to have the necessary evidence and insistng that any contradictions (which they normally fail to specify - a very unscientific thing to omit) are the work of cheats and liars. -
muoncounter at 03:21 AM on 20 August 2011Settled Science - Humans are Raising CO2 Levels
DM#4: "a demonstrably wrong opinion!" The denier crowd ignores trifles like 'right and wrong'; the mere fact that there are "scientists who are coming forward and questioning the original idea that man-made global warming is what is causing the climate to change" gives them more fodder to chew. I'd love to hear someone respond 'show me the evidence' to Gov. Perry (who I quoted above). -
Dikran Marsupial at 02:41 AM on 20 August 2011Settled Science - Humans are Raising CO2 Levels
muoncounter It isn't just that Salby's interpretation of the temperature and CO2 data is opinion, it is a demonstrably wrong opinion! A scientific issue should be regarded as "settled" regardless of how many scientists disagree if their analyses are demonstrably incorrect! What the skeptics need is a plausible physical explanation that can be used to make a falsifiable projection. Generally they have one or the other, but not both. The mainstream scientific position has both, embodied by AOGCMs. -
dana1981 at 02:36 AM on 20 August 2011Settled Science - Humans are Raising CO2 Levels
"Show us the evidence" - I like it, muoncounter. I tried to define "settled science" in the conclusion of the post."There are some scientific issues for which the supporting evidence is so overwhelming and clear, that it's accurate to say the science is settled."
I agree, that somebody disputes a fact does not mean it's unsettled. It's the evidence that rules the day when it comes to science. -
muoncounter at 02:33 AM on 20 August 2011Settled Science - Humans are Raising CO2 Levels
Perhaps a working definition of 'settled' is in order. It is not enough to say 'its not settled' just because some disagree with the conclusion. Such disagreement is largely based on interpretation and opinion, which as we all know, can be biased (not to mention bought). Example: Salby's interpretation of temperature and CO2 data is not evidence; it is opinion. This is not about the weight of the opinions, it is about the weight of the evidence. It must be enough to say 'it is settled' when no one can demonstrate a sufficient body of contrary evidence. Speculation ('it could be a natural cycle' or 'its changed before') is not evidence. So the next time (and it will probably be very soon and on this thread) someone says 'its not settled,' why don't we respond with a Jerry Maguire-style 'Show us the evidence.' -
dorlomin at 02:00 AM on 20 August 2011Settled Science - Humans are Raising CO2 Levels
Physics is full of settled science. We need the idea of a consensus based position to determine how to launch a rocket, build a car or any number of more trivial applications. Yet there are many areas on the frontiers of physics that are not yet settled. I struggle to understand why people cannot understand this. Also there appears to be no penalty in among contrarians for getting things constantly wrong. -
dana1981 at 01:28 AM on 20 August 2011Climate Skeptic Fool's Gold
rhjames - it's too early to verify model accuracy if you only look at data starting in 1998. But I don't know why you would do that, since we have an instrumental temperature record that spans back into the 19th century, and proxy data long before that. The models are accurate. -
Tom Curtis at 01:18 AM on 20 August 2011A new SkS resource: climate skeptics and their myths
Definitely a typo. It should by "unjustifiably" as you have no doubt surmised. -
A new SkS resource: climate skeptics and their myths
Tom Curtis - In your first sentence there, did you intend "justifiably", or was that a typo? -
It's waste heat
mullumhillbilly Thought experiments and analogies both have their issues - they are fine as long as the points being discussed actually map to the system under discussion, but have a tendency for irrelevant aspects of the analogy to be taken as part of the mapped system. The core of what happens with the greenhouse effect is directly tied to conservation of energy - the amount of energy entering a system (a dynamic system like the Earth climate) must equal the amount leaving the system, or the amount of energy in the system will change. Now, you can look at the Earth as a simple, zero degree system - increases in GHG's effectively reduce the emissivity (amount of energy the Earth radiates to space at any particular temperature), which means to match incoming solar energy the Earth must warm to a higher temperature before matching that with outgoing energy. In more detail, increasing GHG's raise the level in the atmosphere where infrared radiation can emit to space - and given the lapse rate of the atmosphere, those are colder regions, meaning again less energy going to space, and an imbalance between incoming/outgoing. The Earth warms, the entire atmosphere warms, and then that level where radiation can escape is warm enough to again balance the equations. It's not a matter of "energy taking more hours to leave", it's a matter of how fast energy can leave, based upon the physical radiative characteristics of the Earth. In terms of simple analogies, I like to think of the Earth as a bucket in a waterfall. Energy comes in, overflows the edges, and goes out - increased GHG's raise the side of the bucket, the water/energy level must get higher to flow out at the rate it's coming in. (Moderators - previous comment was in error, due to my fumblefingeredly hitting the wrong button; could you delete that?) -
Joshua at 00:53 AM on 20 August 2011A new SkS resource: climate skeptics and their myths
Tim Ball? -
Composer99 at 00:19 AM on 20 August 2011How we know an ice age isn't just around the corner
Dr Doom: What does the Scotese paleo-temperature reconstruction have to do with claims that a glacial period is imminent (or has been fortuitously forestalled by CO2 emissions)? It is claims such as those that this Skeptical Science article is meant to rebut.Moderator Response: [Dikran Marsupial] I suspect Dr Doom is still promulgating the fact that according to strict geological usage we are still in an ice age at the moment (as the Earth has permanent ice caps). However it has already been pointed out to him that the colloqial use of "ice age" is appropriate for this article as it is for communication of science to the general public, who use "ice age" to mean a time of substantially greater glaciation than we see today. Dr Doom has made his point, while it is factually correct, it is not of great importance to the discussion. Thus there is no need to discuss it any further, I suggest we take Dr Doom's caveat as read and go back to the substantive scientific issues. -
Dave123 at 00:09 AM on 20 August 2011Climate Skeptic Fool's Gold
Re # 2- I agree that the statement/assertion is itself unintellible. But perhaps the idea is that the CO2 flux is being obtained by difference, rather than by an independent measurement....hence could be a cumulative measurement error. Refering to Trenberth's Energy Balance The heat retention estimate due to not reaching steady state for the level of greenhouse gases is 0.9 w/M2. Since the overall flux is ~341, this seems pretty small vs the naive expectactions of % accuracy on an energy balance this complex...and such eyeballing can lead people astray. Of course the CO2 effect on flux isn't being measured by difference...but rather by the outgoing radiation from TOA and its spectral distribution....if I've got this right. -
DSL at 23:35 PM on 19 August 2011There is no consensus
Rickoxo, if you say that the Earth has warmed and that humans have played a significant role, then you have to describe the mechanism. The only mechanism that fits those two conditions and the actual data is a large increase in atmospheric CO2. Once you understand what such an increase in atmospheric CO2 does (forces temp and ocean acidification), then you can factor in all of the feedbacks by applying the temp increase to all other climatological systems. The hard work is in figuring out the dynamic integration of these systems. Accepting those two conditions in the question is, essentially, accepting the theory of AGW--as long as you accept the established physical model (Kirchoff, S-B, etc. ad nauseum). It is clear now, after decades of warming, that there are few negative feedbacks. Most are positive, including the big ones (albedo and water vapor). It's possible that a major negative feedback awaits in the wings. Research suggests not. That wouldn't matter so much for the basic theory, though. It's warming, and we did it, and as long as we continue to do what we did and what we're doing, it will continue to produce the same physical response (worsening, of course). That's what 97% of climate scientists agree with. Indeed, if the question had been framed thusly ("Will an increase in atmospheric CO2 cause lower tropospheric warming?") then I imagine the percentage would jump to 99%. -
CBDunkerson at 23:20 PM on 19 August 2011There is no consensus
Rickoxo, it seems like you've mostly left 'consensus' behind and are now getting into questions about solar forcings (much smaller than current CO2 forcings and feedbacks), volcanoes (major eruptions cause cooling for only a couple of years), plate tectonics (can significantly impact climate, but only over timespans of millions of years), ice (the total amount and the vast majority of individual locations is in accelerating retreat worldwide, a comparative handful of locations show small increases), and so forth. My suggestion would be to read the many resources on this site which already cover all of those issues and THEN ask questions on the appropriate pages. -
CBDunkerson at 23:01 PM on 19 August 2011A new SkS resource: climate skeptics and their myths
Garethman, there is frequent discussion on this site of studies which question prevailing ideas on climate change. One recent example is the study which suggests there is a 50% chance that Arctic sea ice extent could expand over the next decade (but will certainly show a declining trend over the next 20 years). This differs from other recent findings which suggest that the ice loss is accelerating. It is thus a TRUE skeptic presentation. They describe their methodology and have published it in a peer reviewed journal for further analysis. Similarly, studies of Greenland ice mass loss have come to different conclusions which have been discussed here. See, the thing that most 'skeptics' don't seem to understand is that REAL skeptics are PART of the climate science community. There are different views of how data should be interpreted, which analysis methods yield the most accurate results, and so forth. The sort of rigorous ongoing debate with detailed research and explanation of methodologies which characterizes actual science. As opposed to, 'some guy with a blog says that photons can only travel in packs - so therefor global warming is a lie'. We discuss those too, but just to debunk them. -
rhjames at 22:36 PM on 19 August 2011Climate Skeptic Fool's Gold
I'm actually just trying to find support for the models. This thread seems to be about models, so I thought it appropriate to comment here. My point is that models, once developed, should predict future data. I'm not saying that a short term flattening means that the long term upward trend isn't correct. It seems to me that because of this flattening, it's just too early to claim model compliance, as they are still relatively new, and coincided with the flattening. I see in comment 4 that there is a thread "Models are unreliable", so it's probably best if I try to transfer to that thread to find these answers. Thanks.Moderator Response: [Dikran Marsupial] Read the Easterling and Wehner paper I mentioned in my previous comment. Both the instrumental record and model output show occasional periods of little or no warming even with increasing CO2 radiative forcing. The models do predict that this will happen, they just can't predict when it will happen, because it is a chaotic effect. -
muoncounter at 21:22 PM on 19 August 2011There is no consensus
Rickoxo#401: "Am I missing something" You've questioned whether the science is settled and seem to feel a single paper, in this case Doran, is the only thing of interest. It is not; look at any number of threads here that (taken together) reference and review thousands of published articles. Evaluate the actual evidence presented, not the surveys. If you are looking for a demonstration of consensus, go around to the websites of various professional organizations in the related sciences. Read their position statements on climate change; discount overt ringers like the one I cited for AAPG (even though they state out loud that climate change is occurring and tacitly that reducing CO2 will have an impact). But it seems that those who talk about consensus are often really talking as if that requires 100% agreement -- and the existence of one genuine skeptic out there results in another 'Ha! There's no consensus.' That's utterly incorrect: scientific consensus is never 100%. Accepting that fact, I suppose you can worry about how many dissenters it might take to 'break' the consensus. Once again, that's silly; especially when we read just how weak the case of some of these 'skeptics' turns out to be. Quoting their talking points, rather than analyzing their substance, reduces the discussion to the level of many other climate blogs and that is not what we're about. No, consensus is obtained by the weight of the evidence -- and the quality of the work done by those who assemble it. There will always be someone in the background shouting 'but it could be ___'; that does not alter the evidence in any way whatsoever. When you speak of the science is settled, its the weight of the evidence that settles it. -
SRJ at 20:33 PM on 19 August 2011Crux of a Core, Part 2 - Addressing Dr. Bob Carter
In the blog post it is stated that: "In this there is no way to infer from GISP2 alone that any rise or fall in the record is a function of global temperature changes without looking at a wider range of site records". I think the reason that people sometimes get confused and use GISP2 to represent global/large scale temperature changes - is caused by the text in the abstract that is quoted in the GISP2 data file The abstract states: "Greenland ice-core records provide an exceptionally clear picture of many aspects of abrupt climate changes, and particularly of those associated with the Younger Dryas event, as reviewed here" The only data in the file is from GISP2, one needs to read the full article to find out that the statement in the abstract is based on multiple data sets. -
Dan Olner at 20:01 PM on 19 August 2011Climate Skeptic Fool's Gold
rhjames, just to back up the moderator response (and presuming you're not just a robot), please go read Tamino's most recent. You'll find some data where the later values level off in just the way you describe. Problem: it's model-produced data: just a positive linear trend with noise. As Tamino says: "There is absolutely no doubt, none whatsoever, that the actual trend is not only upward, it’s at exactly the same rate throughout, it didn’t stop or slow down or level off. We can be quite certain, because the data were made that way." The point: even in data we know 100% has a positive trend, there will be fluctuations given noise. So: fluctuations in real data doesn't mean there isn't a trend, any more than a chilly April after a warm March means it's winter. Not rocket science. -
Paul D at 19:36 PM on 19 August 2011A new SkS resource: climate skeptics and their myths
I was also wondering if Muller should be on the list?? I am not up to date with his thinking, but aren't some of his skeptic comments been superseded recently, or is he still plying them? -
garethman at 18:45 PM on 19 August 2011A new SkS resource: climate skeptics and their myths
garethman at 08:16 AM on 19 August, 2011 CBDunkerson at 01:41 AM on 19 August, 2011 Ryan, actually we DO exercise scientific skepticism here. Really? I note you address climate change scepticism in an assertive and evidence based fashion, But to be honest I’ve never noticed any sceptical publications or ideas being flagged up here. Apologies if I miss the point. Response: [DB] "But to be honest I’ve never noticed any sceptical publications or ideas being flagged up here." Eh? You've lost me. What I mean is that if we take skeptic proposals to be something that opposes the currently accepted viewpoint on climate change, it appears that this site uses scientific evidence and methodology to debunk such claims, but I have not noticed you posting skeptic material with the comment that “this is interesting, it may be right” I know it’s not your role to do that, and in addition amongst the masses of material on this site, I may have missed it, but that essentially is my point. -
Dikran Marsupial at 18:45 PM on 19 August 2011Understanding the CO2 lag in past climate change
Dr Doom In a scientific discussion it is perfectly reasonable to point out when someone doesn't understand something. In scientific discussion if someone suggests you don't understand something, standard practice is to assume that they are right and go and check, rather than to take it as a personal insult. Scientists tend to have this sort of defensiveness knocked out of them pretty quickly by the peer-review process, which is all about poking holes in your science. As I have already pointed out, the fact that climate sensitivity is described in terms of the effect of a doubling of CO2 already takes this into account. For a logarithmic function, you get the same change in the logarithm for any doubling of x, regardless of the value of x. The sensitivity per doubling of CO2 is the same, regardless of the starting concentration. Now in practice, I suspect that the logarithmic law holds while CO2 is a trace gas, and will breakdown once it is a substantial fraction of the atmosphere. However that point is so far down the track as to be wholly irrelevant to the discussion of AGW, as scaddenp points out it will have reached toxic concentrations by then, so the greenhouse effect wouldn't be our primary concern. -
Dr. Doom at 18:31 PM on 19 August 2011Understanding the CO2 lag in past climate change
Dikran, Apology accepted and your point well taken. Please refrain from concluding “you don’t understand.” I do. Just explain your point and focus on the argument and not on me. In the logarithm function y = ln (x) where y is temp. and x is CO2. The CO2 sensitivity is the derivative dy/dx defined as the change in temp. per unit change in CO2. This approaches zero as CO2 approaches infinity. It means that temp. is becoming less and less sensitive to CO2 as CO2 increases. Let me rephrase my question: At what CO2 level will the sensitivity become close to zero or insignificant? This is of interest to me since when this CO2 level is reached, adding more CO2 will no longer increase temp. Please no ad hominen. Let’s just discuss science. Scad, thank you. It's not there. -
rhjames at 18:23 PM on 19 August 2011Climate Skeptic Fool's Gold
1998 is still the hottest year in recent times, and this year is shaping up to maintain the lack of warming. It's a bit hard to have confidence in these models when they predict warming, but Earth stubbornly refuses to cooperate. It would be nice if, after 13 years, we actually saw some real warming. Long term, the models might be right, but eventually we need some correlation with current data, if we are to believe them.Moderator Response: [Dikran Marsupial] "It hasn't warmed since 1998" is currently the 9th most popular skeptic canard. Ocassional periods of a decade or so are expected to show little or no warming (or even slight cooling), even in the presence of a long term warming trend (see Easterling and Wehner for details). This happens because natural variability (due to things like ENSO) have a larger magnitude than the expected warming trend due to CO2 radiative forcing, and so the former can temperarily mask the latter. However the variability is quasi-cyclical and so averages out to zero on climate relevant timescales (e.g. 30 years). If you want to defend your analysis, please do so on the "no warming since 1998" thread where it will be on-topic. -
Tom Curtis at 18:06 PM on 19 August 2011Where have all the people gone?
Agnostic @37, yes then all bets are of, and our goose is already cooked. For policy consideration I ignore such early trigger catastrophes, not because they are unrealistic or implausible. They are certainly a real possibility. But if they are early trigger events, then it is too late to do anything about it. As no current policy can have an impact in such scenarios, such scenarios have no relevance for current policies. -
skywatcher at 17:53 PM on 19 August 2011There is no consensus
Hi Rickoxo, thanks for your clear explanation of where you're coming from. I'll try and tackle one or two points. On ice, there's not much ice at all that is growing. The ice sheets of Greenland and Antarctica are both showing overall retreat (Greenland in particular), and the vast majority of mountain glaciers are retreating. Global sea ice area, and most especially Northern Hemisphere sea ice area, is also shrinking. See the various relevant links around the site. The only ice that shows any increase is Antarctic sea ice, and there are dynamical reasons as to why that behaves very differently to Arctic sea ice. Do you know which ice you thought was increasing, and what the source was? Future climate is all about boundaries, a little like predicting the weather next summer on a winter's day. I can't tell you that midsummer's day will be exactly 25C, or 18C or whatever, but I can say confidently that it will be considerably warmer than the 7C winter's day I'm experiencing, because the boundaries have shifted. We know that CO2 is by a large margin the strongest forcing agent in operation at present (and still increasing in strength), and so unless our emissions decrease substantially, annual temperatures by the end of the century will definitely be a lot warmer than now. We can't say with certainty if the temperature in 2100AD will be exactly 2C, 4C or 6C warmer than temperatures today, because that depends on the overall emissions between now and then. With a particular emissions scenario (say one producing 3C warming by 2100), the variability of ENSO, volcanic and solar may make 2100 individual year slightly warmer or slightly cooler than 3C (+/- up to 1C). The overall emissions act like the warming between winter, spring and summer, and the additional forcings of ENSO, volcanic and solar act like the weather on a particular summer's day. We don't need to know the exact values of ENSO, volcanic* and solar** to know that it will be warmer 90 years from now if we keep emitting prodigious amounts of CO2 into the atmosphere. *all this assumes there will be no supervolcano eruption which would have a large magnitude impact. **even a Maunder Minimum-like period of solar activity would only slow warming a little by introducing a depression of something like 0.3C to the rise in temperature. It is harder to forecast climate in five years than it is to forecast climate in 50 years, because in only 5 years, a great deal depends on the variability caused by ENSO, solar and volcanic activity. The first decade of the 21st Century is a classic example of that, as was much of the 1980s. CO2 forcing hasn't stopped in the past decade (like the progression from winter to spring), but the 'weather' of the variable elements has given us a progression from El Ninos to La Ninas alongside a progression from high to low solar activity. Like having a spell of northerly winds in April in Britain washing away the memories of the warmer weather in late March... -
scaddenp at 17:49 PM on 19 August 2011Understanding the CO2 lag in past climate change
Well there is a limit - when the atmosphere is only water vapour and CO2. Beyond my skills to calculate it however. Perhaps just consider CO2 at 10,000ppm (at the concentration it is toxic)? Dr Doom, considering your pseudonym, you may find the CO2 series at Science of Doom. Rather more detail than a blog comment will allow. -
Dikran Marsupial at 17:25 PM on 19 August 2011Understanding the CO2 lag in past climate change
Dr Doom My comment was not intended as a personal attack, but constructive advice, I appologise for not making that more apparent. Your post demonstrated a lack of understanding of the difference between equilibrium and transient climate sensitivity, until you appreciate the difference between the two, you would not be able to understand the flaw in your argument, and hence you need to do some background reading. Now your grasp of mathematics also appears to be a little shaky; the logarithm does not approach a finite value as x tends to infinity, it approaches infinity as x tends to infinity, as I pointed out here. If you don't believe me, look it up.
Prev 1562 1563 1564 1565 1566 1567 1568 1569 1570 1571 1572 1573 1574 1575 1576 1577 Next


