


 Arguments


Recent Comments
Prev 1601 1602 1603 1604 1605 1606 1607 1608 1609 1610 1611 1612 1613 1614 1615 1616 Next
Comments 80401 to 80450:
-
Camburn at 23:59 PM on 20 July 2011Sea level rise is exaggerated
Rob: Envisat, which covers a larger area of the globe, does not agree with your graph, and when one adds the current data the GMSL is unchanged since 2004. Before you accuse me of cherry picking a satallite, the reason I use Envisat is because it covers more surface area and should be a better metric of what is going on. My question once again is, how is this possible? Is Evistat not correct? If it isn't, wouldn't someone that works there know and written about it? -
Rob Painting at 23:15 PM on 20 July 2011Sea level rise is exaggerated
"Looking at tidal guages and satillites, both at this time show a reduction in sea level rise. That puts the Von Schuckmann paper in question because for them to be correct, we should be seeing a steady if not increasing rate of rise." That's not right Camburn, check out the graph I provided @ 143 Von Schuckmann & Le Traon measure an increase in ocean heat down to 1500 metres over the 2005-2010 period, along with a corresponding rise in steric sea level. It's as one would expect.
-
Camburn at 22:58 PM on 20 July 2011Sea level rise is exaggerated
scaddenp: Looking at tidal guages and satillites, both at this time show a reduction in sea level rise. That puts the Von Schuckmann paper in question because for them to be correct, we should be seeing a steady if not increasing rate of rise. We are not observing that. The amount of energy required for thermal expansion is huge to say the least. There has been no spike in energy, and it appears there has been a decrease in energy which is not being measured. There is something here that is being totally missed and I have no idea what it is. -
Paul D at 22:57 PM on 20 July 2011China, From the Inside Out
Rob said: "All my friends who are product designers have to travel to Asia 5 or 6 times a year. Your solution is that they quit their jobs and do something else." Some people quit their jobs for less! Recently in the recession I was watching some bloke saying he quit his job because he allegedly couldn't afford to drive the 50 miles to work (as a printer) any more. The idea of buying a cheaper car to run or booking into local accommodation for a few nights apparently weren't options. Even if he had to leave the job, he could have stuck it out for a year and found something else, or even moved to be nearer to the job. One company I once worked for as an engineer (product design), used to be world leaders in their field, they produced equipment for the UK market in the UK, where it was also designed. Then an American company that had no knowledge of the industry, bought it out and shifted production to China and the design to India. One engineer that I knew, still works there, he hates it and they won't allow him to retire early. Would I want to work there now? Absolutely not. Oh and BTW, I designed stuff for markets in Australia, UK and Japan. I never once left the UK and that was before the internet existed! -
Hyperactive Hydrologist at 22:13 PM on 20 July 2011China, From the Inside Out
Crazy idea but how about an inter-continental rail transport system that is in a vacuum and runs on magnetic rails. No air resistance and very little or no friction. In theory it could reach speeds of up to 20,000kph. Currently in development in China. Vacrail -
CBDunkerson at 21:10 PM on 20 July 2011Websites for Watching the Arctic Sea Ice Melt
There is an interesting new site from the U.S. Naval Research Lab here. This is intended to replace the older PIPS 2.0 system for forecasting and reporting of current conditions (or 'nowcasting' as they call it). I haven't read up enough to get a feel for the accuracy of the model yet, but the graphics are simply stunning. Watching the deformations in the ice thickness patterns via the 30 day and 12 month GIF movies is particularly impressive. They also have maps of sea surface temperature (which is great for showing how the temperature doesn't rise above freezing until the ice in an area is gone), salinity (which is great for showing how it decreases as ice melts in an area), height, and other factors. The ice concentration map has different shadings for every percentage point from 1% to 100%... which provides and interesting perspective on how quickly ice melts away entirely after it drops below about 50% concentration. That powerfully demonstrates the albedo feedback in action. All in all, a treasure trove of information on Arctic ocean conditions. -
Doug Mackie at 20:40 PM on 20 July 2011OA not OK part 6: Always take the weathering
Paul W, We are chemists also and it pains us to point out that your idea has not been thought through and is distressingly commonplace amongst chemists. Firstly, as a chemist, you are surely aware that as we noted in post 3, surface seawater is supersaturated in CaCO3. Secondly, please consider the response (repeated below) we made to a similar comment to post 3 here. The idea was explored with respect to limestone and what is true of adding calcium carbonate also applies to adding calcium silicate. Harvey L.D.D. (2008) Mitigating the atmospheric CO2 increase and ocean acidification by adding limestone powder to upwelling regions. JOURNAL OF GEOPHYSICAL RESEARCH, VOL. 113, C04028, 2008. abstract. The conclusion:Geographically optimal application of 4 billion t of CaCO3 a−1 (0.48 Gt C a−1) could induce absorption of atmospheric CO2 at a rate of 600 Mt CO2 a−1 after 50 years, 900 Mt CO2 a−1 after 100 years, and 1050 Mt CO2 a−1 after 200 years.
That is, a fleet of tankers dumping 4 billion tons of powdered limestone per year could be sucking up 600 million tons of CO2 per year after 50 years. A slight problem is that current emissions are about 30,000 million tons of CO2. Yes, current emissions are 50x the amount that would be being sequestered by 2100 – and your guess is as good as mine for what emissions will be in 2100. Every little bit helps? Perhaps. But mining, crushing and transporting the limestone might be a little carbon intensive. Harvey is not seriously proposing this as a solution. He goes through those calculations too, as he says to show that:The calculations presented here serve to illustrate the enormity of the task of even partially reversing the acidification of the oceans that is yet to occur under even the most optimistic scenarios concerning reductions in CO2 emissions. The task is not only enormous but would need to continue for several 100 years. These calculations also underline the fact that in the absence of stringent reductions in CO2 emissions, efforts to reduce adverse impacts on ocean chemistry will be ineffective.
Harvey goes on to say that if emissions have dropped to zero by 2100:then application of limestone at a rate of 4 Gt a_1 (0.48 Gt C a_1) beginning in 2020 serves to restore about 20% of the difference between the minimum pH and preindustrial pH by 2200 and restores about 40% of the difference by 2500, with the same benefits for the degree of supersaturation with respect to calcite.
Yes quite. If emissions have dropped to zero by 2100. -
Paul W at 20:20 PM on 20 July 2011OA not OK part 7: Le Chatelier not good enough for ocean acidification
Polar Bear@1 For a fuel that is added in cement making (very hot ovens are used) there is little difference between CO and CH4 because at temperatures over about 600 C methane decomposes in the presence of air to make CO and H2 which will also combust further to CO2 and H2O. The real question can be handled by insisting that the exit gasses from the oven meet pollution control standards. Trying to specify the fuel used makes little point to me given one easily turns into the other in the oven. Specifying the maximum allowed levels for many chemical species including CO, NO2, and many others is what I see as the main game. The way the cement makers are able to guarantee being below those levels is something I'd be inclined to put on them and have good quality control over. -
Paul W at 20:02 PM on 20 July 2011OA not OK part 1
Norman@11, While I agree with you that the chemistry is more complex than just those equations involved. Your article is very old. 1972. It has now been seen that at 8.00 pH aragonite forming organisms are no longer able to make their shells. Between 1751 and 1994 surface ocean pH is estimated to have decreased from approximately 8.25 to 8.14 wiki/Ocean_acidification The attitude that 0.25 pH units is small is now totally out of date. It is considered that 0.09 pH change is large for the ocean! Only half that change you speak of as small will wipe out aragonite life forms from the current state of the oceans. (except for refuges) -
Dikran Marsupial at 19:30 PM on 20 July 2011Lessons from Past Climate Predictions: William Kellogg
Nice post, which illustrates the way in which science makes progress - formulate a theory, generate testable predictions, see if predictions pan out, refine theory in light of observations, repeat until convergence (or paradigm-shift). The difference between Kellogg's prediction and (say) Easterbrook's is that it is based on physics, Kellogg knew why he expected a rise in temperatures and could quantify it, rather than put it down to cycles with a suggested cause (PDO), but without a quantifiable mechanism. As a result we can learn from Kellogg's flawed projections, but we won't learn much about climate should Easterbrook's projections proved flawed (which IMHO is very likely). -
Paul W at 18:11 PM on 20 July 2011OA not OK part 6: Always take the weathering
To extend the discussion about silicates by Patrick 027 to geo-engineering. I'm assuming that calcium and the carbon cycle are the topic here. One of the more natural methods of geo-engineering is to grind calcium silicate containing igneous rocks to a fine powder and disperse them over the oceans to help counter ocean acidification and aid in the draw down of CO2 from the air. The calcium silicate dissolves and the added calcium concentration helps maintain aragonite super-saturation and increase CO2 deposition as CaCO3 and also raises ocean pH. This is one of the two ethical methods of geo-engineering (the other being bio-char addition to farms soil) that have a lower chance of really messing up the planet. I've noticed in trying to discuss these points with environmentalist (I'm a chemist so I like discussing something I'm trained in) I find that all have so far have been convinced that geo-engineering is about sulphur burning and the sky no longer being blue. With so much emotion that geo-engineering is no longer wanted to be talked about. I've noticed that the fuel levy on petrol and diesel is higher than the cost of making bio-char from garden waist. I don't know what the cost of the grinding of igneous rocks is but I thought it worth discussing the option of pushing for liquid fuel to be offset by one of these two methods before sale. Starting to use CO2 sequestration now instead of latter makes some sense to me. Especially if it's not cost prohibitive and we have a tax that could pay for it. Oh by the way I don't think doing this for coal fired power stations is worth doing. I'd rather replace them. -
scaddenp at 15:39 PM on 20 July 2011Sea level rise is exaggerated
Given the Von Schuckmann and La Traon paper on 0-2000m, I will wait till there has been a full analysis of Argo before leaping to conclusions on that. I had been discussing the question of sealevel with local professor of surveying. He had been studying 100 year records for Australia and NZ, together with continuous GPS stations at some guages over last 15 years or so. Interesting questions. In short, there are many contributors to short term sea level change. He lacks confidence in the satellite reference frame being accurate enough for short term conclusions, preferring 50 year trends for tide gauge data and maybe 15 for satellite. I havent had time to look at the papers he has sent me yet. -
Norman at 14:46 PM on 20 July 20112010 - 2011: Earth's most extreme weather since 1816?
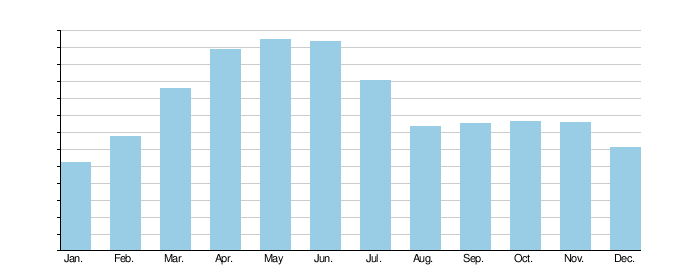
Tom Curtis, Here is some material for you to consider if you have the interest. Tornado formation along the lines Albatross posted above. "the Rocky Mountains help divert upper level winds across the Great Plains which helps set up outbreaks conditions when cold air aloft overrides the very warm moist air below" Quote from the link above. So where is this cold air aloft coming from that the Rocky Mountains are diverting? This one says exactly what I have claimed above. "Thunderstorms are convective storms. They need unstable air, a temperature profile with warm air near the ground and cold air aloft. Thunderstorms are more likely in the spring and summer than in the fall and winter. In spring and summer the sun warms the ground, which warms the air near the ground. Air near the ground is also warmed in the fall, but there is an important difference. In the spring the air aloft retains its winter cold; the air will be more unstable than in the fall when the air aloft retains its summer warmth." And then there is this one. "Where the air for Tornado Alley comes from The warm moist air, called tropical maritime air, is swept up from the Gulf of Mexico and the Caribbean Sea due to lack of mountain barriers. During the spring months the Earth begins to warm, which adds to the layer of warm moist air which is close to the ground. While this is occurring, cool dry air masses, called maritime polar, often sweep in from the north or northeast. The cool air is trapped by the Rocky Mountains and rides close to 10,000 feet above the warmer air below. Cool air over warm air is an unstable condition. The hot middle layer, coming from the west often acts as a “cap” on the low-level warm, moist air. Only the strongest areas of heating near the ground can penetrate the cap. But when they do, the bottled-up, low-level moist air feeds into the break from miles around. The shifting winds then twist theses updrafts forming supercell thunderstorms. A breaking cap, with the help of an upper level jetstream, can cause convection to grow explosively, with storms rapidly becoming severe and tornadic." Source for the above quoted material. This source claims that the cold air the Rocky Mountains deflect come from Maritime Polar air masses from the north or northeast. This writer is claiming the cold air that creates the highly unstable air comes from the poles. My point has been this. If the poles are warming faster than the tropics (about twice as fast according to IPCC studies), the polar air being the source of the cold air aloft that generates the tremendous storms and heavy rains, as the poles warm the source of cold air will be less and hence the severe storms will be less frequent overall. The counter is that the warm moist air increase will be more than enough to overcome the lack of wind shear (and my idea, cold air aloft). The tropics are expected to warm 2 C in the next 90 years. Would this warming provide so much more fuel to storms that it will overcome the other conditions that are working to lessen the storm severity? I think it would not. My empirical evidence for these claims is that the warmer wetter air of July and August are not sufficient to overcome the loss of cold air aloft to drive the severe storms that occur in the spring and early summer with air that is colder and has less moisture content than later summer air. More evidence against increases in flooding from Global warming. Missouri River. Graph of Missouri river flows. In the graph link above you can see that the Missouri river has the greatest average flow in May. June is close but it drops sharply in July and August. Months that have the warmest moistest air of the year in the United States. If the Trapp theory is correct, why are not July and August the months with the most severe storms and greatest rainfall. Obviously air with the most moisture content does not lead to an automatic increase in precipitation as some on this thread are certain would happen. Here is one for the Mississippi river. Mississipi River. Graph from above Mississippi articlel. If you look at this graph you will see that the greatest flow of the Mississippi occurs in April (melting snow and heavy rains). Look what happens in July and August. Here are some historic high Mississipi River flows: "1927 2,345,000 cfs 1973 2,261,000 cfs 1983 2,150,000 cfs 1945 2,123,000 cfs 1950 2,054,000 cfs 1979 2,005,000 cfs 1937 1,977,000 cfs 1975 1,927,000 cfs" 2011 Mississippi flood "The Flood of 2011 set new record stages at Vicksburg and Natchez and approached record levels at Greenville and Memphis.[30] Provisional estimates by the USGS indicate that the peak streamflow at Vicksburg, 2,340,000 cubic feet per second, exceeded the both the estimated peak streamflow of the Great Mississippi Flood of 1927, 2,278,000 cu ft/s (64,500 m3/s), and the measured peak streamflow of the 1937 flood, 2,080,000 cu ft/s (59,000 m3" Yes 2011 was the worst flood in 100 years but it is not exceptional or extreme compared to the other flood events of the past. -
Norman at 14:09 PM on 20 July 20112010 - 2011: Earth's most extreme weather since 1816?
Tom Curtis and Eric the Red, This thread is about extreme weather. Statistically a 7 sigma standard deviation is extremely rare. From this earlier link on tornado count... Tornado count. I typed in all the data on an excel sheet to check on trends and averages. As I was entering the data I noticed the number 212 tornadoes in January 1999. It was so much above the numbers I had been enetering I decided to check out the standard deviation for this freak occurence. Using this calculator: Standard Deviation calculator. The average number of tornadoes in January from the data set was 18.31. The standard deviation ws 29.65. The 212 tornadoes in January 1999 would be 7 standard deviations from the average (sigma 7). This is a very rare occurence indeed. "σ Percentage within CI Percentage outside CI Fraction outside CI 0.674σ 50% 50% 1 / 2 1σ 68.2689492% 31.7310508% 1 / 3.1514872 1.645σ 90% 10% 1 / 10 1.960σ 95% 5% 1 / 20 2σ 95.4499736% 4.5500264% 1 / 21.977895 2.576σ 99% 1% 1 / 100 3σ 99.7300204% 0.2699796% 1 / 370.398 3.2906σ 99.9% 0.1% 1 / 1000 4σ 99.993666% 0.006334% 1 / 15,787 5σ 99.9999426697% 0.0000573303% 1 / 1,744,278 6σ 99.9999998027% 0.0000001973% 1 / 506,800,000 7σ 99.9999999997440% 0.0000000002560% 1 / 390,700,000,000" The point of this is that the nature of weather, a chaotic beast, does have these very unusual events. I am not sure linking a dozen or so extreme events in a year demonstrates that Global warming is destablaizing the climate in a bad way. What I am wondering is that if I look at other data about the weather or a long series of years I will continue to find these very extreme events popping up. Just a characteristic of weather and nothing more. -
Philip Shehan at 14:01 PM on 20 July 2011Examples of Monckton contradicting his scientific sources
Andrews Bolt's website is awash with "skeptics" heaping praise on His Lordship's performance. -
Bob Lacatena at 13:42 PM on 20 July 20112nd law of thermodynamics contradicts greenhouse theory
1079, muoncounter,'global warming is people'
That was one of the greatest moments in cinematic history, when Charlton Heston said that line in Soylent Warm. That, and when the little kid in Sixth Sense said:I see warming people.
-
John Cook at 13:39 PM on 20 July 2011Examples of Monckton contradicting his scientific sources
Yes, I watched the debate (and tweeted a few thoughts during - they're still in the right margin tweets as we speak) -
actually thoughtful at 13:07 PM on 20 July 2011China, From the Inside Out
{I just flipped to the 2nd page of comments and see others have suggested my idea - so let me just add my voice to the chorus calling for a post addressing the future of aviation). Hmmm. First of all - GREAT article - thank you! I too was taken aback by your advice to fly to China, and your close even more so (the critical time is already in the past). 3 tons per person is a LOT of CO2! My large solar thermal systems (15 large panel, whole house heating in a winter climate) save 6 tons per YEAR. So I have to work two weeks to create as much CO2 savings as one person consumes on one transcontinental flight. Perhaps a different perspective (note the work I do is the fastest way to avoid CO2 (making hot water from the sun)). On the other hand - flight is currently a small portion of the puzzle, and, in my mind, so long as someone is making yearly progress towards a zero carbon footprint, it is OK to defer flight to later in the process. But we can't defer everything until the end. I do think auto travel and building conditioning are the low hanging fruit. Rob if agree with any of what I am saying - I suggest as your "penance" (tongue now firmly in cheek) that you write an SkS post about future flight solutions- you have alluded to this a couple of times, and there does seem to be some interest (based on this thread alone...) Regardless, thank you so much for the first hand report on China - fascinating, heartening and scary all at once. -
Composer99 at 13:00 PM on 20 July 20112nd law of thermodynamics contradicts greenhouse theory
Tom Curtis, you have the patience and forbearance of... well, of someone with an exemplary amount of patience and forbearance. Or a saint. Take your pick. The explanations which invariably follow the appearance of a new contrarian on this thread have been very enlightening for this layman.
I recently came across a similar discussion on how the 2nd Law of Thermodymanics is mis-used in a similar fashion by creationists to argue against evolutionary biology. You may find this comment (author's tongue firmly in cheek, I dare say) to be an amusing take on contrarian argumentation, if adapted for the climate debate. -
Tom Dayton at 12:21 PM on 20 July 2011Climate's changed before
But kropotkin, consensus has been reached, and the predictions to date have proven accurate. -
kropotkin at 12:00 PM on 20 July 2011Climate's changed before
I come to this debate as a philosopher and science layman. The thing that strikes me is that we have descended into a debate about the truth of facts. Without absolute verification possible in some instances of these facts we can only posit, as all good science eventually does, the most probable circumstance. If this depends on a consensus of scientific opinion, then authority rests with those with sufficient knowledge to debate what is the most probable scenario. In other words, whatever the layman thinks, the expert is the only one with real knowledge. But then another problem arises, endemic to this particular debate. We are talking about scientific theories about systems, not individual facts. The truth of this debate hinges on probabilities about complex totalities, and no consensus can be reached on such contentious grounds. If authority cannot be given to cognoscenti when the very object is too complex to predict or prejudge, then the argument must rest on faith. That is why this issue has sparked so much division and opinion-mongering. In which case, I side with Pascal and his wager. Not knowing the real truth, the total picture with absolute certainty, and having to rest content with mere probabilities about complex systems, it is better to err on the side of caution. If the worst case scenario is no habitable planet then we should opt for a sustainable future. -
quokka at 11:14 AM on 20 July 2011China, From the Inside Out
IMHO one thing that does characterize China is a leadership that looks further ahead than most. Nuclear power is a good example. While building significant numbers of light water reactors, they are also undertaking multiple lines of research into advanced nuclear power including the construction of a 200MWe high temperature pebble bed reactor, have an operational research sodium cooled fast spectrum reactor apparently largely based in the US Argonne Labs IFR and have recently announced a serious program for the development of molten salt reactors. It seems they are also buying a pair of BN-800 fast reactors from Russia which I guess is to obtain operational experience with fast reactors in a production environment. With this spread of technologies they are covering what are arguably the most important advanced fission technologies. Compare to the US which seems intent on remaining in a time warp of reactors fundamentally based on engineering developed for propelling submarines. -
Tom Curtis at 10:23 AM on 20 July 20112nd law of thermodynamics contradicts greenhouse theory
Rosco @1077: 1) Rather than ignoring the transfer of energy by collisions (conduction) modern green house theory absolutely depends on it. If it were not for that transfer, the equipartition theorem would be false, and energy could not transfer from oxygen or nitrogen to carbon dioxide, and in particular to those rotational modes of CO2 that spontaneously release their energy by emitting infrared radiation. In other words, without the transfer of energy by collisions the greenhouse effect could not work. The effects of energy transfer by collision are built into green house theory by its use of the ideal theory of gases, by its use of statistical dynamics, and by its use of quantum mechanics as it relates to molecular absorption and emission. 2) Transfer of energy by convection is essential to understanding the modern theory of the green house effect. In this case it is not essential to the effect itself, in that in principle you could have a green house effect without it. But in practice understanding the greenhouse effect cannot be divorced from understanding convection. That is because convection absolutely dominates vertical transfer of energy in the troposphere. Because of this domination, the change of temperature with altitude approximates the adiabatic lapse rate. As a result, any change in equilibrium temperature in the upper troposphere must be matched by an equivalent change at the surface. The equilibrium temperature is set by the fact that much of Earth's Outgoing Longwave Radiation comes from the mid and upper tropospheres, and that the total of the outgoing radiation from all sources must equal the total incoming radiation from the sun if the Earth's temperature is to remain constant. If CO2 levels increase, the result is that outgoing atmospheric radiation comes from slightly higher in the atmosphere. Because the vertical temperature structure of the atmosphere is set by convection, that means it comes from a slightly cooler location. As illustrated below, the result is that both the temperature at that higher altitude, and, because the vertical temperature structure is set by convection, the temperature at the surface must increase until equilibrium is reached again: Chris Colose, whose diagram I have used, provides a more detailed explanation.
3) So far we have seen that you do not understand the atmospheric greenhouse effect unless you understand the essential roles energy transfer by collision and by convection play in it. Of course, energy transfer by radiation also plays an essential role, because only by radiation can energy cross vacuums. Consequently (for practical purposes) all energy transfer from the Sun to the Earth, and all energy transfer from Earth to space is by radiation. Convection cannot vent radiation to space nor bring energy from the sun, no matter how many bad science fiction movies you have seen. As it happens the majority of energy transfer from the surface to the atmosphere is also by radiation, but that is largely irrelevant to the theory.
So, our "ridiculous insistence" that only a miniscule proportion of the atmosphere accounts for nearly all radiation of energy from the atmosphere to space is based on a detailed knowledge of the physics of radiation, and on thousands of experiments mostly by the US Department of Defence undertaken with complete disregard of greenhouse theory. The DoD didn't care about global warming in the 1950's and 60's (when most of the experiments were conducted). They cared very much about which atmospheric gases absorbed IR radiation, and which didn't so that their IR heat seeking missiles, and their Forward Looking Infra Red could be effective.
And our acceptance of the atmospheric green house theory is based on a sound understanding of all forms of energy transfer in the atmosphere.
Chris Colose, whose diagram I have used, provides a more detailed explanation.
3) So far we have seen that you do not understand the atmospheric greenhouse effect unless you understand the essential roles energy transfer by collision and by convection play in it. Of course, energy transfer by radiation also plays an essential role, because only by radiation can energy cross vacuums. Consequently (for practical purposes) all energy transfer from the Sun to the Earth, and all energy transfer from Earth to space is by radiation. Convection cannot vent radiation to space nor bring energy from the sun, no matter how many bad science fiction movies you have seen. As it happens the majority of energy transfer from the surface to the atmosphere is also by radiation, but that is largely irrelevant to the theory.
So, our "ridiculous insistence" that only a miniscule proportion of the atmosphere accounts for nearly all radiation of energy from the atmosphere to space is based on a detailed knowledge of the physics of radiation, and on thousands of experiments mostly by the US Department of Defence undertaken with complete disregard of greenhouse theory. The DoD didn't care about global warming in the 1950's and 60's (when most of the experiments were conducted). They cared very much about which atmospheric gases absorbed IR radiation, and which didn't so that their IR heat seeking missiles, and their Forward Looking Infra Red could be effective.
And our acceptance of the atmospheric green house theory is based on a sound understanding of all forms of energy transfer in the atmosphere.
-
Camburn at 10:08 AM on 20 July 2011Sea level rise is exaggerated
scaddenp: Nice that your brought up short term variability. The amount of thermal energy in the top 700 meters of the oceans dwarfs all the thermal energy of the atomosphere. At this time, the atmosphere has shrunk br approx 150 miles, which is a huge amount. My point is tho, that for the ocean to have even a minor change overall in temperature requires either recieving a lot of energy or expending a lot of energy. It is almost ocmical to see the step change in OHC graphs. The amount of energy required to either heat or cool the oceans that fast in that short of a time frame has not been observed. And it most certainly would have been observed. -
mothincarnate at 10:06 AM on 20 July 2011China, From the Inside Out
Rob, Re:#59 - this is exactly what I was on about and again, it's a trap entirely off topic to the actual article. I honestly think a bunch of these character just have nothing better to do than find things to complain about... Glad there's more joy in my own life so as I don't need to force conversations onto topics so as I can feed my own negativity. Certainly all ghg emissions should be addressed and how we can improve our activities to reduce those emissions should be the target. But demonising someone for enjoying travel is absurd... -
mothincarnate at 10:01 AM on 20 July 2011China, From the Inside Out
Rob, You're right - their agricultural needs are impressive, but more so is their ability to grow. We in Australia are lucky to grow a few ton of wheat per acre per year, yet in the NE of China, they pull in more than of wheat plus a maze crop in the one year! They're got great land there (especially compared to our ancient Aussie soils) but water to the region will increasingly become a problem. As you say - they are aggressive in meeting their needs! Some of their infrastructure is mind-boggling. I think there is little doubt that they will be a major player in 21st century global policy discussions. One only hopes their financial bubble too doesn't pop (they are building up a storm at the moment - here's hoping there is a market for it). To those who may have also replied to my previous comment to complain about my statement - sorry, I won't be reading nor replying to your comments. I've got better things to do with my time and feed the trolls, cheers. -
muoncounter at 09:34 AM on 20 July 20112nd law of thermodynamics contradicts greenhouse theory
Rosco #1077: "Is anyone really saying Oxygen and Nitrogen don't become heated AND they DON'T emit infra red radiation ?" Seems like you ought to go back several hundred comments in this thread or do some research on the vibrational modes of various gas molecules. "If radiation was such a dominant thermal transfer mechanism" Guess that bright light that appears in the eastern sky every morning doesn't use the dominant thermal mechanism? "I, and everyone else, also radiate infra-red radiation and there are many more of us now than 40 years ago" Maybe you ought to run some numbers on that; there are some great journals out there that might publish your 'global warming is people' theory. And I second Tom Dayton's final words. -
Byron Smith at 09:18 AM on 20 July 2011The Critical Decade - Part 3: Implications for Emissions Reductions
@#3 - There is enough capacity in coal alone to send us well over the budget. While I'm actually a fan of your suggestion, it would need to be complemented by some very strict controls on how much coal we could exploit. Oil and gas are ultimately more useful than coal, so it would be best to leave the vast majority of the remaining coal and non-conventionals (which often have lower EROEI anyway) in the ground while still being able to use quite a lot of oil and gas. @#8 - Yes, getting the costs of renewables below those of coal is a crucial goal, which can be helped with a decent price on carbon (as well as other means) that reflects something of the true costs associated with burning fossil fuels. -
Polar Bear at 09:02 AM on 20 July 2011OA not OK part 7: Le Chatelier not good enough for ocean acidification
Probably off topic but our Dept of Environmental quality meets tomorrow(Oklaoma) .A cement plant want to burn hazardrous material..They will be adding tons of co Carbon monoxide to the air.woul it be better if they used Natural gas..the only other option..So what does co do in all this ??stability/ Just asking thanks so much Jean -
Rob Honeycutt at 08:08 AM on 20 July 2011Examples of Monckton contradicting his scientific sources
Did anyone watch the Monckton-Denniss debate yesterday? -
Tom Dayton at 07:35 AM on 20 July 20112nd law of thermodynamics contradicts greenhouse theory
Rosco, a greenhouse gas is one that impedes the transfer of energy from the Earth to outer space. Convection cannot transfer energy from the Earth to outer space, because there are (effectively) no molecules in outer space for the Earth's atmospheric molecules to bump into. Radiation is the only method. By the way, your attitude could use improvement. -
Rosco at 07:29 AM on 20 July 20112nd law of thermodynamics contradicts greenhouse theory
Is anyone really saying Oxygen and Nitrogen don't become heated AND they DON'T emit infra red radiation ? If they do then they too are "greenhouse Gases". If they don't then they defy every law of physics and all our science must be completely wrong. Before you start showing me radiation absorbtion spectra charts to prove O2 and N2 don't absorb thermal radiation energy simply let me point out radiation is a very inefficient method of transferring thermal energy. Conduction is also poor but way more important on earth than radiation whilst convection is by far the most efficient and important. And you guys ignore both of these. If you don't believe it why is it that the old fashioned electric bar heaters have been replaced by fan dispersal models which heat spaces much more efficiently ? Similarly fan forced ovens. We don't rely on radiation to keep our car motors cool. A simple experiment should prove it and you don't even need to perform it - I recommend you don't - just think about it. If you put your hand near - not above - some heating element like a bar radiative heater you'll feel the radiative heat sure but you will probably be able to keep your hand near it for a long time. But would you touch the bar ? No, of course not - the heat transfer to your hand would be orders of magnitude greater than what is radiated. If radiation was such a dominant thermal transfer mechanism no child would ever scald or burn themselves on a hot stove because the radiative energy would be a clear warning - it isn't and they burn themselves - hopefully not too badly and only once. So the earth and oceans warmed by the sun heat up the whole atmosphere by conduction, the warmed air convects all over the globe moving thermal energy to the poles from the equator. The whole atmosphere radiates infra red radiation but this is only a small part of the thermal transfer mechanism. I, and everyone else, also radiate infra-red radiation and there are many more of us now than 40 years ago - perhaps that's the explanation of the temperature anomaly. This ridiculous insistence that only a miniscule proportion of the atmosphere can absorb thermal energy and radiate infra-red radiation is absolute nonsense and deserves to die and be buried. -
RickG at 06:53 AM on 20 July 2011Examples of Monckton contradicting his scientific sources
If only Monckton's nose would grow when ever he makes one of those contradictory citations. -
Rob Honeycutt at 06:40 AM on 20 July 2011China, From the Inside Out
Byron... I think you're right. It is a topic that is sorely missing from the SkS site. It is a very important issue with regards to climate change. It just wasn't the intended topic of this article. -
Paul Magnus at 06:36 AM on 20 July 2011China, From the Inside Out
Byron makes a good suggestion. A thread addressing flying and other high ghg emissions activities would be useful. This especially in the context of the fact that we only each have less on average than 2t per annum. Also given this, how do we eventually get back to 350ppm? A final note on the flying issue. I have been harping on to my friends, families and colleagues about GW for awhile. But it was not until I decided to drastically reduce my footprint, specifically to stop all non-essential flying, eg holidays did many start thinking about the topic more seriously. Reducing your footprint is not only hugely satisfying personally, but it has big leverage in highlighting the GW problem to many who consider it a background or minor issue. -
Byron Smith at 06:15 AM on 20 July 2011China, From the Inside Out
(OK, I can't help myself. Two brief observations. (a) As far as I am aware, all the calculations of GHG emissions in the above discussion do not take into account the total effects of flying on radiative forcing, which is considerably higher than the GHG emissions alone due to water vapour, contrails, NOx, etc.. See pp. 54-55 of the UK govt's official recommendations here, where it is suggested that a multiplier of 1.9 ought to be used while a more specific figure is being researched. (b) If we are not finding ways to imagine a world where the global average carbon footprint is at or below 1.5t CO2e per annum, then we are imagining a world heading well beyond 2ºC and all that that entails.) -
Byron Smith at 06:01 AM on 20 July 2011China, From the Inside Out
I suggest that a thread addressing the place of flying and aviation in the context of a full-orbed response to climate change may be a very useful addition to the site as it is a hot topic that really cuts to the bone of a lot of the debate about carbon mitigation. I won't say more here (and so contribute to the derailing of this very interesting post onto another very interesting topic). Thank you to Rob Honeycutt for posting it and thank you to Pierre-Emmanuel Neurohr for raising an extremely important issue, which really ought to be addressed in a focussed way. -
arch stanton at 05:36 AM on 20 July 2011Examples of Monckton contradicting his scientific sources
Thank you for your research into these claims John. Nice post. -
Composer99 at 05:02 AM on 20 July 2011China, From the Inside Out
I don't perceive Rob Honeycutt as having substantially altered his position based on the two quotes you provided, Pierre. Also, for all your politeness, I do not perceive picking up on a minor point of an article and turning it into the primary driver of the comment thread as a civil criticism (also, on the matter of 'informed' - what is your source for your numbers?). It strikes me instead to be a form of concern trolling. Especially since, as posters upthread have noted, the chief problem with air travel currently (the use of fossil fuels for aviation-grade fuel) is a technical problem with an eminently achievable technical solution (biofuels). Let us be honest here: the vast majority of people already living in affluent polities are not prepared to substantially modify their behaviours on account of the exhortations of Pierre-Emmanuel Neurohr, Composer99, Rob Honeycutt, or any other participant on this thread. And who are we to tell them so? The vast majority of people in the world, who aspire to live in increased affluence (whether through emigration to affluent polities or domestic socioeconomic development), are not going to accept being forced to remain in poverty while the affluent continue to enjoy living in wealth. And why should they? As others have already noted, setting up an adequate carbon price structure will do far more than all the exhortations we can muster to change people's behaviours to be more in line with the requirement of reducing (and eventually eliminating) CO2 emissions. -
Rob Honeycutt at 04:49 AM on 20 July 2011China, From the Inside Out
Pierre @ 52... I respect your opinion but you have completely ignored everything I've stated in the article except for 10 words. That is derailing any productive conversation regarding the observations of the article regarding China and how the lives of Chinese people impact upon the climate change issue. As well, I think you're misinterpreting my second statement that you've quoted. I'm saying, telling people they are bad for flying in an airplane does not help. You accomplish nothing with that. In fact, you are more likely to alienate people against the cause of addressing climate change. The logic that every single person should have a carbon footprint of 1.5t/yr ignores both the realities of people's lives and ignores real solutions to achieve real reductions in carbon emissions. All my friends who are product designers have to travel to Asia 5 or 6 times a year. Your solution is that they quit their jobs and do something else. Your solution says they have to completely give up their livelihoods, go back to school and learn a new skill. In the meantime, the companies these friends work for just hire new people to do those jobs. Net zero change in carbon emissions. And yet these conscientious friends all give up their incomes, potentially lose their homes, significantly lower their standard of living... for zero impact. That's not a solution. On the other hand, if we all work to get carbon priced in the marketplace that can have a very significant impact on their lives. The cost of importing products would go up. The economics of offshoring product tips toward domestic manufacturing. Then my designer friends don't have to fly to Asia. They keep their jobs. They keep their livelihoods and their homes. They get to apply their chosen skills in their chosen industry. This all while more investment becomes available to create more and better solutions for clean energy. That is a solution. -
Paul Magnus at 04:05 AM on 20 July 2011China, From the Inside Out
Heres a nice ditty on china and their solar roof heating in the as always must hear/see Climate Show.... http://www.youtube.com/watch?v=4SJvHakMbvw&feature=player_detailpage#t=4391s -
Pierre-Emmanuel Neurohr at 04:02 AM on 20 July 2011China, From the Inside Out
Honeycutt, 19 July: "I highly recommend to anyone who has the opportunity" to "travel to China on holiday or for business". Honeycutt, 20 July: "Telling people they are bad for flying does "zero." In fact, it likely makes things worse (...)". I guess this discussion was not totally unproductive. We went from an incentive to using a machine that adds -in a matter of hours- huge amounts of CO2 pollution to a citizen's yearly emissions... to a half-recognition that it might be a problem. This is my last comment on this article. I find it unfortunate that a civil and informed (including on the numbers...) criticism should have been treated as "trolling" and "hijaking". Polite criticism is healthy. -
Bob Lacatena at 03:48 AM on 20 July 2011China, From the Inside Out
If I may, Pierre, I certainly see your point, but I also need to caution against fueling the image that those of us that understand the gravity of climate change would like society to revert to some sort of Amish, pre-technology agrarian state where we commune with nature and eschew all modern conveniences. The fact is that modern air travel, and the ability of so many people to visit wonderful places, is what I consider to be one of the true gems of modern technological society. So much that we have and use is really not worth the cost, from the behemoth SUVs that Americans adore to their overlarge and inefficient living spaces to their need for round the clock climate control. I don't know which of these items must, in time, fall by the wayside, but the problem is much larger than simply cutting everything... even the worst offenses. If people changed their habits so that everyone did not try to commute to and from work during the exact same hour of the day... If American cars shrunk dramatically... If fuel vehicle efficiency improved... If manufacturing were kept to what is reasonable and useful, rather than the frivolous and extraneous and as much of it as can humanly be produced... If local goods were more attractive, because long-distance transport is more expensive... If renewable fuel sources begin to carry the size of the burden that they could and should... If companies made better use of communications technology, instead of shipping their employees all over the globe at a huge cost in carbon and human time... If, if, if... there are lots of ways to skin this cat, and I believe that if we do it right, we can leave air travel in there and continue to enjoy the great, 21st century luxury of being able to explore and see the world. So I get what you're saying, but I don't agree with your position. Travel is and should be important to people, and there is room in there to leave it be. At the same time, asking people to forgo such travel when the other, bigger things aren't yet being done is not only draconian, but it is going to alienate the very people that are sitting on the fence, and looking for any reason they can to ignore climate change. If you don't want to use air travel, don't. If you want to raise awareness about the cost in carbon, do. But I don't think a hardline, all-or-nothing position on the issue is wise, or necessary. -
Rob Honeycutt at 02:40 AM on 20 July 2011China, From the Inside Out
HH @ 47... Exactly. Telling people they are bad for flying does "zero." In fact, it likely makes things worse by alienating people. No one is going to reduce their flying because Pierre says to. But pricing carbon into the market will absolutely affect people's behavior and will absolutely generate money required to bring solutions to market. Telling people they, instead, should vote for cap and trade... if you want to have a real impact on the future of the planet, turn that into a movement. The BIG challenges we face are political. -
Rob Honeycutt at 02:31 AM on 20 July 2011China, From the Inside Out
Pierre... I've written a 1600 word article here. You are focussed on 10 words.Moderator Response: [Dikran Marsupial] added a "word" -
Pierre-Emmanuel Neurohr at 02:17 AM on 20 July 2011China, From the Inside Out
Mr Honeycutt, as a human being equipped with a brain and a sense of irony, I'm real sorry but: it is ironic for someone who reports on the climate to "highly recommend" the use of a machine that's higly polluting for the said climate. As a French citizen, I would add to my yearly 5 tons of CO2 no less than 3 tons of CO2 in a matter of hours if I was to follow your advice. If you cannot see the problem, if you do not want to hear the different reports of aviation being one of the fastest-growing global sources of GHGs, please continue to highly recommend the use of planes to China. Personnal attacks re. "trolling" or "hijacking" are simply diversions that do not honor you. -
Hyperactive Hydrologist at 02:13 AM on 20 July 2011China, From the Inside Out
Perhaps if aviation fuel was taxed at the same rate as petrol it would encourage people to fly less. Use the extra tax to subsidise cleaner forms of transport. -
Rob Honeycutt at 02:11 AM on 20 July 2011China, From the Inside Out
Kevin C @ 36... That is exactly my point. I think the biggest mistake the human race could ever make is to stop going out to experience other cultures. I think it's one of the big challenges for Americans because, on the whole, most Americans don't get out much. There is a kind of isolationist mentality here. That breeds xenophobia. The challenge there is, how to retain that ability for people to travel and visit far off lands and experience their cultures, and keep carbon emissions to a minimum. Technologically this is not one of the biggest challenges we face relative to carbon emissions. The biggest challenges are political. In order to solve real problems we need to have a serious cap and trade platform. This is exactly where Pierre irks me. He is claiming that me suggesting that people ride in an airplane that I'm not being serious about what is required to address climate change issues. I think reality is quite the opposite. Telling people they are bad only serves to push them off the other side of the fence. He's making enemies, not allies. The most effective path to getting to where we want to be is to be vocal about pricing carbon emissions. Get to the polls and vote. Make flyers saying that pricing carbon will drive innovation, jobs and the economy. Don't make flyers telling people they're bad for flying. Tell them they're good for voting. THAT is how you make a real difference. -
Eric the Red at 02:07 AM on 20 July 20112010 - 2011: Earth's most extreme weather since 1816?
Tom, We agree on the problems associated with the tornado data, on both strongest and total. I see now that it was a simple typing error, so forgive me if my comment seemed overly harsh. -
Rob Honeycutt at 01:55 AM on 20 July 2011China, From the Inside Out
quokka... re: per capita emissions rising in China. That makes sense due to the fact that still nearly a billion Chinese live an agrarian lifestyle with exceptionally low carbon emissions. More and more Chinese are entering the new economy in China. In fact, the plan in China for that entire region from Zhuhai to Guangzhou to Shenzhen it to be turned into the world's largest mega-city, anticipated to have a total population of 42 million people. While those per capita numbers are currently rising I would anticipate they will peak and fall off again as the Chinese build out their energy infrastructure. Today (like us) very little of their energy comes from clean sources but they are rapidly (much faster than us) building out that infrastructure.
Prev 1601 1602 1603 1604 1605 1606 1607 1608 1609 1610 1611 1612 1613 1614 1615 1616 Next


