


 Arguments


Recent Comments
Prev 1602 1603 1604 1605 1606 1607 1608 1609 1610 1611 1612 1613 1614 1615 1616 1617 Next
Comments 80451 to 80500:
-
R. Gates at 15:41 PM on 15 July 2011Why Wasn't The Hottest Decade Hotter?
This study certainly offers a plausible scenario for the slowing of the rise in global temperatures. An important measurement will be the average temperatures of the decade from 2010-2019. There could be a real mixed bag here. Fro example: How much will the sulfate aerosol emission from China have slowed in the decade? What if we enter into a Dalton or Maunder type minimum with the sun? What if we have a series of La Nina years continuing through the decade? Given this potential "triple whammy" of cooling forces, if somehow 2010-2019 is even hotter as a decade than 2000-2009, this will certainly be quite telling, or even if temperature simply level for the period. If you listen to the AGW skeptics, they are preparing for a Little Ice Age to begin any day now and to last for decades. I think they'll be disappointed, but, considering what it means for continued warming, you almost wish they would be right. -
Ari Jokimäki at 15:39 PM on 15 July 2011Thinning on top and bulging at the waist: symptoms of an ailing planet
About two months ago, a paper by Roy & Peltier was published. Their results are very well in line with this new study: "Recent trends in the two primary anomalies in the rotational state of the planet are analyzed in detail, namely those associated with the speed and direction of polar wander and with the non-tidal acceleration of the rate of axial rotation (via the measurement of the changing oblateness of the Earth's shape). It is demonstrated that a significant change in the secular trends in both of these independent parameters became evident subsequent to approximately 1992." -
barry1487 at 15:31 PM on 15 July 2011Why Wasn't The Hottest Decade Hotter?
It is interesting, but that was not my point. I don't think what we explore here should be constrained by the skeptic narrative, but the main thrust of this blog is rebutting skeptical views.Explaining climate change science & rebutting global warming misinformation
(Headline on the home page here) All I'm suggesting is a small change to accommodate skeptical readers, and which in any case would be consistent with the science. The point of your post is that the globe has not warmed as we had expected, and we've come up with a new analysis to answer that. We've changed our narrative and we need to be careful in expressing it properly. -
guinganbresil at 15:01 PM on 15 July 2011Trenberth on Tracking Earth’s energy: A key to climate variability and change
Ken Lambert #31:"The CERES satellite data quoted in the Aug09 paper for 2000-05 were adjusted to an estimated imbalance of 0.9W/sq.m from an absolute value of about +6.4W/sq.m. The latest data shown in Fig 3 above shows an Rt value varying around the 1.0W/sq.m. How is this data 'adjusted' from the absolute value?"
It looks to me like the CERES product "EBAF" provides only clear-sky fluxes for all regions... Figure 3 should not be interpreted to represent actual net radiation - It doesn't include the effects of clouds... -
Rob Honeycutt at 15:01 PM on 15 July 2011Monckton at odds with the very scientists he cites
Camburn @ 12... No, I think Dr Abraham has stated this correctly. There are regions that show warming during the Medieval times, but that warming occurred in different regions and at different times. And some places, like the Tibetan Plateau saw no MWP period at all. You might double check the Vostok ice core for a MWP. I don't see it there. Byrd core? Nope. Not there either. Miller 2010 states that the planet has been on a slow cooling trend globally over the past 6000 years force by a changing tilt in the planet's axis. We have likely warmed the planet to about equal with the Holocene Optimum, which is a reversal of the natural trend. What is unprecedented is that we have reversed this natural global cooling trend over the course of about 1% of the time span of the Holocene. -
scaddenp at 14:46 PM on 15 July 2011Monckton at odds with the very scientists he cites
Hmm, worth noting the AR4 comments on HCO. I'd say there was evidence it was warmer then. I don't know the global picture well, but certainly local evidence of higher sea level in NZ and Australia earlier and also evidence of glacial retreat further back in HCO than now. Timing of the HCO particularly hemispherically may be more problematic, but the sealevel proxy is worth noting.Response:[DB] Thanks for weighing in. I was referring to Hansen & Sato 2011, which contend current temperatures have equalled those of the HCO. From P. 19:
"Augmentation of peak Holocene temperature by even 1°C would be sufficient to trigger powerful amplifying polar feedbacks, leading to a planet at least as warm as in the Eemian and Holsteinian periods, making ice sheet disintegration and large sea level rise inevitable.
Empirical evidence supporting these assertions abounds. Global temperature increased 0.5°C in the past three decades (Hansen et al., 2010) to a level comparable to the prior Holocene maximum, or a few tenths of a degree higher."
The biggest issue by far with Camburn's Tale is the implied because-it-was-warm-before-therefore-this-current-warming-is-nothing-to-be-worried-about. Of course, that approach only makes sense if one knows little about climate science other than what one has been spoon-fed on denialist blogs. The underlying physical processes responsible for the previous warmings brought up as a diversionary tactic (the MWP, the RWP and the HCO) are pretty well understood to be different than that faced by mankind today (anthropogenically-sourced CO2).
Hence my refering to Camburn "prosecuting a narrative".
-
Camburn at 14:21 PM on 15 July 2011Monckton at odds with the very scientists he cites
DB: I have to get to sleep. Time permitting, tomorrow I will post links for the RWP.Response:[DB] Then post them here: Ljungqvist broke the hockey stick
The RWP is off-topic on this thread.
Sleep well.
-
TJ Brookes at 14:15 PM on 15 July 2011Great Barrier Reef Part 3: Acidification, Warming, and Past Coral Survival
Maybe somebody needs to drop this report on Julia Gillard and Tony Abbotts desks and ask is this what you are aiming for..... I am in constant outrage at the lack of leadership... -
Camburn at 14:05 PM on 15 July 2011Monckton at odds with the very scientists he cites
Ok....I thought this was common knowledge: Warmer in China during the Holocene Optimum China warmer during Holocene Optimum Alley 2000 Greenland Ice core data confirms warmth. North Greenland beaches ice free during the Holocene Optimum. Greenland North Beach ice free during holocene optimum Data from Antarctica showing the early Holocene Optimum in the ice cores: Antarctic Ice cores showing Holocene historical temperaturesResponse:[DB] It is common knowledge:
- The Alley core data dates to no more recently than 1905. Recent temperatures at the drill site are unprecedented.
- The Vostok core data (and the other Antarctica core data) use 1950 as present.
- The China Holocene paper looks to verify the existence of the Holocene optimum via pollen data, nothing more.
You are throwing "stuff" at walls in the hope that some may stick (you grasp at straws). Regardless, this amorphous discussion serves no purpose on this thread. If you wish to prosecute this narrative further, do it here:
Grasp away there.
-
scaddenp at 14:04 PM on 15 July 2011It's Pacific Decadal Oscillation
Fair enough about index - the "SO" about ENSO was an index and there is the MEI for expressing ENSO strength. However, ENSO is now reasonably well understood as a coupled ocean/atmosphere phenomena where the physical system can be expressed if not predicted very well. PDO remains just an index. It's an indicator of what is happening the oceans, it is not yet linked to any causitive physical system. And that index may be no more than another expression of the ENSO physical system. The interest with temperatures is not to link them to any index, but to link them to underlying physical system. This would happen if it was discovered there was an underlying ocean phenomena beyond ENSO. -
Camburn at 13:25 PM on 15 July 2011Monckton at odds with the very scientists he cites
"Other studies reinforce the view that when considered either by hemisphere or globally, the temperatures we are experiencing now are truly unprecedented". Mr. Abraham: I would suggest that you change the wording of this sentence. We all know that the Holocene Optimum had temperatures warmer than present temperatures. And indications from sea level proxy data, pollin data proxy etc strongly indicate that the Roman Warm Period was warmer than present temperatures. As far as the MWP, areas had substained temperatures as warm or warmer than present temperatures.Response:[DB] "We all know that the Holocene Optimum had temperatures warmer than present temperatures."
Umm, nope. Got a source for that? Anyway, that's off-topic.
"the Roman Warm Period was warmer than present temperatures"
Again wrong. And off-topic again.
"As far as the MWP, areas had substained temperatures as warm or warmer than present temperatures."
Still wrong. And still no cites, so now you're just trolling.
Look, if you're not going to even try to adhere to the standards expected of one adding comments on a climate science blog forum (Rule #1, always back up assertions with links to reputable sources), then don't expect your comments to survive moderation.
Be advised.
-
Rob Painting at 13:03 PM on 15 July 2011Why Wasn't The Hottest Decade Hotter?
Barry -"it looks like we've finally admitted what the skeptics have been saying, and have leapt upon the first reason to explain it that we can. We've dropped one argument in favour of another that contradicts the first." Barry, "skeptics" have been predicting global cooling for decades now, but the Earth keeps on warming - pretty much like we expect it to. Rather than constrain ourselves to "skeptic" narratives isn't it useful or at least interesting to examine why there is short-term variability? -
barry1487 at 12:56 PM on 15 July 2011Why Wasn't The Hottest Decade Hotter?
I've posted in the PDO thread. I think we're missing something there. -
Bob Lacatena at 12:51 PM on 15 July 2011Why Wasn't The Hottest Decade Hotter?
From the OP:As East Asia begins to install smokestack scrubbers to reduce sulphate pollution...
Does anyone have any idea what the time frame will be on this? My nightmare scenario would be ten or fifteen years of masked global warming, followed by a sudden, nightmarish takeoff that stuns the skeptics and the public and the politicians... but by then it's much, much too late. -
barry1487 at 12:34 PM on 15 July 2011It's Pacific Decadal Oscillation
Revisiting this topic after discussion in a recent thread: I think it's clear that the PDO has a negligible impact on centennial trends (if at all), but the skeptical focus is on decadal trends, and the argument is that the global temperature trend of the last 30 years or so is partly a result of the upswing (to about 1998). A question i've had in mind is about the difference between ENSO and PDO, where the former is linked to short-term fluctuations in the global temperature record, but the PDO is not. the language most often used is something like 'PDO shifts heat around within the system, but doesn't influence global temps.' I do not understand why one ocean/atmosphere system with fluctuating temperature indices should impact global temps (ENSO) and another shouldn't. In the other thread, I asked about this and was directed here with the comment, "PDO is basically an index whereas ENSO is a physical system." PDO and ENSOS are both expressed as indices - temperature indices. I don't see how one is a 'physical system' and one isn't. Nor does it matter what causes PDO or ENSO for the purposes of my enquiry. If PDO has a decadal influence on global temps, then it can be said that the thirty year global temp trend to 1998 may partly be a result of the PDO warm phase. Solar variability and cosmic rays show no trend for this period, but if PDO can be linked to decadal fluctuations in global temps, then the notion that natural factors have had a negligible effect on the trend for this period is undermined. Consequently, the trend rate for the last 30-40 years is only partly to do with CO2. I think skepticism has largely moved on from claiming the PDO is responsible for global warming on centennial scales, but I don't think we yet have a satisfactory response to argument about PDO effect on shorter time-scales. -
Andy Skuce at 12:09 PM on 15 July 2011Thinning on top and bulging at the waist: symptoms of an ailing planet
Yvan Dutil You are correct that change day length is rather less of a tidy story than the changes in oblateness measured by SLR and GRACE. Day length is affected not only by mass distribution changes in the atmosphere, oceans, cryosphere and lithosphere but also by changes in angular momentum in the Earth's outer, liquid core. Dynamical effects in the outer core produce measurable changes in day length with a cycle of 65-80 years. You may find this article to be of interest. -
Eric (skeptic) at 12:03 PM on 15 July 2011Why Wasn't The Hottest Decade Hotter?
barry, thanks for the correction http://cses.washington.edu/cig/pnwc/compensopdo.shtml I don't want to discuss that further here, it was only supposed to be an example. -
scaddenp at 12:00 PM on 15 July 2011Why Wasn't The Hottest Decade Hotter?
The proper thread would be Its the PDO. PDO is basically an index whereas ENSO is a physical system. There is some evidence that PDO may be long-lived integrator of the ENSO cycle. See the linked article. -
Andy Skuce at 11:49 AM on 15 July 2011Thinning on top and bulging at the waist: symptoms of an ailing planet
WSteven: Yes, thanks, you are right, centrifugal force is a fictional force, like the Coriolis force, but I figured that the people who already knew why the equator bulged wouldn't be confused by the term and those who didn't know wouldn't have heard of centripetal forces. There's often a trade-off between precision and clarity when it comes to terminology. -
barry1487 at 11:42 AM on 15 July 2011Why Wasn't The Hottest Decade Hotter?
That begs another a question I have in my mind from previous comments at this blog and others. I've read in various places that the PDO moves heat around, and doesn't by itself contribute to fluctuations in global temperature. This is different from ENSO, where it is explained that this ocean atmosphere system does have that influence. I've never understood why these systems should be distinct in this fashion. If PDO does provide multi-decadal influence on global temperature (as ENSO does on shorter time scales), then there's meat to the argument that the PDO is signal is apparent in the instrumental record, and that the high warming rate of the last 30 years may partly stem from that. This doesn't affect the centennial trend much, but it would have an impact on the last 30 years or so, which trend has been argued to be a result almost entirely of CO2, natural factors (solar, cosmic rays) showing little trend. Dunno if this is the right thread for discussing that... -
Rob Honeycutt at 11:40 AM on 15 July 2011Monckton at odds with the very scientists he cites
AT @6... When filtering out all the duplicate references there are 297 papers listed as part of the CO2science MWP project. I've just started collecting and reading the papers. What's immediately and clearly evident is the 1) the MWP is heterogeneous both spacially and temporally, and 2) there are far fewer southern hemisphere proxies. When you start digging in you start realizing what a large and complex project it must be to put together a global proxy record for the past 2000 years. -
bothersome at 11:33 AM on 15 July 2011Monckton at odds with the very scientists he cites
Beware of those who claim they get relativity. Beware of those who haven't gone through the grinder that is the formal study and examination of a subject to high level, which is a necessary but not sufficient condition to begin to say 'I think I get it'. Thank you John Abraham for all your hard work. -
Eric (skeptic) at 11:30 AM on 15 July 2011Why Wasn't The Hottest Decade Hotter?
Another explanation is natural: 80's and 90's was AGW + natural, 00's was AGW - natural. A few natural factors fit the mold, the best one is PDO which was positive in the 80's and 90's which culminated in the 1998 El Nino which has yet not been repeated. -
barry1487 at 11:23 AM on 15 July 2011Why Wasn't The Hottest Decade Hotter?
Even something simple like:...the rate of global warming in the last decade or appears to have slowed...
-
barry1487 at 11:22 AM on 15 July 2011Why Wasn't The Hottest Decade Hotter?
The confusion, though, is understandable. The mainstream has consistently said that a decade is too short to establish a meaningful (statistically significant) trend, so when the article heads up with;the rate of global warming in the last decade or so has slowed
it looks like we've finally admitted what the skeptics have been saying, and have leapt upon the first reason to explain it that we can. We've dropped one argument in favour of another that contradicts the first. Yes, Kaufmann is talking about short-term variability: my issue is with the first sentence in the above article. Talking about a change in 'rate' implies trend analysis, and ten-year global temperature trends are statistically insignificant. I think the article should be amended, so that skeptics who don't read the comments are not confused. -
Icarus at 10:17 AM on 15 July 2011Why Wasn't The Hottest Decade Hotter?
Thanks Rob - I should have read the article better! -
Rob Painting at 10:07 AM on 15 July 2011Why Wasn't The Hottest Decade Hotter?
Dana @ 1 - love the cartoon! -
Yvan Dutil at 10:06 AM on 15 July 2011Why Wasn't The Hottest Decade Hotter?
Icarus, I got exactly the same reaction as you and I even send the Tamino work to Kaufmann, who I have met in a meeting a few months ago. I still waiting for the answer. -
Rob Painting at 10:03 AM on 15 July 2011Why Wasn't The Hottest Decade Hotter?
Icarus - as stated by Riccardo @ 4, Kaufmann looks at short-term variability. Long-term all the temperature datasets show warming, that's what the physics of the increased Greenhouse Effect dictate, but why does it vary on shorter timescales? What's going on there? The details aren't yet clear, but citing 'natural variability' explains nothing. "So is there good evidence that there really was an increase in negative forcing from industrial aerosols in this period?" See figures 2 & 3. -
WSteven at 09:55 AM on 15 July 2011Thinning on top and bulging at the waist: symptoms of an ailing planet
Good article on the mass re-distribution occurring due to the melting ice-sheets. One minor nitpick, being a science blog wouldn't it be better to avoid using fictional forces in discussing such as the earth's bulge at the equator? I suppose it's easier to say centrifugal as it's "common knowledge" and all, but I spend a lot of time trying to explain to kids that it's not a real force. Again, a minor nitpick. Thanks for posting this, Andy. -
Doug Mackie at 09:52 AM on 15 July 2011Great Barrier Reef Part 3: Acidification, Warming, and Past Coral Survival
@DLB: It seems scarcely credible that anyone reading could have missed the point that the rate of change is of concern. I do hope you pay more careful attention to the OA not OK series so as to remedy your admitted ignorance of ocean acidification. -
Humanracesurvival at 09:05 AM on 15 July 2011Trenberth on Tracking Earth’s energy: A key to climate variability and change
From above study: However, all current global climate–carbon cycle models ignore a potentially important soil biological heating term that could change this situation radically. -
Humanracesurvival at 09:00 AM on 15 July 2011Trenberth on Tracking Earth’s energy: A key to climate variability and change
I just saw this related study.. Soil carbon and climate change: from the Jenkinson effect to the compost-bomb instability First generation climate–carbon cycle models suggest that climate change will suppress carbon accumulation in soils, and could even lead to a net loss of global soil carbon over the next century. These model results are qualitatively consistent with soil carbon projections published by Jenkinson almost two decades ago. More recently there has been a suggestion that the release of heat associated with soil decomposition, which is neglected in the vast majority of large-scale models, may be critically important under certain circumstances. Models with and without the extra self-heating from microbial respiration have been shown to yield significantly different results. The present paper presents a mathematical analysis of a tipping point or runaway feedback that can arise when the heat from microbial respiration is generated more rapidly than it can escape from the soil to the atmosphere. This ‘compost-bomb instability’ is most likely to occur in drying organic soils with high porosity covered by an insulating lichen or moss layer. However, the instability is also found to be strongly dependent on the rate of global warming. This paper derives the conditions required to trigger the compost-bomb instability, and discusses the relevance of these to the concept of dangerous rates of climate change. On the basis of simple numerical experiments, rates of long-term warming equivalent to 10°C per century could be sufficient to trigger compost-bomb instability in drying organic soils. -
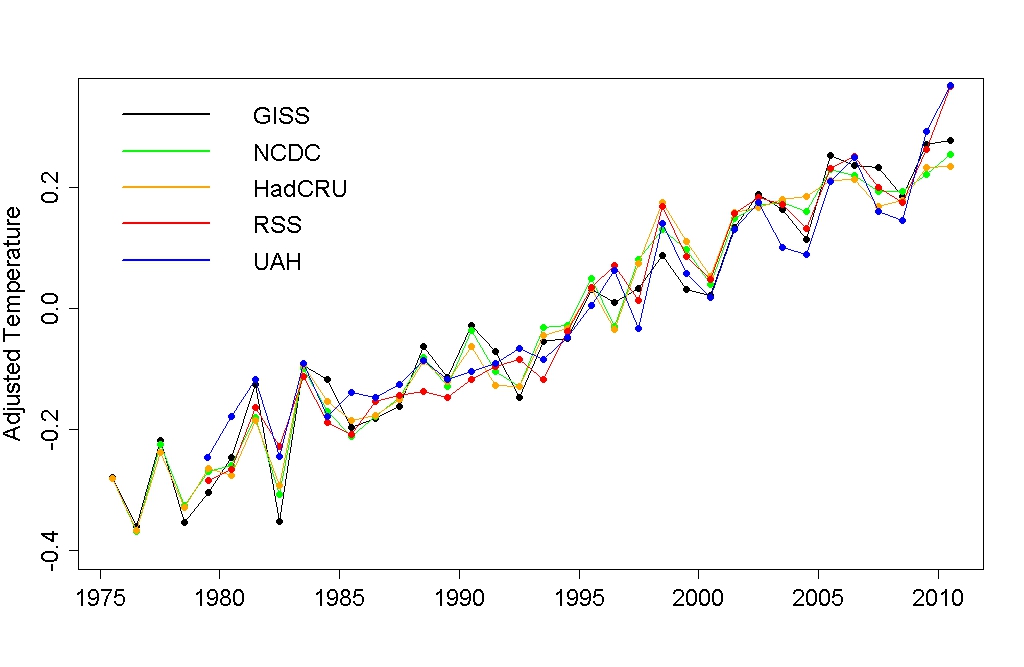
Icarus at 08:52 AM on 15 July 2011Why Wasn't The Hottest Decade Hotter?
I don't really understand the Kaufmann issue. Different temperature series give quite different trends from 1998 to 2008 - If you go by GISTEMP then there was no decrease in the warming rate at all, and if you go by UAH the decrease was minimal. If you adjust all series for variations in solar irradiance, volcanic aerosols and ENSO, as Tamino has done here, then it's not apparent to me that any of them show any decrease in warming in this period that needs to be explained with industrial aerosols:
 So is there good evidence that there really was an increase in negative forcing from industrial aerosols in this period? If so, that suggests to me that the anthropogenic greenhouse warming trend which underlies the natural variability must be even greater than Tamino's analysis indicates (if it's offset by a negative forcing that his analysis doesn't take into account). Or, is the Kaufmann aerosol paper trying to explain a slowdown in warming that doesn't even exist? Isn't 10 years too short a period to really be confident about a trend anyway, regardless of what series you use?
-
Humanracesurvival at 08:51 AM on 15 July 2011Trenberth on Tracking Earth’s energy: A key to climate variability and change
Ok, but we have now 4% more water vapor around - increase of precipitation, especially the upper 10% of heavy downpours, shifting patterns and a more acidic environment beside other factors, then 30years ago. So the energy budget of the Pedoshere is going up, a lot more energy input vise which faster erodes and weathers. And here we have sinks and we know that warmer temperature is increasing Decomposition and Denitrification. And we know that during the PETM distinct layers (suboxic/hypoxia) formed in the ocean/land mass acting like a blocking layer of energy transport. So i wonder if these "growing" sinks can not be accountable for the "missing energy". Because i don't know how the models work and how exactly the energy budgets are quantified i have to ask. -
Riccardo at 08:26 AM on 15 July 2011Why Wasn't The Hottest Decade Hotter?
cynicus you need to distinguish between long term trend (Hansen) and short term variability (Kaufmann). And also understand that Jones didn't say there has been no warming. -
Eric the Red at 08:19 AM on 15 July 2011Why Wasn't The Hottest Decade Hotter?
I think the question was always there. The lack of warming has been apparent for quite some time, but many people have tried to claim that is wasn't. Kaufman offers a plausible explanation, which seems to be echoed by Hansen. We will have to wait for other research to confirm this/ -
r.pauli at 08:06 AM on 15 July 2011Monckton at odds with the very scientists he cites
I agree that we should be civil and respectful in our discourse. But the respect goes to those who are serious about facing the future. While we are polite and deferential - there are real and horrific global warming events has been unfolding - changes that are unmitigated by much of any adjustment to CO2 emissions. For more than the last decade the world has suffered delay and distraction from making changes that could have helped. In this way, deniers like Monkton have done real harm. He does not deserve our respect. While it is kind of you to carefully evaluate what he saying. And it is professional of you to dissect his presentations. But Monkton is a dangerous buffoon, lacking rational logic and devoid of ethics. In a civil and just world, he would be politely ignored. I fault various organizations for promoting his brand of tinfoil-hat psudo-infotainment. And following those who deliberately mislead is itself crazy. -
Doug Mackie at 07:43 AM on 15 July 2011OA not OK part 5: Reservoir dogs
@JosHag"One would also expect that a lower uptake of CO2 (very) slowly would get visible in the atmospheric CO2 concentration, at least when the emission rates don't change".
Perhaps. The short answer is that temperature is just one of several variables that control the transfer of CO2 between the atmosphere and ocean. While general trends can be predicted, it is not at all clear how the fine detail of other variables such as ocean circulation and biological activity will or will not change. -
cynicus at 07:27 AM on 15 July 2011Why Wasn't The Hottest Decade Hotter?
How is the pauze consistent with e.g. Hansen's GISS that finds that the 2000s warmed as rapidly as the decades before that? Hansen: [..], we conclude that there has been no reduction in the global warming trend of 0.15°C–0.20°C per decade that began in the late 1970s. Or with Jones' BBC ordeal with 1995-2011 now showing warming at the 0.05 confidence level, which imho means you can't really tell (in HadCRUT) how real any linear trend is over the last decade. Is this Kaufmann paper trying to answer a question that wasn't there to begin with (regarding a pauze in warming, I'm not disputing the increase in aerosols)? -
KR at 07:11 AM on 15 July 2011Monckton at odds with the very scientists he cites
Non-scientists interpret the works of scientists every day. But deliberately misrepresenting those works (as Monckton does, demonstrably and repeatably) is the act of a denier. actually thoughtful - Abraham has spent quite some effort cross-checking Monckton's claims. No-one he has contacted has supported them. You yourself could check this - pick a few references at complete random (statistical sampling), read the papers, and see if they actually support Monckton. They do not. -
dana1981 at 06:51 AM on 15 July 2011Why Wasn't The Hottest Decade Hotter?
Nice post, Rob. jg made a great cartoon on this subject:
-
les at 06:25 AM on 15 July 2011Monckton at odds with the very scientists he cites
I kind of agree with A. Thoughtful, but IMHO the issue isn't scientist .v. Non-scientsis; but that one should be cairfully depending on someone for whom there is either no cost to being wrong (mostly professionally, but there are of course other reputations) or, even more, someone whos value is in holding a firm [wrong]position. The tragedy for TVMOB - not to mention McInT, Watts etc. is that they get to be considerably less significant as soon as they stop pleasing the mob. -
scaddenp at 06:20 AM on 15 July 2011The Medieval Warm(ish) Period In Pictures
Eric, I did not doubt for a moment that glacier would retreat when it was warm. I also noted that the warming not synchronous across the planet like warming is today. What I was countering in the post, was the idea that MCA was globally warmer. Most glaciers have retreated further than did in medieval times and sealevel is higher. -
actually thoughtful at 06:13 AM on 15 July 2011Monckton at odds with the very scientists he cites
I take issue with this statement :"Second, it is very dangerous to rely upon the interpretation of a non-scientist to real science work." If the interpretation is divergent to the scientists, sure, no problem. But I personally, as a non-scientist, interpret the work of scientists every day. And I am reasonably good at it. Science is not some rarefied, elite process that we mere mortals are incapable of understanding. Indeed, the best scientists find ways to make their research accessible to the masses. I can't follow all of Einstein's math, but I get the concept of relativity. Also, you list 6 responses. Rob Honeycutt tells us there are 312 in total. Did you omit any of the other responses? What happened to the other 306? How many did you contact? How many responded? Mind you I completely agree with you that Monckton is not credible on issues of climate science, and appears to give deniers a bad name, I just read this article skeptically and found plenty of places where missing information makes it much weaker than I suspect it is (ie answer my questions in the actual article and you will have a powerful commentary on Monckton). -
Andy Skuce at 05:42 AM on 15 July 2011Trenberth on Tracking Earth’s energy: A key to climate variability and change
Humanracesurvival @ 52 It may be true that rapid removal of glaciers from volcanoes may provoke eruptions to occur earlier than they otherwise would have. It's also conceivable that sudden reductions in ice sheet thicknesses could cause earthquakes. However, these would temporarily and slightly increase the amount of energy coming out of the Earth. What we are looking for are hidden sinks and not extra hidden sources for the energy budget. Anyway, the total amount of energy emitted from the Earth's interior is only about 1/10,0000 of the amount of solar radiation (not even big enough to be worth showing on Kevin Trenberth's Figure 1) and any small increases in this quantity due to climate-tectonic interactions would be entirely inconsequential in terms of the planet's energy budget. -
Albatross at 04:46 AM on 15 July 2011What we know and what we don't know
Composer @40, "Certainly, from the perspective of public policy, it seems to me that we have enough knowledge to comfortably demand action on the matter." Agreed! -
Eric the Red at 04:39 AM on 15 July 2011What we know and what we don't know
Not quite sure what you mean by the strawman argument. But if you mean that those trying to show exponential CO2 growth have been demonstrably wrong, then I agree. In June, CO2 was 1.66 ppm higher than in 2010, and is averaging 1.62 ppm higher than 2010 throughtout the first six months of 2011. Most likely due to the strong La Nina and lower SST. http://co2now.org/Moderator Response: [Dikran Marsupial] Eric, we are by now aware of your hypothesis that there has been a shift from exponential to linear growth in CO2. Now unless you can demonstrate that it isn't merely an artifact of the noise (i.e. a test of statistical significance) then there is nothing more that remains to be usefully said. The moderators have been very lenient with you so far, but this issue is now off-topic and it is unfair on other readers of SkS to allow the discussion to be derailed any further. Ironically, from the link you provide "What is the current trend? The concentrations of CO2 in the atmosphere are increasing at an accelerating rate from decade to decade. accelerating from decade to decade. The latest atmospheric CO2 data is consistent with a continuation of this long-standing trend." -
Composer99 at 04:33 AM on 15 July 2011What we know and what we don't know
For a layman such as myself, I see the 'take home' message of this post being that, thanks to the tireless research performed by climatologists and a wide variety of other [take your pick]-ologists, we know an awful lot about the Earth climate system, and we know increasingly more with each passing year. It may well be the case that there is more left to learn than there is learned about the behaviour of the Earth climate system. This does not diminish the sheer amount of accumulated knowledge already gathered. Certainly, from the perspective of public policy, it seems to me that we have enough knowledge to comfortably demand action on the matter. -
Albatross at 04:31 AM on 15 July 2011What we know and what we don't know
Sorry Daniel, we cross-posted; only saw your post after I submitted #48.Response:[DB] No problem, Albatross. Your conclusions are spot-on.
I just played Lizzie Borden (a whack-whack here, a whack-whack there) to clean up the debris on this thread.
Prev 1602 1603 1604 1605 1606 1607 1608 1609 1610 1611 1612 1613 1614 1615 1616 1617 Next


