


 Arguments


Recent Comments
Prev 1610 1611 1612 1613 1614 1615 1616 1617 1618 1619 1620 1621 1622 1623 1624 1625 Next
Comments 80851 to 80900:
-
Yvan Dutil at 23:50 PM on 14 July 2011Thinning on top and bulging at the waist: symptoms of an ailing planet
Earth rotation period does not seam to have such a nice signature: http://hpiers.obspm.fr/eop-pc/earthor/ut1lod/lod-1623.html Or, the pole coordinate: http://hpiers.obspm.fr/eop-pc/products/combined/C01plot.php?date=2&graphe=2&deb=1846&fin=2011&SUBMIT2=Soumettre+la+requ%EAte -
Slioch at 23:23 PM on 14 July 2011Monckton at odds with the very scientists he cites
Monckton has made false statements concerning published material before. In an article written by Monckton and published via the UK Daily Telegraph newspaper, 5th Nov. 2006, entitled "Apocalypse Cancelled", which paid particular attention to the MWP, Monckton claimed that: "According to ... Soon & Baliunas (2003), the mediaeval warm period was warmer than the current warm period by up to 3C." But if you actually bother to scrutinise the Soon & Baliunas (2003) paper you find that they make no such claim, nor anything like it. -
Eric the Red at 23:23 PM on 14 July 2011The Medieval Warm(ish) Period In Pictures
True, But some glaciers are advancing today also, but I would not conclude that the world is cooling. There is enough glacial evidence to support the assertion that the planet warmed during the MWP.Response:[DB] It is not a question of "some". The majority of the world's glaciers today are embarked on a decades-long retreat:


[Source]
There is enough glacial evidence to support the assertion that the planet periodically cooled or did not warm uniformly during the MWP.
Again, not a metric to rely upon to prosecute your narrative.
-
Eric the Red at 23:11 PM on 14 July 2011The Medieval Warm(ish) Period In Pictures
Scaddenp, Are you satisfied now that glaciers did recede during the MWP? Your posts seem to indicate that.Response:[DB] Some glaciers retreated, some advanced at the same time. Not a "silver bullet" marker to hang one's positional hat on.
-
Eric the Red at 22:20 PM on 14 July 2011Visions of the Arctic
So true Paul. We Americans have set aside large tracts of land for native wild areas because we can. Other nations are not so fortunate. In fact, those species most threatened come from the areas of greatest human density, and therefore, human contact and abuse. All species are interconnected; some in positive ways, some in negative, and some more closely than others. The majority of wildlife has been negatively influenced by human action, although there are those who have benefited. Similarly, every time the climate has changed in the past, the have been losers, but also some winners. The polar bears and manatees mentioned above have no direct interaction, and live in extremely different environments. Therefore, one would expect changes to affect each much differently. -
Rob Painting at 22:06 PM on 14 July 2011Great Barrier Reef Part 3: Acidification, Warming, and Past Coral Survival
Take issue all you like DLB, but do you have any evidence that GBR coral reefs can do what you claim? I've just read the above post by one of the world's foremost coral reef scientists and he says otherwise. Remember we are talking about the reef eco-system, not just coral larvae. In human terms you're suggesting that just because an individual human can move from point A to point B, moving a city from point A to point B is likewise as simple. The reality is somewhat more complex. -
Humanracesurvival at 21:44 PM on 14 July 2011Thinning on top and bulging at the waist: symptoms of an ailing planet
[snipped] The data is exactly tied to this topic and based on hard scientific findings. Repost with content: Today the Pine Island Glacier in Antarctica is quickly melting downward from the surface – dropping in altitude at nearly 16 meters per year. With an area over 5 thousand square kilometers, this glacier holds a lot of cubic meters of ice and means that a lot of weight is now getting shifted into the ocean. Similarly, the melting of glaciers in Greenland and elsewhere will trigger seismically elastic reactions that should be noted for their frequency, intensity and novel locations. Connecting the Dots: Climate Change drives Earthquake / Seismic activityModerator Response: (Rob P) Note the commenting rules. No links only. Provide some discussion or context, or risk the comment being deleted. Thanks for your future co-operation. -
Camburn at 21:31 PM on 14 July 2011The Medieval Warm(ish) Period In Pictures
That would be up to Mr. Mann to rerun his analysis with the proxy data included. -
DLB at 21:19 PM on 14 July 2011Great Barrier Reef Part 3: Acidification, Warming, and Past Coral Survival
I can't comment on acidification as I don't know enough yet. But I do take issue with the perceived slow rate of coral migration. We are not dealing with land snails here, the coral and many of its associated organisms have a free floating larval stage which could easy travel 25km in a day on ocean currents. Given warm clean shallow seawater with suitable substrate the polyps would be in like Errol. Many don't seem to realise how opportunistic nature is, it would put our capitalistic economies to shame for exploiting any suitable niche. Just think of the money that is spent trying to keep the hulls of boats clean. -
Humanracesurvival at 21:12 PM on 14 July 2011Trenberth on Tracking Earth’s energy: A key to climate variability and change
In my first post i tried to bring attention to the "Pedosphere", maybe a more explicit point into geomorphological implications helps to understand the connections of the climate system. > Earthquakes, tsunamis, and volcanoes. Something real, something hard, fast, and impossible to ignore. Increasing evidence and statistical analysis links increased seismic activity to global warming. Royal Society Stunner: “Observations suggest that the ongoing rise in global average temperatures may already be eliciting a hazardous response from the geosphere.” Climate Change and the Geosphere So if there is energy missing, my guess it's transfered into seismic energy. Even if the timescales are huge, prone tectonics could literally "wake up" in a much faster time then previously thought (we emitting carbon 10.000 times faster + accelerating the process, then during the PETM!). Monsoons spinning the Earth's plates: study -
Svatli at 20:22 PM on 14 July 2011Monckton at odds with the very scientists he cites
John: Thanks for the good work of debunking Christopher Monckton, a necessary job. I would also like to refer to a good debunking of the CO2Science medieval project by Hoskibui here on SkS, Medieval project gone wrong. Dr. Craig Idso's website doesn't seem to check the sources either and his website is filled with flaw work and misrepresentations. -
Doug Mackie at 19:27 PM on 14 July 2011OA not OK part 4: The f-word: pH
Yes. The concept of alkalinity is more useful that simply considering H3O+ and OH-. -
Doug Mackie at 19:13 PM on 14 July 2011OA not OK part 5: Reservoir dogs
You have an open mind? What doubts remain (one way or the other)? Your question is not in any way difficult. I asked because that other DLB that is, as you say, not you, has a rather closed mind and I would not have wished to spend time answering questions for one who would not listen. As I wrote above for TorB: "If you put a pH electrode in a solution today you are measuring pH by proxy. Different proxies are used to determine past ocean conditions. Posts 11 &12." -
DLB at 19:01 PM on 14 July 2011OA not OK part 5: Reservoir dogs
Thinking some more about how they might have measured pH of the ocean say 150 years ago. Were alkalinity titrations with a strong acid involved? I'm certainly no chemist, but I have a feeling this may be part of the answer? -
Rob Painting at 18:06 PM on 14 July 2011Trenberth on Tracking Earth’s energy: A key to climate variability and change
David Lewis @ 49 - I like to think of the Antarctic Circumpolar Current as the 'lungs of the deep ocean' in the way it transports oxygen, CO2, salinity and heat into the deep ocean. There's little doubt the deep ocean has warmed over the last two decades, as seen in Purkey & Johnson (2010) & Kouketsu (2011) - but the measurements are sparse and the uncertainties large. -
Paul D at 18:04 PM on 14 July 2011Visions of the Arctic
I would like to point out to Americans that comment here, that along with other large nations. You can get a misleading view of human capacity to do damage to the environment. Having plenty of land and lower density populations can give the impression that humans have a long way to go before doing any significant damage. That unfortunately is not true in nations where land available is less and population growth has resulted in higher densities. The UK for instance has no significant native wild areas. It is all managed and manipulated. It is an example of what can happen with unrestrained human development. It is incapable of feeding itself and humans desperately try and protect species in small patches of land sometimes on no more than an acre. If that is replicated across the world, then you are talking about large numbers of deaths. Here in the UK we only support a population of 60 million (and growing), because we are dependent on land elsewhere, including America, Europe, Russia etc. If land is messed up elsewhere due to climate change or other abuses by humans. Then many nations, will have a lot of problems, because there is a high levels of interdependency. -
Paul D at 17:47 PM on 14 July 2011Visions of the Arctic
Apirate said: "I am also a recommended consultant by my state Department of Natural Resources for nuisance wildlife control." Sounds very American! 'Department of Natural Resources' - We control nature it's a useful resource to exploit. 'Nuisance wildlife control' - Humans are expanding and using more land, those pesky animals keep coming into our cities, we need to control them. It's all in the language. And you really do emphasise the core of my comment@34. -
villabolo at 16:58 PM on 14 July 2011The e-mail scandal 'trick' to hide the real meaning of 'hide the decline'
JohnC; please have this post replace the one in the rebuttal argument list, basic level. The rebuttal in the argument list, with my name on it, isn't the one I wrote. -
Rob Painting at 16:56 PM on 14 July 2011Trenberth on Tracking Earth’s energy: A key to climate variability and change
David Lewis & Ken Lambert - the 'decadal-long mystery mechanism' for deep ocean heat sequestration is indeed intriguing. It also shows up in the Max Planck Institute coupled climate model simulations too. Katsman & Oldenburgh (2011) (-snip-) Note how the warming trend continues, with the 'slowdown' compensated for by large upswings. If that's a reflection of how the climate really operates, it doesn't bode well for the next decade.Response:[DB] Graphic removed at author's request.
-
David Lewis at 16:31 PM on 14 July 2011Trenberth on Tracking Earth’s energy: A key to climate variability and change
I'd like to see Dr. Trenberth answer the question of how heat gets to the deep ocean and back again to "haunt us" in a matter of decades. Is this a new process his model shows now that the planetary system is this warm? Dr. Joellen Russell was interviewed by Robyn Williams on The Science Show about her theory that the interaction of ozone depletion and global warming, by affecting the location and power of the Southern Westerlies, will affect the power of the Antarctic Circumpolar Current, which will drive more heat and CO2 into the deep ocean for many decades then shut off this primary driver of global ocean circulation. Her models suggest that as the Westerlies move south and locate themselves more directly over the Antarctic Circumpolar Current they will drive it more intensely. Since this current is 4 times more poweful than the Gulf Stream and is the major driver of the exchange of water between the deep ocean and the rest of the global ocean, more heat and CO2 thus will go into the deep ocean, at least until it all stops. I'm not clear on why she says it all stops after a while. On the other hand, Boning et.al. studied the Antarctic Circumpolar Current and found no evidence that it had strengthened although the Southern Westerlies have changed their location quite a bit already - they seem to think that the ACC might be as strong as it can get already and all additional energy will be dispersed as eddy currents. But at this year's AGU Martinson described his observations of increased heat in the ACC and accelerated glacial melt in the Antarctic Peninsula. Russell in her Science Show interview states that observations like what Martinson is making confirm her theory that the ACC is increasing in power. I became interested in trying to understand all this but as you can see I didn't get that far. If more heat and CO2 go into the ocean it will affect the average global surface temperature chart which so many seem to think is the prime indicator as to whether climate change is happening or not. I.e one of the big effects may be political. I think we've got to make the point more often that almost all heat is going into the ocean anyway, so this story of global warming is mostly about global ocean warming. It wouldn't take that great of a percentage increase in the amount of heat going into the ocean, because so much is going in already, especially if somehow what increased was only the heat going into the deep ocean, to make that global average surface temperature chart everyone thinks indicates whether the system is warming or not flatline, which would tend to cause even more political inertia than we are observing already. One of many things I'd like to ask Hansen is does Russell's work affect his suspicion that current models overestimate how much heat goes into the deep ocean? Russell seems to be saying we've underestimated what is going on, and even if Boning hasn't observed it, Martinson's melting ice must have a cause. One thing I'd like to ask Trenberth is what is his opinion of Russell's work. The NOAA pix of ENSO I posted in a comment above are representations of TAO data, not ARGO, which go much deeper. I don't know if someone has come up with a graphic like that of what is going on using ARGO data for ENSO or for other ocean events. I put them up to illustrate the potential new data like ARGO represents, and also because those graphics helped me understand what ENSO is. -
villabolo at 15:11 PM on 14 July 2011More Carbon Dioxide is not necessarily good for plants.
JohnC I would like this Post to actually appear in the rebuttal section since I cannot make changes to it. I can only make changes to this post. I'm kind of confused. -
mandas at 14:48 PM on 14 July 2011Great Barrier Reef Part 3: Acidification, Warming, and Past Coral Survival
If this post doesn't scare the crap out of you, then you are just not thinking hard enough. Take this statement: "....Given that these levels of carbon dioxide in the atmosphere are likely to be associated with at least a 2°C increase in sea temperature, it appears that coral reefs will largely disappear if atmospheric concentrations of carbon dioxide exceed 450 ppm...." He is saying that coral reefs will largely disappear at the level of climate change that we are hoping and aiming to restrict it to. And what's worse is that we appear to have little to no chance of limiting climate change to 2 degrees or 450 ppm CO2. In other words, there is no hope for coral reefs - they are going to disappear even under the best case scenario. And if coral reefs disappear, the whole ocean ecosystem will undergo some form of catastrophic collapse. The consequences of that are just too frightening to think about - and it would appear that we have no will or intent to do anything about it. -
DLB at 13:46 PM on 14 July 2011OA not OK part 5: Reservoir dogs
I might have been there once so it is not me, I'm not into politics anyway. However I have a very inquiring, sceptical mind. I have an open mind about OA at this stage. I was hoping this was the website where one could ask difficult questions with respect. I get rather tired of the "cheer squad" websites on both sides of the climate debate. -
villabolo at 13:40 PM on 14 July 2011CO2 is plant food
johnd @ #4: "Are you able to quantify both the reduced nutritional quality..." Johnd; unfortunately my link is to an abstract with a paywall. I could research it, but I don't believe it would be appropriate for a basic level rebuttal. I try to keep basic level rebuttals at a High School level for laymen interested in the subject of GW but not the details or specifics. As for the argument that CO2 is "plant food", that is the phrase that skeptics use in order to give the simplistic idea that more "food" will help all plant life. -
Albatross at 13:22 PM on 14 July 2011Great Barrier Reef Part 3: Acidification, Warming, and Past Coral Survival
Dr. Hoegh-Guldberg, Just a short note to say thanks you for your informative (but sobering) posts here at SkS. Very much appreciated. Sad to note that some still insist on ignoring the myriad of warning signs, not to mention the role of cumulative impacts on ecosystems. SkS is attracting some eminent scientists, you included. Kudos to John Cook for making that happen, I just wish that you and Trenberth could be the bearers of better news. -
RW1 at 13:12 PM on 14 July 2011Trenberth on Tracking Earth’s energy: A key to climate variability and change
DB says: "[DB] Please do not rehash the entirety of the 2nd Law thread. You were painstakingly corrected there, many times, by patient commentators." What is this supposed to mean? I don't even know what you're referring to, and I certainly don't expect Kevin to go sifting through various threads to answer questions. These issues have come up in many different threads, and I and others have been accused of being off topic addressing them, and it was suggested by many that we have a separate thread on it. Now there is finally a thread and we can't address the issues again? Is this what your saying? If it's not what you're saying, perhaps you can clarify what it is you mean?Response:[DB] It means what it says. Various learned individuals have tried to help you gain understanding but were thwarted by your insistence upon reality contorting itself to your personal interpretation of it. Quite frankly, everyone's patience has grown thin at the intransigence displayed. "Going there" yet again (both you and your mentor George White) even after being corrected is trolling.
-
ianash at 13:09 PM on 14 July 2011OA not OK part 5: Reservoir dogs
Thank you for clarifying it for me! -
DLB at 13:04 PM on 14 July 2011OA not OK part 4: The f-word: pH
That was a hypothetical question, I would imagine the level of dissociation of water is fairly constant. I was thinking along the lines of if H30+ went up and OH- went up would pH go down. Thinking some more, you can't have a strong proton donor in solution with a strong proton acceptor, the "peanut" equation will go back to molecular water. OK, Sorted. (I'm surprised you think those that read scientific journals are free from misapprehensions) -
scaddenp at 13:03 PM on 14 July 2011The Medieval Warm(ish) Period In Pictures
Then perhaps you should rerun Mann's analysis and see if come up with a different result. (A good basis for a publication). -
Ken Lambert at 13:00 PM on 14 July 2011Trenberth on Tracking Earth’s energy: A key to climate variability and change
David Lewis & Rob Painting Dr Trenberth has generously given his time to answer queries by private email in the past - so if he is travelling in AU/NZ we can only hope he can find time to answer questions on this thread. Regarding this quotation from above post: "In the meantime, we have explored the extent to which this kind of behavior occurs in the latest version of the NCAR climate model. In work yet to be published (it is submitted), we have found that energy can easily be “buried” in the deep ocean for over a decade. Further preliminary exploration of where the heat is going suggests that it is associated with the negative phase of the Pacific Decadal Oscillation and/or La Niña events." Without seeing the yet to be published paper, it seems this 'heat burial' would raise a number of further questions: 1. What is the physical mechanism for getting heat down into the deep oceans (below 700m? or 2000m?) in short time frames - a few years? 2. Over a decade - why not 2 or 3 decades or 50 years? Heat buried from prior to the 'official' start of AGW in 1975 could be re-appearing to warm the surface. Would that be caused by AG forcings or the Sun? 3. Again my question from #31 about whether the ENSO-La Nina cycles are 'internal' redistributions of global heat already within the system or are external global forcings which should be added to the RF and climate response terms to determine an imbalance? Unless I am misreading the scale in DL #43 graphic - the depth of ENSO-LaNina 'sloshing of heat' is 300-600ft (100-200m)- hardly related to the deep oceans. -
adelady at 12:43 PM on 14 July 2011A Detailed Look at Renewable Baseload Energy
BBD "...currently inaccessible desert locations depends.." So choose accessible locations for the first couple of exercises. Near the coast there are plenty of roads. Further inland oil and exploration companies have made roads for their own purposes. Why not set up alongside them? "Why is it appropriate for Europe to assume that it has an uncontested right to the potential solar resource in North Africa?" No uncontested right, but a very attractive financial proposition. Why would anyone transport power from North Africa south? Countries to the south would be mad to pay for expensive power transported over long distances - across the whole of the Sahara - when they'd get a much cheaper deal for local solar. As for cheap. This idea looks good. Not what you'd go for first in difficult areas, but very promising. -
Doug Mackie at 12:21 PM on 14 July 2011OA not OK part 5: Reservoir dogs
@DLB, Forgive me but my time is valuable to me. Are you the DLB who is so prolific at the Huffington post about climate change matters? -
DLB at 12:11 PM on 14 July 2011OA not OK part 5: Reservoir dogs
Doug Mackie @5, Yes, how was oceanic pH determined before the industrial revolution? I know we can now dip a pH meter into a beaker of sea water. -
Camburn at 12:08 PM on 14 July 2011The Medieval Warm(ish) Period In Pictures
scaddenp: What would I use to identify outliers? Something that is out of the norm, I would want to examine the method of determing it as a suitable proxy. If the method of determination falls within accepted science and has been consistent, that would cause me to examine the other proxies to see why the variablility. It could very well be the other proxies are wrong and the outlier is correct. -
Camburn at 12:03 PM on 14 July 2011The Medieval Warm(ish) Period In Pictures
Mr. Mann used proxy data that he deemed relevant. From that data he then used re-amalysis to obtain what he thinks the temp patterns were during the MWP. The Sargasso Sea proxy data appears to show his re-amalysis has a flaw in it. I do not know what his error bars were. DB: I have not seen any rebuttals to the Sargasso Sea temperature proxies. I have seen supporting papers as the thermocline, currents etc seem to make this an excellent source of temp data. If you have any, I am open to reading them. -
David Lewis at 11:10 AM on 14 July 2011Trenberth on Tracking Earth’s energy: A key to climate variability and change
I did not mean to say that Dr Trenberth believes or has ever said that global warming has stopped. I can agree that the words I used are confusing. Here's another attempt: "Dr. Trenberth is clear that when he talks about "missing energy" he does not mean he believes global warming has stopped. Quoting from Dr. Trenberth:" Then follow with the quote I used. Perhaps you could edit my comment and remove your objections? I never intended to be saying what you've both taken from my words. I thought the conditional words in my sentence made things clearer than they obviously are, that's the "whether... it means" part. I set up the quote I used from Dr. Trenberth with this conditional, i.e. Dr Trenberth is clear about "whether... it means", then I let him speak for himself. -
Rob Painting at 10:39 AM on 14 July 2011Trenberth on Tracking Earth’s energy: A key to climate variability and change
David Lewis @43 - "Dr. Trenberth is clear when he talks about whether when describing things using this "missing energy" concept it means he thinks global warming has stopped" I also take issue with that claim. Did you just gloss over this part of Dr Trenbertth's post?: " we have found that energy can easily be “buried” in the deep ocean for over a decade." See Trenberth & Fasullo (2011) -
scaddenp at 10:38 AM on 14 July 2011The Medieval Warm(ish) Period In Pictures
So Camburn, when you are sorting through proxy data sets what methodology would you use to identify outliers? (from memory, Mann's is described in the supplementary info.) -
Doug Mackie at 10:30 AM on 14 July 2011OA not OK part 5: Reservoir dogs
@JosHag Too early to say with confidence. McKinley et al. divided the North Atlantic into 3 zones and split the ocean pCO2 system into 2 parts. One part is temperature related and one part is chemical related. The temperature part is about a quarter the size of chemical part. The chemical part is further subdivided into 3 sub-components. In one subdivision of one of the ocean zones the trend for part of the study period of one of the chemical sub-components increases with time while the trend for the other two chemical subcomponents decrease. From the conclusions:At the 1 sigma confidence level, we are able to detect short-term shifts in oceanic pCO2, reasonably explained by climate variability (9-11), and north of 30_ N, long-term oceanic pCO2 trends that track the rate of atmospheric pCO2 increase. A significant role for the seasonally stratified biomes of the North Atlantic in the proposed multi-decadal increase in the atmospheric fraction of anthropogenic CO2 (refs 8,26,27) is not distinguishable. However, in the North Atlantic permanently stratified subtropical gyre we do find an increasing influence on oceanic pCO2 by a warming trend that is partially due to anthropogenic forcing (12). This is evidence of a climate_carbon feedback that is beginning to limit the strength of the ocean carbon sink.
From the press release:[McKinley] stresses the need to improve available datasets and expand this type of analysis to other oceans, which are relatively less-studied than the North Atlantic, to continue to refine carbon uptake trends in different ocean regions. This information will be critical for decision-making, since any decrease in ocean uptake may require greater human efforts to control carbon dioxide levels in the atmosphere.
-
David Lewis at 10:12 AM on 14 July 2011Trenberth on Tracking Earth’s energy: A key to climate variability and change
Try re reading my comment. I'm quoting from Dr. Trenberth, so are you, and the two quotes say just about identical things. What's the problem?Response:[DB] I did re-read your comment. Your quote that I used in my response to you is the opposite of what Dr. Trenberth has up on his website, which I quoted. They are not identical. Or are you saying I misquoted you?
My quote of you:
"it means he thinks global warming has stopped"
My quote of Dr. Trenberth:
"It does NOT mean that global warming is not happening, on the contrary, it suggests that we simply can't fully explain why 2008 was as cool as it was, but with an implication that warming will come back, as it has."
No problem. Dr. Trenberth says global warming has not stopped, which is the opposite of your attribution of what he said.
-
Rob Painting at 10:06 AM on 14 July 2011The Medieval Warm(ish) Period In Pictures
To reinforce Phil Scadden's point about global sea level during the MWP, as compared to the present:
-
Bern at 10:05 AM on 14 July 2011Great Barrier Reef Part 3: Acidification, Warming, and Past Coral Survival
I'll second Byron's call for posts on rate of change. As this excellent series of articles on the GBR shows, the expected impacts are major, and a key factor is that they are extremely rapid by geological or ecological timeframes. -
Eric (skeptic) at 10:02 AM on 14 July 2011Are you a genuine skeptic or a climate denier?
Note for the record, I am taking up scaddenp's offer to discuss this by email. -
mandas at 09:38 AM on 14 July 2011Visions of the Arctic
Apirate @ 36 ".....Good post. Goes back to my polar bear and manatee analogy. What may be bad for polar bears will probably be good for manatees...." I thought you said you had an MS in Fisheries and Wildlife Biology? If so, you should give it back after that statement @ 36. Anyone with any knowledge of ecosystems and wildlife knows that the web of life is extraordinarily complicated, and that the removal or suppression of one species - particularly an apex predator - can have far ranging and entirely unpredictable consequences for other species. A very simple and well known example is wolves in Yellowstone NP. What species are regulated by predation by polar bears? If that regulation is removed, what will regulate their numbers in the future? Food resources? Is there competition between species for that food? What then happens to those species? What happens to lower level species if the level of predation is changed? etc etc etc And that's only part of the problem with climate change. Its not just wildife that are adapted to the current climate regime - humans and our whole culture are adapted to things exactly as they are now. If you change that, even by a small amount, you are going to create a requirement to adapt. Many species will be unable to and will go extinct - there is absolutely no doubt about that - and that will cause cascading effects which could cause trophic collapse in many parts of the world. The effects of this are completely unpredictable - and the associated costs are going to be staggering. People complain about the costs of mitigating climate change. They are in for a real shock when they find our what the costs of adapting are going to be. -
Camburn at 09:34 AM on 14 July 2011The Medieval Warm(ish) Period In Pictures
DB@48: I am not inferring a global event from the Sargasso Sea. I was just pointing out that proxy data from a number of papers it seems, does not agree with the reanalysis presented by Dr. Mann. I agree with the area of the Sargasso Sea as presented in this Wikki link. http://en.wikipedia.org/wiki/Sargasso_SeaResponse:[DB] I believe you pointed out one paper, which itself has "issues".
-
David Lewis at 09:24 AM on 14 July 2011Trenberth on Tracking Earth’s energy: A key to climate variability and change
One thing that seems certain in all this are these words from Dr. Trenberth's above post: "we have observing systems in place that nominally can measure the major storage and flux terms but due to errors and uncertainty, it remains a challenge to track anomalies with confidence". In Trenberth's original "Perspectives" paper published in Science Tracking Earth's Energy, he was clear that the "missing energy" he was discussing was "due to either inadequate measurement accuracy or inadequate data processing". However, Dr. Trenberth often talks or writes as if there is some actual "missing energy" he expects to find one day, as opposed to tracking down measurement or processing errors, which may lead to confusion for some. What Trenberth wrote in his original Science paper appears to place him very close to Hansen's view, i.e. that this is at present murky territory, except Hansen appears to be questioning how much heat models should be allocating to the deep ocean when Trenberth appears not to be. Hansen discusses how difficult he thinks it is to measure Earth's energy imbalance accurately, starting on page 44 in Earth's Energy Imbalance and Implications. Hansen says he thinks the Argo float system, if extended and maintained for the long term, added to other data on the smaller heat reservoirs, could provide "potentially accurate" data on Earth's energy balance, where it is less likely, in his view, that current or proposed satellites can. Trenberth has written about the Argo system which, with some other fairly new items in the data collection arsenal, constitutes a "revolutionary" change in what scientists have available for analysis. In the meantime, I think many are taking too much away from their reading of Dr. Trenberth. It seems to me he's using "missing energy" in the way particle physicists use the term, when their calculations involving the latest data prove to them, because nothing can be missing, that they're mistaken somewhere. Trenberth assessed the data available, added it up, and found what should not be able to be found if the data was complete and good, i.e., that something was "missing". He published his findings and went back to the drawing board, or computer model as it turned out. Some seem to have problems with Dr. Trenberth's way of expressing himself. Most famously is the way his "missing energy" email was seized by deniers. But James Lovelock illustrates how badly someone can misunderstand Dr. Trenberth even if wilful distortion is not the goal. See Stewart Brand's online Afterword In this Afterword, Brand quotes Lovelock telling him that after reading Trenberth's "missing energy" paper he decided that"something unknown appears to be slowing the rate of global warming", which caused Brand in his subsequent public speeches to describe a possibility that by 2050 "nothing" will have happened to Earth's climate. Further discussion of Brand's thought here Brand and Lovelock are wandering around touting the work of Garth Paltridge, specifically, this "sensible skeptic"s (Brand's words) book with its Foreword by Lord Monckton. It seems Lovelock, via Trenberth, ended up at Monckton's front door. Yow. Dr. Trenberth is clear when he talks about whether when describing things using this "missing energy" concept it means he thinks global warming has stopped - "the AGW signature is not large enough to overwhelm natural variability and so the trend from increased GHGs is only clear on time scales of 25 or more years. We used 25 years in Chapter 3 of IPCC as the lowest trend we provided that was meaningful.... So any pause in sfc T increase from 2000 to 2008 is not unexpected and the first 8 months of this year were the warmest on record and have restored the upward trend. So there is no evidence of a reduction in trend" (personal communication). P.S. There are some great graphics N.O.A.A. provides that may make it clearer to some who wonder what El Nino/La Nina a.k.a. ENSO is. Imagine we've sliced into the ocean so we can get a 3D view of its heat content at various times during the ENSO cycle:
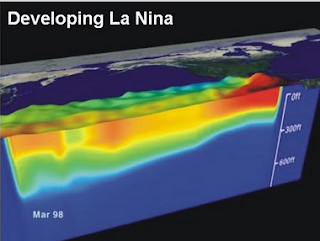
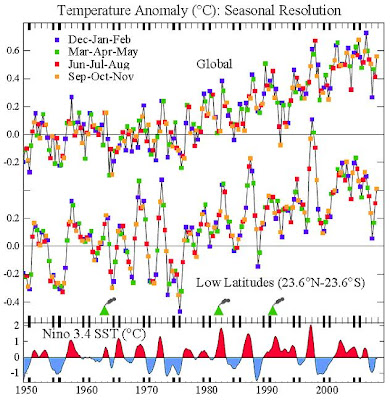
Hansen describes ENSO as heat "sloshing around" in the planetary system. As the hotter water spreads out its heat is more available for transfer into the atmosphere. When the hotter water forms a deeper pool there is less surface area for heat to come out of it into the air. Since by far most heat entering the planetary system is going into the ocean, and it sloshes around like this, it becomes more apparent how El Nino/La Nina can influence the average global surface temperature chart in the way it appears to do. Hansen's Bjerknes Lecture had a chart showing the correlation between El Nino/La Nina (depicted at the bottom of his chart) and the average global surface temperature chart depicted at the top:
 Response:
[DB] "Dr. Trenberth is clear when he talks about whether when describing things using this "missing energy" concept it means he thinks global warming has stopped"
Despite what your "personal communication" may state, Dr. Trenberth is publicly on record as stating the opposite:
"It is quite clear from the paper that I was not questioning the link between anthropogenic greenhouse gas emissions and warming, or even suggesting that recent temperatures are unusual in the context of short-term natural variability.
This paper tracks the effects of the changing Sun, how much heat went into the land, ocean, melting Arctic sea ice, melting Greenland and Antarctica, and changes in clouds, along with changes in greenhouse gases. We can track this well for 1993 to 2003, but not for 2004 to 2008. It does NOT mean that global warming is not happening, on the contrary, it suggests that we simply can't fully explain why 2008 was as cool as it was, but with an implication that warming will come back, as it has. A major La Niña was underway in 2008, since June 2009 we have gone into an El Niño and the highest sea surface temperatures on record have been recorded in July 2009."
Emphasis added.
-
BBD at 09:10 AM on 14 July 2011A Detailed Look at Renewable Baseload Energy
Some things to think about... Logistics and politics. The feasibility of very large footprint solar plant in currently inaccessible desert locations depends on both as much as it does on output projections. Construction transport infrastructure Roads - built with what and from where? (Ability of North Africa (NA) to provide without mass import?) Rail - ditto (wood and iron resource in NA?) Full energy/emissions accounting for mining, processing, import and transport of required materials to point of construction? Roads - NA requires import of a large* fleet of tractor units and flatbed carriage Rail - NA requires import of a large* rolling stock of locomotives and flatbed carriage Full energy/emissions accounting for manufacture and import? Plant construction materials Concrete and steel. Carbon villains. Vast quantities* required for vast solar plant construction. Full energy/emissions accounting for mining, processing, import and transport of required materials to point of construction? The majority will have to be imported for NA. Finally, water use - this cannot be waved away in NA Estimate vs available resource? Politics There is so much to say that it is foolish to spray questions. Here is one: Why is it appropriate for Europe to assume that it has an uncontested right to the potential solar resource in North Africa? HVDC can go South as well as North. *'Large' and 'vast' risked on SkS. How many trucks and trains and megatonnes of concrete, steel and glass do we need to build something like this? To get this:65 such blobs [50% packing factor; erratum in caption] would provide 1 billion people with 16 kWh/d per person.
16kWh/d is good, but the European average consumption is 125kWh/d. -
Doug Mackie at 09:05 AM on 14 July 2011OA not OK part 5: Reservoir dogs
@Tor B"So, adding CO2 to the atmosphere causes CO2 to get into ocean water (via a partial pressure mechanism, or something else?)".
Henry's law. Post 8."This CO2 mostly doesn't remain as CO2 but becomes ions of mostly bicarbonate (aka hydrogen carbonate) and some carbonate, all by chemical reactions with water at near-surface ocean depths (e.g., low pressure) and typical near-surface temperatures (does temperature matter much?)".
Yes, the CO2 mostly doesn't remain as CO2. Not aka hydrogen carbonate by chemical oceanographers - we already said this. Temperature is important."We know this experimentally and by measuring sea water concentrations. Do we have chemical analyses of sea water from 300 years ago or do we have vials of old water or is it determined by proxies?"
No we do not have 300 year old water. If you put a pH electrode in a solution today you are measuring pH by proxy. Different proxies are used to determine past ocean conditions. Posts 11 &12."Are deep ocean carbon increases due mostly to ocean currents or to something else?"
Something else. Post 16."How does this affect the Carbonate Concentration Depth?"
post 13"Does the carbonic acid species last long and is it what disolves sea shells?"
No. Post 14. -
Byron Smith at 09:00 AM on 14 July 2011Great Barrier Reef Part 3: Acidification, Warming, and Past Coral Survival
Thank you for this post. The point about rate of change at the end is a crucial one for nearly all ecosystems (including our agricultural ones) and is frequently misunderstood. I think more posts on this topic (why rate of change matters) would be worthwhile. -
scaddenp at 08:52 AM on 14 July 2011The Medieval Warm(ish) Period In Pictures
Eric, from your first reference: The preservation of Neolithic leather indicates permanent ice cover at that site from ca. 4900 cal. yr BP until AD 2003, implying that the ice cover was smaller in 2003 than at any time during the last 5000 years. For second, can you point me to where you see evidence that glacial retreat in MCA was further than today? And surely you are not falling for Easterbrook trick ("0" in the ice core is 1905"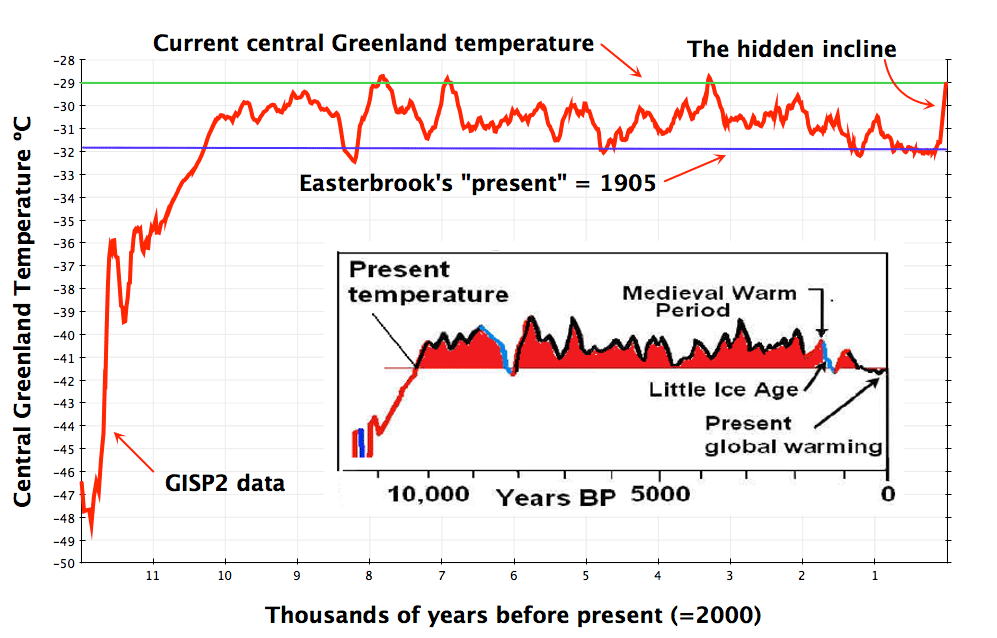 As for sealevel - to make a comparison, you have to apply GIA adjustments.
Prev 1610 1611 1612 1613 1614 1615 1616 1617 1618 1619 1620 1621 1622 1623 1624 1625 Next


