


 Arguments


Recent Comments
Prev 1613 1614 1615 1616 1617 1618 1619 1620 1621 1622 1623 1624 1625 1626 1627 1628 Next
Comments 81001 to 81050:
-
Albatross at 04:52 AM on 10 July 20112010 - 2011: Earth's most extreme weather since 1816?
Norman, And play with this too. -
Albatross at 04:50 AM on 10 July 20112010 - 2011: Earth's most extreme weather since 1816?
Norman, Play with this. -
JMurphy at 04:24 AM on 10 July 2011Websites for Watching the Arctic Sea Ice Melt
That first USS Skate photo has also been discussed at Arctic Sea-Ice Blog - Patrick Lockerby joins in there too. In fact, Neven (whose site it is) uses the picture as his avatar. Basically, it has been used by so-called skeptics, to claim that the Arctic has been ice-free lots of times in the past. I first saw it used on WUWT (no surprise there) but some of the comments on WUWT (from real sceptics, of course) about the photo show that it cannot be proven to be at the place and time often suggested, i.e. March 17, 1959. Patrick Lockerby shows that also. In fact, there is no official original for that photo - the link at NavSource.org (where the copy is held) goes to a web-hosting service called Tripod.com.Response:[DB] Also correct. The discussion begins in that thread here.
-
BBD at 04:21 AM on 10 July 2011A Detailed Look at Renewable Baseload Energy
And this is relevant how? -
Philippe Chantreau at 03:56 AM on 10 July 2011A Detailed Look at Renewable Baseload Energy
"To achieve 16TW would require 1,600,000km*2" Which, incidentally, is quite a bit less than the current global sea ice area negative anomaly. -
Bob Lacatena at 03:56 AM on 10 July 2011Websites for Watching the Arctic Sea Ice Melt
194, DB (inline), I did find this link: Nonsense On Ice. Is that the one you're talking about?Moderator Response: [DB] Yes. See also JMurphy's comment below. -
BBD at 03:52 AM on 10 July 2011A Detailed Look at Renewable Baseload Energy
No response to #211 (212). Tom Curtis #201:Using the expected efficiencies of the Andasol solar thermal power plant in Spain, the land required to generate 16 terrawatts of power is 400,000 square kilometers. The Andasol plant can generate power for 20 out of every 24 hours.
Earlier I said: Based on the standard estimate of 15W/m*2 for desert sited CSP: 10,000km*2 = 150GW 400,000km*2 = 6TW And that's assuming that there is absolutely nothing but CSP in every single one of those 400,000km*2. I should have been far clearer on the last point. Real-world plant power density is lower than assumed above. Vaclav Smil writes:Europe’s first commercial solar tower, PS (Planta Solar) 10, completed by Abengoa Solar in Sanlúcar la Mayor in 2007, is rated at 11 MWp. With annual generation of 24.3 GWh (87.5 TJ, 2.77 MW), its capacity factor is 25%. Its heliostats occupy 74,880 m2 (624 x 120 m2), and the entire site claims about 65ha; the facility’s power density is thus about 37 W/m2 factoring in the area taken up by the heliostats alone, and a bit more than 4 W/m2 if the entire area is considered. PS20 (completed in 2009) is nearly twice the size (20 MWp; 48.6 GWh or 175 TJ/year at average power of 5.55 MW and capacity factor of nearly 28%). Its mirrors occupy 150,600 m2 and hence the project’s heliostat power density is, at 36.85 W/m2, identical to that of PS10 but, with its entire site covering about 90 ha, its overall power density is higher at about 6 W/m2. Bright Source Energy’s proposed Ivanpah CSP in San Bernardino, CA should have an eventual rating of 1.3 GWp and it is expected to generate 1.08 TWh (3.88 PJ) a year and deliver on the average 123.3 MW with a capacity factor of just 9.5%. Heliostat area should be 229.6 ha and the entire site claim is 1645 ha. This implies power densities of 53.75 W/m2 for the heliostats and 7.5 W/m2 for the entire site. Again, no stunning improvements of these rates are expected any time soon and hence it is safe to conclude that optimally located CSP plants will operate with power densities of 35-55 W/m2 of their large heliostat fields and with rates no higher than 10 W/m2 of their entire site area.
So, again but with 10W/m*2: 10,000km*2 = 100GW 400,000km*2 = 4TW To achieve 16TW would require 1,600,000km*2. -
BBD at 03:45 AM on 10 July 2011A Detailed Look at Renewable Baseload Energy
Mark Harrigan #216 My doubts about renewables hitting 20% of actual generation globally are based on the underwhelming performance of wind in the UK. It is supposed to be the 'jewel in our renewables crown'. It isn't exactly shining. Back to another link posted earlier:2010 Renewables Target Missed by Large Margin The Renewable Energy Foundation (REF) today published an Information Note on the performance of the UK renewables sector in 2010 based on analysis of new DECC and Ofgem data (see www.ref.org.uk). The work shows that the 2010 target for renewable electricity has been missed by a large margin, and confirms longstanding doubts as to the feasibility of this target, and the still more ambitious target for 2020. The key findings are: • The UK failed to reach its 10% renewable electricity target for 2010, producing only 6.5% of electricity from renewable sources, in spite of a subsidy to renewable generators amounting to approximately £5 billion in the period 2002 to 2010, and £1.1 billion in 2010. • Onshore wind Load Factor in 2010 fell to 21%, as opposed to 27% in 2009, while offshore fared better declining from 30% in 2009 to 29% in 2010. • Although low wind in 2010 accounts for some part of the target shortfall, it is clear that the target would have been missed by a large margin even if wind speeds had exceeded the highest annual average in the last 10 years. • The substantial variation in annual on-shore wind farm load factors is significant for project economics, particularly Internal Rate of Return (IRR), and future cost of capital. • Planning delays do not appear to have been responsible for the missed target, with large capacities of wind farms, both on and offshore, consented but unbuilt.* • The failure to meet the 2010 target confirms doubts as to the UK’s ability to reach the 2020 EU Renewable Energy Directive target for 15% of Final Energy Consumption, a level requiring at least 30% of UK electricity to be generated from renewable sources.
It might surprise Tom but I agree with his argument about speed and the inertia of nuclear and its consequences in ppmv. But renewables cannot compete with nuclear over decades. This discussion has been had already. I am not revisiting it again. You could take the view - as I do - that TC is essentially anti-nuclear and pro-renewables. And that his argument above has a strong tactical purpose: to push nuclear off the table. However reasonable it may sound on a first reading. -
michael sweet at 03:37 AM on 10 July 2011Websites for Watching the Arctic Sea Ice Melt
Sphaerica, If you look beyond the pools you will see wide leads in the ice. These have been visible for several weeks and vary in width day to day. A sub could come up in one of the leads. Camburn: If you read the background information on the web cam page you will find out that: "In 2010, the snow became soft Jun 25, similar to many other years, but widespread meltponds formed by Jun 27, earlier than in any of the other years observed by the webcams." This year melt ponds formed earlier than in 2010 (at the end of June), although they refroze for a few days. Your claim of pond formation in May is incorrect. Please try to be more accurate in the future. According to the Barrow Sea Ice Oservatory (linked through Neven's web site), melt ponds have been observed at Barrow at the end of May. Perhaps you are confusing Barrow with the North Pole. -
Mark Harrigan at 03:35 AM on 10 July 2011A Detailed Look at Renewable Baseload Energy
@ Dana #193. Yes, I am aware of the geothermal moves in Kenya - it's great - and I'm not saying there aren't things happening. It's good to see that they are. I do take your point about other "externalities" - I am well aware (at a personal level) of the real health costs of burning fossile fuels which we all pay. It's one of the main arguments I use when comparing the real safety impacts of nuclear to coal - most people are unaware of how many deaths there are globally from burning fossil fuels. Of course we also don't dictate the price of energy either. But if we insist poorer nations must go renewables isn't that what we are doing? The trouble is the economy doesn't work on pricing externalities - except artificially. I guess what I am arguing is that while the price of low CO2 emitting electricty generation remains so much higher than Coal (and they are and will be for some time in the future) and that we in the west built our wealth on low cost coal we have no right to deny that to the world's poor. Did you read my link about solving energy poverty? It says (in part) It is also clear that using less energy is not the answer for the world's poorest. "In Uganda, less than 5 percent of the population has energy, it doesn't make sense to talk about energy efficiency," says Juan Jose Daboub , former World Bank managing director and founding CEO of the Global Adaptation Institute, an organization devoted to adapting to the challenges of climate change. In the starkest terms, energy, largely from fossil fuels, has freed humans and animals from labor by powering machines—it would take 100 human slaves to do the work of one gallon of gasoline. It is also about health: burning smoky fuels indoors shortens lives, and a lack of modern energy means a lack of electricity to power refrigerators to store life-saving vaccines. Those applications of energy are definitely ones we want to extend to the developing world, certainly more so than sharing our love of gadgets and cars. The trick will be doing it in a way that preserves people and the planet. I don't see a ready answer to that moral challenge from anything you've posted? The way I see it we must strive to develop low CO2 emissions technologies in the west whilst we also try and use less - and help the global poor out of poverty the best way we can - and if that means they choose CO2 emitting technologies who are we to deny them unless WE are willing to pay the difference? -
AL at 03:25 AM on 10 July 2011Climate Solutions by Rob Painting
Tom, Thanks for that. -
Mark Harrigan at 03:06 AM on 10 July 2011A Detailed Look at Renewable Baseload Energy
Tom and BBD above (sorry my browser is not showing the numbers) - I think your debate is throwing the spotlight on the essence of the problem. I think it's #208 above where Tom you set out a detailed expose of the issues - thanks for a very considered view - I enjoyed reading it and found it illuminating. I've not had time to pull apart all your numbers and possibly debate the details but even if I did I very much doubt it would defeat your core premise. Unfortunately I think you are right. I can foresee no realistic scenario where renewables can pick up the baton fast enough nor can I see nuclear being allowed to do so even if it could be done fast enough (that is a little debatable I think Tom but in any event moot as the politics of nuclear acceptance won't allow any conceivable fast track) Then there is also the problem of China Which Graph 5 from World Energy outlook shows only too well :( World Energy Outlook The only remaining uncertainty with AGW is how far/how fast it will happen (and therefore how long we have got). Maybe we have a little longer than we think but that is wishing for good luck. But on the counter side BBD I'm not sure why you are so vehement that there is no possibility of renewables meeting 20% in the next 5 years? In 2008 it was 18% (admittedly 15% is Hydro which won't grow so much) according to Renewable Energy Status Wikipedia quotes the 2008 figure as 3584 TWh out of 20261 TWh - close enough to 18% to make no difference I also note that year on year growth rates from Wikipedia are encouraging? 2004 2005 2006 2007 2008 2009 895 930 1020 1070 1140 1230 GWe That's a growth rate accelerating from 4% p.a. to almost 8% p.a. If we assumed that growth rate levelled out at 8% and applied from 2009 until 2016 (5 years from now) that would give a capacity of 2108GWe. The IPCC certainly seems to think it is achievable IPCC Press Release I gather forecast demand is to grow at less than 2% per year (see page 1 2nd para) World Energy Outlook That translates into roughly 24000TWh demand in 2016 and if Renewables can grow at 8% as per above that would be a little over 6,600TWh or a little over 28%. So perhaps there is room for a little more optimism? The challenge is can renewables maintain such a high growth rate year on year? And can we limit global demand to those levels given the expansion of China and India? I don't know but can only assume the IEA and IPCC aren't complete dolts and would have taken those considerations into account? -
Tom Curtis at 03:04 AM on 10 July 2011Climate Solutions by Rob Painting
AL, PaulD, throbgoblin's latest makes an appropriate observation on the interaction of personal and political: http://throbgoblins.blogspot.com/2011/07/brave-old-world.html -
AL at 02:57 AM on 10 July 2011Climate Solutions by Rob Painting
PaulD, Personal change is crucial, i agree. The point was that personal change on its own does not = political change. And only radical political change will stop the destruction. My own experience is that personal changes at best might help me survive ecocide for a time, but it will not stop ecocide. I still get up and go to work and partake daily in this culture no matter my personal choices. People have been doing the personal change thing for decades and it has not stopped the problem from getting worse, way worse. Let not kid ourselves into thinking the systems of power and the infrastructure they use are going to go away because i compost, buy locally produced foods, garden, and ride my bike. All around me are people who are only thinking about their next snowmobile and ATV, while the corporations and government are wondering where to put the nuclear plant that will power the tar sands. I could move out to the woods and totally detach myself from this culture (if i had the skill to do that :) ), but the culture would still go on its destructive path without me. DJ is not saying "no" to personal change, building communities of like minded people, and inspiring/educating others, he is saying that this is not enough. We also need to be politically active and most importantly, willing to take direct action against those who actively kill the planet. -
Tom Curtis at 02:53 AM on 10 July 2011A Detailed Look at Renewable Baseload Energy
DBDunkerson @213, that would be approximately 20% of existing generation capacity as additional renewable generating capacity. Obviously existing capacity at 2008 will not reduce emissions from 2008 levels. Of course existing capacity will not need to be replaced either, but I neglected that, and emissions from transport so to not clutter up the exposition. In the ideal case, enough additional renewable generation would be installed in the next six years to substitute for all growth in demand and eliminate an additional 10% of existing emissions. This is the case even if we only install new nuclear facilities after that point. If we fail to do that initial work we are committing ourselves to doubling the rate at which we eliminate emissions in the following decades. -
CBDunkerson at 02:46 AM on 10 July 2011Climate Solutions by Rob Painting
"Don't use a clothes dryer. All washing is dried naturally (despite the fact that we live in a very wet climate)." A good compromise here is a 'spin dryer'. These work on the same principle as the final spin cycle on a washing machine... pull the water out of the clothes via 'centripetal force'. They just spin faster and thus do a much better job. Takes just a couple of minutes and gets most clothes nearly dry. Obviously this would still use more power than just letting them air dry, but it is nothing compared to a heat dryer... and you could always abort the washing machine spin cycle to use the spin dryer exclusively and thus come out ahead on power use. -
Paul D at 02:45 AM on 10 July 2011Climate Solutions by dana1981
Mark Harrigan: "Fourth there is nowehere in the world today where renewables are able to supply reliable supply to industry at a capacity factor anywhere near fossil fuels or nuclear." Yes but industry as it stands is a product of the energy supply, not the other way around. You only perceive it to be the other way around because you have been born into a society that has been dependent on the system for many decades. FYI large scale power stations were built and then (at least in the UK) the energy companies needed consumer products that would soak up the spare capacity. Also you neglect the fact that there is capacity in modern products for them to intelligently decide whether they need energy or not based on monitoring their own requirements and on what is available from the grid at any point in time. Is this fiction? Not when one of the biggest supermarkets in the UK is installing refigeration in 200 stores that do exactly this. -
BBD at 02:38 AM on 10 July 2011A Detailed Look at Renewable Baseload Energy
CBDunkerson Are you confusing installed renewable capacity with actual output? Where are you getting the numbers from? -
Paul D at 02:35 AM on 10 July 2011Climate Solutions by dana1981
Dave123@59: "We also line dry inside in winter which humidifies the house. Attic fans instead of air conditioners where possible." This can be a problem in that condensation can attract mould. I have no idea where you live, but why is air conditioning or fans required? Dave123@59: "Self-interest....I'd be many times dead without it." How many times would you be dead without the mutual support of other human beings? I don't think your statement has a lot of credibility. -
Camburn at 02:35 AM on 10 July 2011Websites for Watching the Arctic Sea Ice Melt
The subs use sonar to look for leads in the ice. Any ice greater than 1 meter results in structural damage if they tried to surface. There is always thin ice at the poles because of the currents. The melt pools/leads shown in the photograph are a normal occurance, even in May.Moderator Response: (DB) Please substantiate your claim about thin ice always being found at the pole with a link to a credible source; I have personally seen sub logs that belie your claim. -
CBDunkerson at 02:33 AM on 10 July 2011A Detailed Look at Renewable Baseload Energy
Tom Curtis wrote: "What I do know is that any plan that does not have renewables taking over as much as 20% of total power generation capacity in the next five years makes mitigating climate change ruinously expensive." Does that factor in existing nuclear? Obviously that existing capacity doesn't have to wait 6 years to come online... and isn't causing GHG problems. If we add that existing nuclear to the renewables total, we were at 19% back in 2008 according to the 2010 IEA world energy outlook. Given the boom in renewable power generation since then we must be over 20% from non-fossil fuels already. Further, given that global renewable energy production is already more than double global nuclear energy production AND growing faster than nuclear it seems likely that any losses in nuclear generation over the next five years will be more than offset by growth in renewable generation. Indeed, the way renewables have been growing I suspect we'll see at least 25% non-fossil generation by 2015 even without any sort of significant effort by world governments. -
Paul D at 02:27 AM on 10 July 2011Climate Solutions by Rob Painting
I disagree with AL@6 personal change is a fundamental step in changing behaviour on a wider scale, including political opinions. You have to make personal changes in order to influence others. It is a part of the education process and how communities change. From personal change you can expand it to educating groups and communities. In fact taking political action without making personal change has negative outcomes and hypocritical. -
AL at 01:53 AM on 10 July 2011Climate Solutions by Rob Painting
The much discussed essay by Derrick Jensen, Forget Shorter Showers seems appropriate here. http://www.orionmagazine.org/index.php/articles/article/4801/ Personal Change does not = political change. The implications of his essay are that we need to take direct action to stop those who kill the planet, just changing our own behavior is woefully inadequate, and worse, it fulfills the delusion that we can consume our way to preventing ecocide. -
Bob Lacatena at 01:41 AM on 10 July 2011Websites for Watching the Arctic Sea Ice Melt
193, DB, I'm very surprised this would happen. I've always assumed that the melt pools are shallow and just near the surface. This implies deeper melting than that. By the way, have you ever seen the photos of the U.S. submarines that surfaced at the North Pole in the fifties and sixties? This has been a common denier tool to claim the pole has melted like this before (hah!). I've never seen an explanation of that, but I've always suspected that what looks like open water is in fact just shallow melt pools on the surface, with ice underneath that is much thicker (as well as being a rare thin area that was specifically located to be able to surface). Does anyone know the facts, or know how to find out?

 Moderator Response: (DB) There's a recent paper out quantifying the increased transmission of the sun's energy through melt pools; Patrick Lockerby did a takedown of the NP submarine denier meme on his blog some time back. Not at a PC for a while but I'll put up the links when I can.
 -
BBD at 01:36 AM on 10 July 2011A Detailed Look at Renewable Baseload Energy
Predictably, I made a mistake with the HTML above. Apologies: Returning to a link posted above:The power of raw sunshine at midday on a cloudless day is 1000W per square metre. That’s 1000 W per m2 of area oriented towards the sun, not per m2 of land area. To get the power per m2 of land area in Britain, we must make several corrections. We need to compensate for the tilt between the sun and the land, which reduces the intensity of midday sun to about 60% of its value at the equator (figure 6.1). We also lose out because it is not midday all the time. On a cloud-free day in March or September, the ratio of the average intensity to the midday intensity is about 32%. Finally, we lose power because of cloud cover. In a typical UK location the sun shines during just 34% of daylight hours. The combined effect of these three factors and the additional complication of the wobble of the seasons is that the average raw power of sunshine per square metre of south-facing roof in Britain is roughly 110 W/m2, and the average raw power of sunshine per square metre of flat ground is roughly 100 W/m2.
I appreciate that we do not all have the dubious honour of living in the UK. You can see some global figures here. It is disturbing that no-one noticed this fundamental error in the LAGI artwork. There are many evidently knowledgable commenters here. So this is suggestive of a strong confirmation bias at work. -
BBD at 01:31 AM on 10 July 2011A Detailed Look at Renewable Baseload Energy
All I am concerned that no-one here seems to understand the difference between absolute and relative solar energy. It is being routinely misrepresented. The deeply misleading LAGI solar map reposted (and so broadcast far and wide) by Treehugger is a fine example of bad science. Yes, 1000W/m*2 is the absolute figure. No we may not assume that a 15% efficient solar technology yields 150W/m*2. Returning to a link posted above:The power of raw sunshine at midday on a cloudless day is 1000W per square metre. That’s 1000 W per m2 of area oriented towards the sun, not per m2 of land area. To get the power per m2 of land area in Britain, we must make several corrections. We need to compensate for the tilt between the sun and the land, which reduces the intensity of midday sun to about 60% of its value at the equator (figure 6.1). We also lose out because it is not midday all the time. On a cloud-free day in March or September, the ratio of the average intensity to the midday intensity is about 32%. Finally, we lose power because of cloud cover. In a typical UK location the sun shines during just 34% of daylight hours. The combined effect of these three factors and the additional compli- cation of the wobble of the seasons is that the average raw power of sunshine per square metre of south-facing roof in Britain is roughly 110 W/m2,and the average raw power of sunshine per square metre of flat ground is roughly 100 W/m2. I appreciate that we do not all have the dubious honour of living in the UK. You can see some global figures here. It is disturbing that no-one noticed this fundamental error in the LAGI artwork. There are many evidently knowledgable commenters here. So this is suggestive of a strong confirmation bias at work.
-
BBD at 01:08 AM on 10 July 2011A Detailed Look at Renewable Baseload Energy
This is wildly to overstate the emissions reductions capabilities of renewables:The problem for renewables is almost as stark. Because completion times for many renewable power plants is a matter of months to a year (for smaller plants), renewables do not need to meet the target all at once. What is more, because early constructions reduce the total emissions in a given period, the deadline is extended, and with a sufficiently fast build rate, can be extended as far as 2020.
-
BBD at 01:05 AM on 10 July 2011A Detailed Look at Renewable Baseload Energy
Tom Curtis If I understand you correctly, your entire argument hinges on this:What I do know is that any plan that does not have renewables taking over as much as 20% of total power generation capacity in the next five years makes mitigating climate change ruinously expensive.
If so, we are indeed in trouble. There is absolutely no possibility that renewables will account for 20% of total electrical generation in the next five years. -
Tom Curtis at 00:57 AM on 10 July 2011A Detailed Look at Renewable Baseload Energy
There is one very simple, and very fundamental reason why nuclear power cannot by the mainstay of power generation in the near future. It is that if it is, we will have failed to meet the challenge of global warming. This can be seen very simply by looking at the carbon budget of permissible emissions on the assumption that we wish to keep the rise in temperatures below 2 degrees C. To have a reasonable prospect of doing so, we must keep total anthropogenic emissions between now and 2050 below 1,000 gigatonnes of Carbon. Given that, we can distribute emissions rights various ways, the most straightforward of which is equal per capita emissions rights between now and 2050. Allocated in this way, western nations face a sharp challenge in reducing carbon emissions: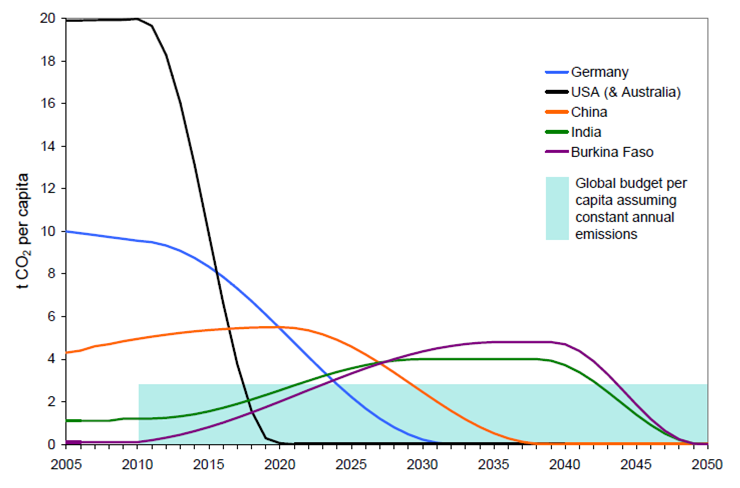 In fact, if the USA was to continue emitting at 2008 levels, in just 6 years they would consume their entire emissions budget. The problem is that nuclear power plants take approximately 6 years from inception to completion. In other words, for the US to remain inside its carbon budget using nuclear power, it must plan and construct nuclear power plants sufficient to replace all fossil fuel based power production in just simultaneously, with design and approval of all power plants to be completed by the end of this year to have any chance of meeting the 2016 completion date.
I do not say this is impossible, but it is a challenge.
The problem for renewables is almost as stark. Because completion times for many renewable power plants is a matter of months to a year (for smaller plants), renewables do not need to meet the target all at once. What is more, because early constructions reduce the total emissions in a given period, the deadline is extended, and with a sufficiently fast build rate, can be extended as far as 2020.
In fact, a plan to for zero emissions for stationary energy by 2010 in Australia (a nation facing a similar challenge) exists. It has been widely and rightly criticized as impractical, as relying on untried technology, and as underestimating difficulties and costs. Even if they have not underestimated costs, the estimated cost of 3% of GDP per annum for ten years would push Australia into a decade of negative economic growth, enough to make the plan politically impossible.
But whatever the flaws of the plan, it at least adresses the right problem:
In fact, if the USA was to continue emitting at 2008 levels, in just 6 years they would consume their entire emissions budget. The problem is that nuclear power plants take approximately 6 years from inception to completion. In other words, for the US to remain inside its carbon budget using nuclear power, it must plan and construct nuclear power plants sufficient to replace all fossil fuel based power production in just simultaneously, with design and approval of all power plants to be completed by the end of this year to have any chance of meeting the 2016 completion date.
I do not say this is impossible, but it is a challenge.
The problem for renewables is almost as stark. Because completion times for many renewable power plants is a matter of months to a year (for smaller plants), renewables do not need to meet the target all at once. What is more, because early constructions reduce the total emissions in a given period, the deadline is extended, and with a sufficiently fast build rate, can be extended as far as 2020.
In fact, a plan to for zero emissions for stationary energy by 2010 in Australia (a nation facing a similar challenge) exists. It has been widely and rightly criticized as impractical, as relying on untried technology, and as underestimating difficulties and costs. Even if they have not underestimated costs, the estimated cost of 3% of GDP per annum for ten years would push Australia into a decade of negative economic growth, enough to make the plan politically impossible.
But whatever the flaws of the plan, it at least adresses the right problem:
"The premise of a ten-year transition is based on ‘The Budget Approach’ from the German Advisory Council on Global Change. In order to have a 67% chance of keeping global warming below 2 C above pre-industrial temperatures, on a basis of equal allocation of emissions on a per-capita basis, it would be necessary for the USA to reduce emissions to zero in 10 years. Australia has about the same per-capita emissions as the USA, and would need to pursue the same goal."
Now, whatever the flaws of "Zero Carbon Australia", and they are many, their plan is certainly more feasible than replacing the entire power generating capacity of the nation with nuclear power plants in just six years. In fact, purely in political terms it is dubious that any Western nation could be persuaded to take the required effort. Persuading them to not only to go emission free, but to go nuclear at the same time is to send your folorn hope forward with neither guns nor ammunition. Being practical, there is no way the US or Australia will sign up to an agreement requiring them to end all emissions in 10 years (nor any hope of negotiating any agreement in less than three). So, perhaps we should be looking at the emissions reductions required on the assumption of an international emissions trading scheme, or (sadly more likely), on the West insisting that the third world surrender its emission rights without compensation to place everybody on a "level footing": As you can see, the longer we wait for peak emissions, the faster emissions must be reduced thereafter. If emissions peak in the next year or so, we are committed to replacing around 4% of stationary power generation with emissions free equivalents per annum. If they peak in five years time, that rises to 5.3%; in ten years in rises to nearly 10% replacement per annum. Again, and obviously, the speed at which we can start reducing emissions then becomes the critical decider of the practicality of a plan. Reliance on nukes means reductions to do seriously begin for from six to 8 years. IN contrast, renewables can begin reductions now. Consequently the commitment to a primarily nuclear emissions reduction program is a commitment to (probably) unsustainably high economic costs. In contrast, a program based on an initial renewables based reduction to turn the curve down as soon as possible greatly reduces the overall economic impact of the plan.
It is perfectly possible that the best plan will involve, in the end, the majority of the worlds power being provided by nuclear power plants. That is something which I think can be argued. It is also something I do not need an opinion on. What I do know is that any plan that does not have renewables taking over as much as 20% of total power generation capacity in the next five years makes mitigating climate change ruinously expensive. It is possible that a 100% renewable economy could be achieved in 40 years. But the only way a near 100% nuclear economy can be achieved in the same time scale is by committing ourselves to 3 or 4 degrees of warming.
As you can see, the longer we wait for peak emissions, the faster emissions must be reduced thereafter. If emissions peak in the next year or so, we are committed to replacing around 4% of stationary power generation with emissions free equivalents per annum. If they peak in five years time, that rises to 5.3%; in ten years in rises to nearly 10% replacement per annum. Again, and obviously, the speed at which we can start reducing emissions then becomes the critical decider of the practicality of a plan. Reliance on nukes means reductions to do seriously begin for from six to 8 years. IN contrast, renewables can begin reductions now. Consequently the commitment to a primarily nuclear emissions reduction program is a commitment to (probably) unsustainably high economic costs. In contrast, a program based on an initial renewables based reduction to turn the curve down as soon as possible greatly reduces the overall economic impact of the plan.
It is perfectly possible that the best plan will involve, in the end, the majority of the worlds power being provided by nuclear power plants. That is something which I think can be argued. It is also something I do not need an opinion on. What I do know is that any plan that does not have renewables taking over as much as 20% of total power generation capacity in the next five years makes mitigating climate change ruinously expensive. It is possible that a 100% renewable economy could be achieved in 40 years. But the only way a near 100% nuclear economy can be achieved in the same time scale is by committing ourselves to 3 or 4 degrees of warming.
-
BBD at 00:45 AM on 10 July 2011A Detailed Look at Renewable Baseload Energy
Tom Curtis #202 This is an attempt at humour, isn't it? -
Mark Harrigan at 00:44 AM on 10 July 2011A Detailed Look at Renewable Baseload Energy
Hi Tom @ #204 (I think - numbers not showing on my browser alas) My point, which I don't think you've answered - is that what you quote cannot be achieved reliably throughout the year - but only for around 3/4 or thereabouts. If you can point to evidence that refutes this I will be very pleased to see it - really. Perhpas you can provide a link? The % you quote are irrelevant I think - what will make CST a success is when it can supply at a reasonable capacity factor 24/7/365. I have seen no evidence that it is close to that yet - although I do note that it continues to improve and shows great promise. So I do call it boosterism when we point out the positives of renewables without acknowledging the deficiencies. I think it hurts the case rather than supports it. -
Mark Harrigan at 00:37 AM on 10 July 2011German Energy Priorities
Hi Moderator - I don;t think it's my browser - I;ve done a complete refresh and also deleted all history and the issue I describe avove is still the case? Does anyone else see it? -
BBD at 00:32 AM on 10 July 2011A Detailed Look at Renewable Baseload Energy
Tom Curtis #201 You say:Using the expected efficiencies of the Andasol solar thermal power plant in Spain, the land required to generate 16 terrawatts of power is 400,000 square kilometers. The Andasol plant can generate power for 20 out of every 24 hours.
Based on the standard estimate of 15W/m*2 for desert sited CSP: 10,000km*2 = 150GW 400,000km*2 = 6TW And that's assuming that there is absolutely nothing but CSP in every single one of those 400,000km*2. Less than half way there. -
Mark-US at 23:55 PM on 9 July 2011Climate Solutions by Rob Painting
Sounds like living ones values! That's great. Here's one of many other ideas.... cooperative buyers' clubs for bulk/whole foods, if there's a distributor in your area that will do business with you. In my old city we had a group that bought at wholesale prices just like the storefront businesses, except the group had to order in large volumes and that required several families' commitment. But that was ok, because what family really needs 25 lbs of kidney beans at one time? The catalogue was available in spreadsheet format, so the group had an "order night" that was a mass negotiation, as families signed up for portions of the large bags, until we had rounded out an order, and folks paid the treasurer up front, who then placed the order. On delivery day volunteers broke up the bundles according to the order sheet. Takes a bit of time, but greatly reduced packaging and shipping costs of smaller quantities, really stretched the grocery dollar, and built great community (as did the semi monthly coop potlucks). ................. As for being off the grid, I too like the emotional appeal, but I think I've seen articles saying you get more anti-globalwarming bang for buck by being plugged in, because end-user generation can (A) help with grid stabilization and (B) preventing transmission losses due to voltage drop. I probably have that wrong. -
Tom Curtis at 23:50 PM on 9 July 2011A Detailed Look at Renewable Baseload Energy
Mark Harrigan @203, on the contrary, the figures I used for Andasol where based on the Forecast gross electricity volume. That represents just 40% of the plant's rated capacity, which in turn is just 40% of incident sunlight (annual direct standard radiation * solar field area). Why you should consider an expected efficiency of around 15%, and figures 30% more conservative than those quoted by BBD as "renewable boosterism" I do not know. It suggests that any figures quoted that do not prove that renewables cannot do the job will be rejected by you as "renewables boosterism". -
Daniel Bailey at 23:44 PM on 9 July 2011Websites for Watching the Arctic Sea Ice Melt
Meltcam #1 seems to have passed perihelion and is already heading towards The Door of Night:
-
Mark Harrigan at 23:22 PM on 9 July 2011A Detailed Look at Renewable Baseload Energy
@ Tom #201 With due respect Tom your comments on Andasol amount to renewables boosterism. The Andasol plant can only achieve those sorts of figures for a around 2/3 to 3/4 of the year. That's not enough. When we share such data we really should point out the limitations too. Mind you - the developments in CST remain very promising as they continue to improve their ability to deliver reliable power. I'd like to see a plant implemented in Australia - of at least 50MW capacity - but don't know what the capital cost might be or if there are any plans. Perhpas the proposed investment fund associated with our proposed carbon tax might bring such an experiment closer to reality -
Eric (skeptic) at 23:04 PM on 9 July 2011Climate Solutions by Rob Painting
I like the environmental initiative (item 1) and would also suggest to those with some room that they can create both a native forest area and a native savannah. Also you said you are in a moist area, but those of us in drier areas can capture our runoff, keep some in permanent pools for the wildlife and recharge the groundwater with the rest (also mitigate the harm from excessive rainfall). The drier versus dryer is an easy choice for me, air dried laundry is the only way to go in my climate. As for being on or off the grid: I can appreciate the desire to be off the "stupid" grid. But we have any potential of using "excess' power productively, or supply extra power ourselves, then we should be on the smart grid. -
Mark Harrigan at 23:00 PM on 9 July 2011German Energy Priorities
Thanks Dana for your clarification of your views. But what evidence do you have that renewables can do the job now? The very fact that they must use coal to replace nuclear is ample proof, I think, that they cannot do the job today? -
Mark Harrigan at 22:58 PM on 9 July 2011German Energy Priorities
To moderator - no I mean that the numbering of the psost seems all out of whack. Ever since #29 they are all nubered as #1. This is not the case on other threads?Response:[DB] This comment is currently listed as number 42 on this thread. Perhaps a forced refresh of your browser is in order (if using Firefox, hold down the left shift key and hit the refresh button).
-
Mark Harrigan at 22:26 PM on 9 July 2011Climate Solutions by dana1981
To Actually thoughtful @ 54 Good moniker because I can see that you are! But with due respect your anecdotal experience isn't the issue. Although I do applaud your personal efforts and its something we can all do, it's not enough. I can relate some things I have done too and what we do as individuals IS important - and of course that was the challenge of this thread and it's good to see what actions people are taking at an individual level - it can all add up. But I completely reject your description of "stealth denialism". I do not deny that we need to increase our use of renewables - or that we ought to be trying as much as we can to do so. But I do argue that the unrealistic proseltysing of renewables as being already able to solve the problem flies in the face of the evidence and is itself a damaging form of denilaism that actually impedes progress. There are some realities we need to deal with First is that personal/domestic consumption of elctricity is (a) less than 1/3 of the total (at least in Australia its less than 28%) and (b) is frankly a lot more amenable to changes in usage patterns Second the reality for industry is a LOT different. They are far more dependent on reliable supply 24/7 and this is where the economic impact lies. Third is that the cost renewables remains stubbornly high Fourth there is nowehere in the world today where renewables are able to supply reliable supply to industry at a capacity factor anywhere near fossil fuels or nuclear. This is why wind and solar often need CO2 producing backup to make them reliable which adds to the cost and the emissions. The Diesendorf plan (on another thread) is an attempt to address this but it is as yet unproven So I dispute your comment that I am in denial about renewables - in fact I claim that those who proselytise that renewables can provide a very high percentage of the answer are in denial of the evidence and also guilty of environmental vanfalism and imposing unreasonable high costs on the world's poor. That doesn't mean I am against action - far from it - but I want to see realistic test proposals put forwards to advance the cause of renewables. For example - in 2009 Australia renewables accounted for less than 7% of generation. It would require an annual growth rate of 10% year on year to get that to 20% in 2020. In would take that growth rate till 2037 to get to 100%. yet many think we should be there before then Quite frankly that is unrealistic. For a start most investment horizons are at least 10 years - so we need to KNOW that this was possible around 15 years from now. Also 10% compound growth is virtually an impossibility (early years are probably easier but later years are MUCH harder). Instead of unrealistic plans based on wishful thinking to get us to 100% renewables in short order I want to see much more realistic approaches. I hope this site continues to be a place where this can be debated - I know it's orginal intention was to bebunk the AGW deniers - and that still needs doing - but the focus of the debate needs to be on what to do now - and wishful thinking is not enough -
quokka at 21:26 PM on 9 July 2011Climate Solutions by dana1981
#50 Marcus Areva and Toshiba have just recently been invited to present bids for another nuclear power plant for Finland, so it seems that Finland does not consider they have made a mistake in committing to expanding their nuclear capacity. Nuclear builders place their bids The most recent cost estimate that I can find for the total project cost for Olkiluoto 3 is EUR 6.4 billion. That is about EUR 3.88 per GWe or USD 5.55 per GWe at current exchange rate. You state that the cost of wind is EUR 2 billion per GWe which seems a reasonable ball park figure, and may even be a little high. But you fail to state that the capacity factor is likely to be around 30% for wind compared to 90+% for the EPR. It seems that a first of a kind nuclear power plant with big cost overruns is still cheaper than many of a kind wind. The NPP generates reliable base load electricity. Large first of a kind projects are almost always more expensive for a host of reasons; lessons are learned and project costs drop in subsequent builds. The UK Royal Academy of Engineering in conjunction with the Institution of Civil Engineers and other professional bodies has produced a report Engineering the Future: Nuclear Lessons Learned which details many of the issues and reviews a number of current nuclear projects including Olkiluoto 3 and the other EPR projects in France and China. The Chinese EPR projects, which have commenced later, have benefited from lessons learned and seem to be on schedule. It is a very interesting report. The newest nuclear power plant in South Korea: Shin Kori 1 took just four years to build from first concrete to grid connection with a further six months commissioning. The benefits of standardized design and several of a kind are substantial. We need to look at all of the evidence. -
Paul D at 21:04 PM on 9 July 2011Climate Solutions by Rob Painting
AFAIK all the products I have come across in the UK list palm oil as an ingredient if it is in the product, although toiletries will probably say something like 'sodium palmate' or similar. Can be difficult to avoid it unless you look carefully, not many mainstream products use alternatives. Some soaps from 'green' retailers use olive oil. -
Ed Davies at 20:31 PM on 9 July 2011Climate Solutions by Rob Painting
All good things, well done. However, for most domestic situations the greatest use of carbon is for heating or cooling. I'm not really familiar with the New Zealand climate but imagine this is true for heating on the South Island but maybe only for cooling in particularly badly designed houses in the north. New Zealanders do have a reputation for neither insulating nor heating their houses (which sort of cancel out) but still it's probably the most important area to address. I agree that individual action is not enough. You mention long term aspirations to be off the grid. I have the same ideas in the shorter term while being fully aware that off-grid is far from the optimal means of have a low-carbon comfortable life. It is, however, about the best option for somebody who finds themselves in a society which doesn't seem interested in taking carbon emission reduction at all seriously. Unless there's a major change in society's approach anything we do individually will not be much more than a symbolic gesture but it doesn't follow that it's not a gesture worth making. -
Dave123 at 20:18 PM on 9 July 2011Climate Solutions by dana1981
@ mike at 31 You might want to read Forster's response at the bottom of the long list of comments. You'll find it very educational. -
Dave123 at 19:59 PM on 9 July 2011Climate Solutions by dana1981
We just switched washer and dryer to more modern, energy efficient and water minimizing devices. We also line dry inside in winter which humidifies the house. Attic fans instead of air conditioners where possible. But we'll never be deep greens, and I'm concerned that a lot of infrastructure that we depend on, from computers to medical technology requires not getting too green. Just as there are tipping points in climate, there are tipping points in the global economy/economic/technology ecosystem. We built it on fossil fuels, easily available iron, water. It's not likely to be rebuilt after a collapse or a walk-away...your view may vary both on that prediction and whether you want to keep it. I do. Self-interest....I'd be many times dead without it. -
CBDunkerson at 19:04 PM on 9 July 2011Climate Solutions by dana1981
RE #51, actually I was talking about the specific 'electric only' mode in the 2009 and later models (EV button). In that mode you can accelerate much faster on electric power, but if you hit 26 mph the gasoline engine kicks on. Alternatively, in 'normal' mode you can be careful to accelerate slowly and get up to 40 mph on a flat roadway without using gas. It's just alot easier to do, with alot more acceleration flexibility, in EV mode... until you hit 26 mph. -
adelady at 18:14 PM on 9 July 2011Climate Solutions by Rob Painting
Thank you, thank you, thank, you. Yes, Yes, Yes. No palm oil ... evah. And cap'n'trade ... boo, hiss. Anyone who's just lived through the latest economic shemozzle wrought by the mysterious machinations of the all-knowing, all-powerful markets must at least think twice before handing control over yet another money-spinner into the far-too-willing hands of traders. If anyone thinks that carbon is the basic essential for life, they should have a long, hard look at the way the markets in food staples 'work' when times are tough. It's not pretty. -
Marcus at 18:01 PM on 9 July 2011Climate Solutions by dana1981
I don't drive at all. I use the train & buses to get around (our trains are currently diesel, though they're going to be electrified within the next couple of years, & our buses all run on natural gas). I'm on a 100% Green Energy scheme, but only use around 5kw-h of electricity per day due to a variety of energy efficiency measures I've put in place over the years. -
Marcus at 17:57 PM on 9 July 2011Climate Solutions by dana1981
Quokka mentions the Finnish experience in Nuclear power-probably not wise given that there most recent foray into nuclear energy is turning into a debacle. The 1600MW power station was started in 2003 & supposed to be completed by 2009. It is now not expected to go online until either the end of 2013 or the start of 2014-with each additional year of delay adding EU$1 billion to the fixed price of EU$3 billion price tag. So by the time it goes online-almost 5 years behind schedule (assuming there aren't further delays) then it will have a final price tag of around EU$8 billion-or around EU$5 million per MW of installed capacity. For a price of less than EU$2 million per MW, they could have installed around 800MW of Wind Turbines by now. What is particularly funny is that Nuclear Power is running into these kinds of issues in spite of being a *mature* technology-one which has enjoyed hundreds of billions of dollars in Government subsidies over the decades-much like fossil fuels.
Prev 1613 1614 1615 1616 1617 1618 1619 1620 1621 1622 1623 1624 1625 1626 1627 1628 Next


