


 Arguments


Recent Comments
Prev 1623 1624 1625 1626 1627 1628 1629 1630 1631 1632 1633 1634 1635 1636 1637 1638 Next
Comments 81501 to 81550:
-
BBD at 06:38 AM on 8 July 2011A Detailed Look at Renewable Baseload Energy
dana1981 Where did I say you weren't? Baffled ;-) I'd be interested in your response to the comment though. -
Eric the Red at 06:34 AM on 8 July 2011Lessons from Past Climate Predictions: Syun-Ichi Akasofu
wingding. If he was using the GISTEMP met stations only, the 5-year moving average in 2000 was +0.55C. Akasofu's graph in Figure 5 above only shows a temperature anomaly of ~0.45. The GISTEMP 5-year moving average did reach 0.7 in 2003, and has remained there since. Two claims could be made: 1) Akasofu has underpredicted temperatures by 0.15C during the last 8 years, or 2) he misjudged the temperature peak by 3 years. Either way, it is still way too early to conclude that is 100-year prediction is wrong. -
BBD at 06:23 AM on 8 July 2011A Detailed Look at Renewable Baseload Energy
dana1981 The externalities of coal are not in dispute. Nuclear can displace coal from the global energy mix. That is not in dispute. The question is whether renewables can displace coal from the global energy mix as fast or faster than nuclear. So far, the evidence does not convince.Response:[dana1981] I'm allowed to respond to other people's comments too, you know!
-
mspelto at 05:42 AM on 8 July 2011Climate Solutions by dana1981
Oh and professionally working on glaciers we backpack everything in, no helicopter support, generators etc. 2009 field season video-slideshow -
mspelto at 05:39 AM on 8 July 2011Climate Solutions by dana1981
I have a Prius which is only crowded on longer trips with four people. I refuse to use anything but a rake and a shovel for the plentiful leaves and snow here in New England. Car pooling once a week to work as well. -
Albatross at 05:26 AM on 8 July 20112010 - 2011: Earth's most extreme weather since 1816?
Eric @301, Just to be sure, my comment at 302 was directed at your name's sake, Eric Red. -
Albatross at 05:24 AM on 8 July 20112010 - 2011: Earth's most extreme weather since 1816?
Oh and Eric, Maybe you can help Norman identify the two myths in the Wikipedia article on hail at #287. -
Eric (skeptic) at 05:20 AM on 8 July 20112010 - 2011: Earth's most extreme weather since 1816?
Thanks Albatross for the feedback on Xie. Rest assured that I do not get any papers from the denialsphere or especially "the list". On the contrary, if a paper is on "the list" I will look for a different one. I agree with the basic thrust of your comments, particularly that this is an academic look at hail and got a few things wrong about the real phenomenon. Also, like the paper in 290, does not address severe versus ordinary hail. -
wingding at 05:14 AM on 8 July 2011Lessons from Past Climate Predictions: Syun-Ichi Akasofu
In fact the GISTEMP met stations only anomaly for 2010 was 0.83C. If Akasofu had plotted that it would be above the top end of the IPCC projection curve on his graph. -
wingding at 05:10 AM on 8 July 2011Lessons from Past Climate Predictions: Syun-Ichi Akasofu
Re 26: Akasufo's graph uses GISTEMP met stations only, which is currently at about 0.7C -
Albatross at 05:08 AM on 8 July 20112010 - 2011: Earth's most extreme weather since 1816?
Re "This is precisely as pointed out previously when the maximum gradient between warm and cold air occurs." No, not always. You and others, once again, insist on making sweeping and gross generalizations when severe thunderstorms are very much about the details. And Re #299, This is such a site, pity you fail to recognize that. But as you volunteered on another thread, you are not particularly interested in the importance of physics. So I find your hyperbole and innuendo uncalled for, it only goes to show the weakness of your alleged 'arguments'. -
Eric the Red at 04:40 AM on 8 July 20112010 - 2011: Earth's most extreme weather since 1816?
Yes Albatross, As you notice the peak for severe storms in the northern U.S. is June. Hence, the peak in Canada occurs in July. This is precisely as pointed out previously when the maximum gradient between warm and cold air occurs. Thanks for comfirming our posts. -
Jedi at 04:40 AM on 8 July 2011An Interactive History of Climate Science
Based on a quick perusal of some of the 'skeptic' papers from just one year (2010) I found that 4 of the 6 papers I actually read (out of 27, I'm busy today) were *NOT* skeptic papers. In fact, in these papers the authors were in general looking at local climatological patterns, and short temporal scales, and in most cases implicitly or explicitly taking climate change into account. This is a small sample, but based on it I'm somewhat dubious about the proper classification of a sizable fraction of the papers in these sets. -
Albatross at 04:03 AM on 8 July 2011Climate Solutions by dana1981
Hi Dana and CBDunkerson, We love our 2005 Prius (so we do not have the electric only option)...we too are hoping that our next car will be an EV. Maybe I'll have a mid-life crisis and buy a Leaf or Volt ;) Seriously though, looking forward to buying either a plug-in or full EV next time round. We typically get 5.3 L/100 km in the city and highway combined, have had 4.8 L/100 km before. Winter is brutal though 6.5-7.5 L/100 km, but not bad considering the extreme cold. Ironically it is a car that loves to be driven, the more you drive it, especially in cold weather, the better the fuel consumption. Probably why so many cab drivers are now using them, and hybrids in general. -
John Hartz at 04:02 AM on 8 July 2011Climate Solutions by dana1981
Treehugger is an excellent source of continuous information about the sustainability issues raised by Dana in his informative essay. -
dana1981 at 03:46 AM on 8 July 2011Climate Solutions by dana1981
CBD - thanks, though 50 mpg is just a ballpark. Usually it's a tad bit lower, but close enough. I'm hoping my next vehicle will be fully electric, or at least a plug-in hybrid. -
CBDunkerson at 03:43 AM on 8 July 2011Climate Solutions by dana1981
Hey dana. Nice writeup. Maintaining 50 mpg with the Prius is pretty impressive, I usually come out around 48... though given my lead foot that actually isn't too bad. I keep wishing that they had a way to set an 'acceleration control' (kinda like 'cruise control') such that you don't exceed 50 mpg unless you push the gas pedal past a cutoff point. I think that and increasing the electric only top speed to 30 mph (currently 25) would make a huge difference... currently when trying to stay on electric power in 25 mph residential zones I'm always winding up annoying the people behind me because I'm at 22 or hitting 26 for a second and having the gas engine kick on. Of course, plug-ins will probably make the Prius seem like a gas hog before too much longer. The Leaf and Volt already do that for people whose daily drive is short, but the next generation of these kinds of cars should see longer ranges and lower prices. -
dana1981 at 02:45 AM on 8 July 2011A Detailed Look at Renewable Baseload Energy
Mark #173 - you have to keep in mind that fossil fuels are currently artificially cheap, and their true cost is actually higher than most renewable energy sources. We may not pay that high cost in market energy prices, but we pay it elsewhere, and so would developing nations which chose to install artificially cheap coal power. -
dana1981 at 02:34 AM on 8 July 2011Climate Solutions by dana1981
Mark H - 80-90% of a vehicle's lifetime energy use comes during operation, so the fact that the Prius is slightly worse during the ~5% which vehicle production accounts for makes little difference in lifecycle emissions. Your claims about solar PV are out of date. This is not the place to talk about nuclear power. Your claims that renewables 'can't fill the gap' are also incorrect. We are in agreement about a carbon price, however. -
Albatross at 02:23 AM on 8 July 20112010 - 2011: Earth's most extreme weather since 1816?
Tom @289, I'll reply later if you don't mind. -
Albatross at 02:22 AM on 8 July 20112010 - 2011: Earth's most extreme weather since 1816?
Interesting that Xie et al. (2008) paper cited by a 'skeptic' at #293 was loudly trumpeted over the denialosphere and is in the discredited NIPCC report. Here are the findings from another study by Xie et al. (2010): "The climatology and long-term trend of hail size in four regions of China are documented for the period of 1980–2005 using the maximum hail diameter (MHD) data obtained from the Meteorological Administrations of Xinjiang Uygur Autonomous Region (XUAR), the Inner Mongolia Autonomous Region (IMAR), Guizhou Province, and Hebei Province. The reported MHD is mainly around 10 mm in the four regions. Guizhou (in southwestern China) has the largest proportion of severe hail (MHD greater than 15 mm) among the four regions. Severe hail in southwestern China mainly occurs between February and June, while in northern China it occurs in summer (from May to August) with the peak in June. During the period studied, the size of severe hail shows a slight downtrend in Guizhou and IMAR, whereas it shows an uptrend and a flat trend in Hebei and XUAR, respectively. However, none of the trends is statistically significant. Results from sensitivity experiments using a one-dimensional numerical model show that hail size is sensitive to the freezing level height, the maximum updraft, and column cloud liquid water—all working together to determine the geographic distribution and long-term trend of the observed hail size in China." I'd be interested to know what the 1D model is that they used. -
Mark Harrigan at 02:13 AM on 8 July 2011A Detailed Look at Renewable Baseload Energy
Ouch - obviously the practical realities in Germany mean that the denial of nuclear and the as yet "not ready" renewables means more fossil fuels German Emissions to increase Unfortunately reality mugs wishful thinking again? This is why we need a carbon price - because it's just so hard to know just exactly what is the "right" choice when trying to reduce CO2 emissions - other than NOT using energy. So, in the west - it's just gotta be less :(Response:[dana1981] Please move any discussion about German energy to German Energy Priorities
-
Mark Harrigan at 02:09 AM on 8 July 2011Climate Solutions by dana1981
I commend you for using a Prius - I guess?? Is Prius Green? You use of a solar panel has it's issues too - the high subsidy on Solar PV makes it one of THE most expensive ways to abate CO2. Our refusal to countenance nuclear also has it's costs German Nuclear windback will increase emissions Nuclear actually has extremely low risk (chance of going wrong) but apparently unmanageable hazard (impact when something does go wrong) - and while new tech nuclear is probably a lot safer there's no escaping the issue of fallible management (avoiding accountability and transparency) compounding the risk/hazard equation (like we saw in Japan). There are NO reliable renewable technolgoies currently available that will fill the gap - though CST has promise it's got a long way to go. This is why we need a carbon price - becuase it's just so hard to know just exactly what is the "right" choice when trying to reduce CO2 emissions - especially when there really isn't a right choice! - other than NOT using energy. So in the west - it's gotta be use less!Response:[DB] Please move any discussion about German energy to the German Energy Priorities thread.
-
Albatross at 01:57 AM on 8 July 20112010 - 2011: Earth's most extreme weather since 1816?
For crying out loud guys, this repeated focus on the traditional paradigm of "tornadoes are caused when cold air from Canada meets warm air from the south" has been addressed before. Has it ever occurred to you that the storms are following the heat (and jet stream) as the warming progresses northwards as the seasons change? On the Canadian prairies, for example, the severe storm season peaks in July when baroclinicity is at an ebb and cold Arctic air is in short supply. -
Albatross at 01:50 AM on 8 July 20112010 - 2011: Earth's most extreme weather since 1816?
EricS @293, You have not accurately represented the findings of the Xie et al. paper that you found-- particularly with respect to the role of vertical wind shear (interestingly, the authors do not appear to understand the role of the shear, thinking that it is involved with the triggering of storms rather than the organization of the storms, not sure how the reviewers missed that), and the possible causes for the decline in the number of hail days. Whenever a 'skeptic' cites a paper, especially when they do not use quotes, always go to the original (H/T to Peter Hadfield). With regards to the decline of hail days in this region, the authors state that: "....the vertical shear seems not to have played a dominant role in the observed down trend in hail frequency in China since a similar weakening trend in the annual mean vertical shear is found for the stations with and without down AHD trends. The long-term change in CAPE seems to have little correlation with the down trend in hail frequency, however. We considered that although the CAPE increased in the past, the annual mean precipitation and extreme precipitation events in north and northeast of China decreased as a result of the weakening of the East-Asian summer monsoon [Wang and Zhou, 2005], leading to a decreasing trend in hail frequency in these regions. On the other hand, the rising in freezing-level and the increase in aerosols may offset or even dominate the positive effect of CAPE, resulting in little trend in hail frequency in south China. The results from this study may imply a possible reduction of hail occurrence under the global warming due to the increase in freezing-level height in China." Not quite as simple as your post claimed, and a few untested hypotheses as well. Also, as they authors noted, the huge increase in aerosols in the region over recent decades complicates matters even further. Finally, the paper speaks only to the occurrence of hail days, not severe hail days. I need to give it a proper read before commenting further though. -
Eric the Red at 01:34 AM on 8 July 20112010 - 2011: Earth's most extreme weather since 1816?
Tom, That is precisely why more severe weather occurs in the spring. The warm, moist gulf air collides with the cold, dry air from the Rockies. This sets up the potential for supercell formation. Severe weather typically occurs in March in the deep south, and gradually works north through June. The potential stills exists for extreme weather later in summer, but is greatest in spring. Global warming would increase the warm, moist air component, but decrease the cold, dry air. The net result is probably more rain, but less severe storms. -
Chris G at 01:14 AM on 8 July 2011The Last Interglacial Part Two - Why was it so warm?
Hmm, that is not the only thing going on. The earth will spend more time near aphelion than near perihelion. So, the delta from the mean for both hemispheres will be greater on the aphelion side. Ah, so, not only will the hemisphere with the lower heat capacity (NH) show a greater variation than the other in general, but under current orbital parameters, that same hemisphere will spend more time in the greater W/m^2 orientation than the other. It is not at all surprising that the temperature graph looks the way it does, but that still does not mean that TSI has no effect. -
Mark Harrigan at 01:08 AM on 8 July 2011A Detailed Look at Renewable Baseload Energy
Thanks BDD for your comments #172 But I just try and point to where I think the evidence and data lead. I try to avoid any sort of ideological advocacy. I wish renewables were more effective and lower cost than they are. So then the challenge for us all is not to simply pretend these problems don't exist (and I agree too many advocates of renewables fall into this trap) but also not to simply point them out and leave it at that. We must apply our thinking to how do we solve the problems since continued increasing CO2 emissions are unacceptable and nuclear, whatever it's benefits, is simply politically unacceptable Along the way we have to solve the problem of energy poverty This article articulates that well Solving Energy Poverty When around 25-30% of the world's population have NO electricity at all it is morally repugnant for us in the west to presume we can force high cost solutions on those who do not enjoy the benefits of a high energy high wealth economy (and let's face it wealth and energy correlate). It's an ugly truth at the moment that fossil fuels, because they do not currently have to carry the real cost of the damage they cause to the climate, are by far the cheapest way to provide energy. Which is why no matter what we in the west do we will see India and China dramatically increase their overall emissions (even though I applaud them for making great efforts to reduce their per capita and per unit of GDP emissions to be much lower than we in the West produced as we created our wealth.) I think the demonstration city China is creating might be a very useful experiment China Green City. Certainly worth watching. I wonder if Mr Diesendorf has tried to talk to them about implementing a test of his proposal? It will also be very interesting in this country to see what happens after Sunday's announcement of what Australia's Carbon Tax system will look like - not doubt a vigorous debate will take place about the impacts and what actions might ensue. -
Chris G at 00:51 AM on 8 July 2011The Last Interglacial Part Two - Why was it so warm?
TIS, You are failing to make the proper connections between energy (TSI is measured in energy) and the temperature of matter. There is not a uniform relationship between energy and temperature; different forms of matter require different amounts of energy to achieve the same change in temperature. There most certainly is a relationship between energy and temperature, but you are treating all matter the same and it is not. It takes more energy to cause the areas covered by water to change 1 K than it does to change the areas were land is exposed. What you keep pointing out with the yearly temperature plot is that there is more land area in the NH than there is in the SH. Yeah, so? You are saying that because oceans have a have a higher heat capacity, variations in TSI have no effect. I'm saying that graph you have linked includes effects of both higher heat capacity and TSI, (plus others as well) and clearly the differences in heat capacity dominate, but that does not mean the TSI has no effect. It isn't a 'one thing or the other' situation, and you are saying that it is. Maybe the reason that the NH curve goes 7 K above the mean in the summer, but only 6 K below the mean in the winter is partly to do with the earth receiving more TSI in the NH winter. -
adelady at 23:46 PM on 7 July 2011Great Barrier Reef Part 2: Climate Change Impacts
Paul "...digitising Royal Navy log books and extracting weather and climate data:" All of us who take an interest should put in some time on one of the several digitising projects. Speaking for myself I hate the logbooks, but the various weather stations data is pretty straightforward to read and enter. Just 15 minutes a day from a lot more people will get the historical data ready for more interesting work. (Shame they didn't record this kind of exceptional event, but we can't have everything.) -
adelady at 23:40 PM on 7 July 2011Great Barrier Reef Part 2: Climate Change Impacts
Tom "...many areas including most of the Great Barrier Reef were not frequented by ships until the late 19th century." Maybe not by British ships, but foreign based whaling ships operated around the GBR at various times from late 18th to 19th centuries. And travel between settlements would have been by sea as often in Queensland as it was for the rest of the country. Regular sailors would have observed anything a bit odd. Newspaper worthy if not formal logbook entries. Does anyone know if there are any indigenous reports of noteworthy events in the various areas of the reef before settlement? I'd be very surprised if people who knew the area well enough to know when to expect turtles and other desirable marine food items (or dangerous weather) to turn up didn't have stories about 'when the reef went strange' if it had been observed. -
Rob Painting at 23:30 PM on 7 July 2011Great Barrier Reef Part 2: Climate Change Impacts
DLB - "Looking at Fig. 5 (coral sea summer temp anomalies) for 1998 and 2002 were 0.4C and 0.3C warmer than the long term average. In most of the subsequent years SSTs have been well above 0.4C but I have not heard of any wide spread bleaching events during these other years?" Coral bleaching often begins when sea surface temperatures are 1-3°C above the normal summer maximum. So we wouldn't expect bleaching under those conditions. -
Rob Painting at 23:23 PM on 7 July 2011Global warming stopped in
1998,1995,2002,2007,2010, ????
No worries Papy. I'm just finishing up a post on Kaufmann 2011 - let's say my take is a bit different. -
Papy at 23:15 PM on 7 July 2011Global warming stopped in
1998,1995,2002,2007,2010, ????
I agree and I don't contest its interest, but the presentation (title/abstract) of the study sounds like a communication deal to me, like if they were perfectly aware of their decadal flaw (part of the answer about this apparent stagnation is in the question), but made this deliberated choice to promote their work... and some media titles confirm this feeling : "Chinese coal pollution halted global warming !". Thanks for your answer anyway. -
les at 23:13 PM on 7 July 2011Climategate CRU emails suggest conspiracy
60 CBDunkerson ;) -
Tom Curtis at 23:12 PM on 7 July 2011Great Barrier Reef Part 2: Climate Change Impacts
PaulD @6, the directive certainly precedes the Challenger expedition of 1872. The question is whether it precedes Beaufort's directive that his scale be used in recording wind force (in the 1830's), or his accession to the position of Hydrographer of the Navy (1825). -
Paul D at 23:01 PM on 7 July 2011Great Barrier Reef Part 2: Climate Change Impacts
The Corral project is digitising Royal Navy log books and extracting weather and climate data: http://badc.nerc.ac.uk/view/badc.nerc.ac.uk__ATOM__dataent_1239019538627371 The log books date back to 1669, at least currently. Although the page says that the data is available as jpegs, a lot of work if you want to go through them all. -
thepoodlebites at 22:58 PM on 7 July 2011Increasing CO2 has little to no effect
#56,57 scaddenp The model simulations use observed forcings up until 2000 (or 2003 in a couple of cases). This sounds like adjusting model parameters to match observations. How do the observed forcings differ from modeled forcings and how do these modeled forcings compare to Meehl’s 2004 runs? What are the observed forcings and how are these forcings measured? The modeled trend is about +0.2C per decade, which fits scenario C the best. But scenario C assumed no further emissions after 2000. Why the discrepancy? Scenario B predicted +0.27C per decade. What are the forecasts for 2020, 2050, 2100? From what I read, separating climate sensitivity to CO2 from natural climate variability is still a work in progress, especially considering the observed temperature record over the last decade. How can you say with confidence that most of the warming over the last 30 years is from CO2 rise when it seems that ENSO/PDO/AMO/AO (and solar) are playing a much more significant role in changes in global surface temperatures? -
Rob Painting at 22:54 PM on 7 July 2011Global warming stopped in
1998,1995,2002,2007,2010, ????
Papy - Yes, they are not great communicators. I've had a wee to-and-fro with other SkS authors over that point, but regardless it seems a useful attempt to understand recent variability in the climate. And no global warming didn't stop, just like it hasn't throughout the instrumental records - all of them If Kaufmann and co-author's findings are validated by other research, it's not good news. Sulfate aerosols have a short atmospheric lifetime, and when the Chinese stop pumping out all that extra sulfate pollution, it's going to unleash some warming. And yes they have to at some point, for health reasons and to prevent Ocean Acidification. -
CBDunkerson at 22:52 PM on 7 July 2011Climategate CRU emails suggest conspiracy
les wrote: "I'm sure no one on any part of the mainstream political spectrum would want to encourage political interference anywhere near that level..." Haven't been keeping tabs on Ken Cuccinelli, have ya? :] -
Paul D at 22:49 PM on 7 July 2011Great Barrier Reef Part 2: Climate Change Impacts
Tom - The weather observation directive I think pre-dates the Victorian Challenger voyage. I tacked on the comment about Challenger in addition to my initial comment. -
Eric (skeptic) at 22:48 PM on 7 July 20112010 - 2011: Earth's most extreme weather since 1816?
Here's an interesting paper about hail trends in China: http://iprc.soest.hawaii.edu/users/yqwang/xie_zhang_wang_grl08.pdf While the long term trend in CAPE is up, the freezing level heights are also rising and vertical sheer is dropping. Consequently the long term trend in annual hail days is down. -
les at 22:46 PM on 7 July 2011Climategate CRU emails suggest conspiracy
58 - JMurphy - yes, I was nodding in the direction of your post. I've been racking my mind to think of any organisation - publicly or privately funded - which tackles complaints in general and misconduct in particular, with anything but an internal panel of professionals from around the organisation; given that the complaint isn't a violation of national law. ...and I mean examples from within the modern western democracies - I'm not, of course, including the USSR, Maoist China etc. I'm sure no one on any part of the mainstream political spectrum would want to encourage political interference anywhere near that level... -
cynicus at 22:45 PM on 7 July 2011Lessons from Past Climate Predictions: Syun-Ichi Akasofu
Dana, thanks for the response. I've glanced through the paper again and notice that Akasofu also uses an 'interpreted' dataset for his 'theory', so I guess choosing the WfT Index seems warranted and perhaps even a better one. Although it clearly doesn't matter in light of the other criticisms. @14 Alex C, I don't know how I came to think that Akasofu used HadCRUT only. Now that I read it again this is clearly not the case. Must have had a blackout or something. Thanks for pointing it out. -
Papy at 22:26 PM on 7 July 2011Global warming stopped in
1998,1995,2002,2007,2010, ????
New study about chinese aerosol/sulphur cooling effect during the 2000s : (Reconciling anthropogenic climate change with observed temperature 1998–2008) "Given the widely noted increase in the warming effects of rising greenhouse gas concentrations, it has been unclear why global surface temperatures did not rise between 1998 and 2008" Are they aware of the exceptionnaly warm 1998-niño-year flaw in their decadal trend ? -
JMurphy at 22:18 PM on 7 July 2011Google It - Clean Energy is Good for the Economy
Good to see Cornwall (in the UK) doing its bit to provide clean energy (with more coming soon), while re-using an old tin mine : Solar park goes live Every little helps... -
Tom Curtis at 22:04 PM on 7 July 20112010 - 2011: Earth's most extreme weather since 1816?
Norman @283, while accepting the point about equilibrium, I should point out that although the temperatures peak in August, the difference in temperatures between north and south is greatest in winter, and greater in Spring than in Summer. I just made the comparison between Austin, Texas, and Chicago, Illinois (below); but I suspect it is a general feature: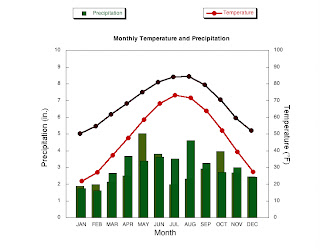 (Austin Temp - black; Precipitation - olive; Chicago Temp - red; Precipitation - Green)
Therefore we would expect the forces driving climate towards equilibrium would be stronger in winter and spring than in summer in the American mid-west.
Despite this, thunderstorms and tornadoes are generally associated with warmer weather. The logical conclusion is that they will be more frequent in spring than in summer, ie, when it is warm enough for super cells to form, but before the strong north south temperature gradient dissipates.
(Austin Temp - black; Precipitation - olive; Chicago Temp - red; Precipitation - Green)
Therefore we would expect the forces driving climate towards equilibrium would be stronger in winter and spring than in summer in the American mid-west.
Despite this, thunderstorms and tornadoes are generally associated with warmer weather. The logical conclusion is that they will be more frequent in spring than in summer, ie, when it is warm enough for super cells to form, but before the strong north south temperature gradient dissipates.
-
DLB at 21:39 PM on 7 July 2011Great Barrier Reef Part 2: Climate Change Impacts
After reading this article I am left with more questions than any answers to coral bleaching and the fate of the GBR. I have just read the Osborne paper (2011) and in it they describe how bleaching has had minimal effect on the GBR between 1995-2008 with coral loss quickly recovering after such events when compared to recovery from Crown of Thorns Starfish or storms. They also mention widespread bleaching events in 1998 and 2002 from which the coral quickly recovered. Looking at Fig. 5 (coral sea summer temp anomalies) for 1998 and 2002 were 0.4C and 0.3C warmer than the long term average. In most of the subsequent years SSTs have been well above 0.4C but I have not heard of any wide spread bleaching events during these other years? I found Fig.2 intriguing it is obvious that the reefs near the continental shelf were not bleached but why? Is it because there is mixing with deeper cooler water or is it due to some other reason like this region is nutrient poor? The bleached outer-barrier between Townville and Cairns was an exception. It made me think a warm current was running up the coast and exiting in this region. If the 1998 bleaching is due to warm waters temps I’d say it is probably due unusually strong solar heating of shallow water than anything to do with global warming. Finally I have had direct experience with coral bleaching. Around 2010 I was in the Capricorn Group at the Sth end of the Reef, it was the middle of winter and about 10-20% of the coral was bleached. The bleaching was not species specific nor was it depth related as coral just under the surface or 3m down exhibited the same amount of bleaching. Again it left me with more questions than answers -
Eric (skeptic) at 20:55 PM on 7 July 20112010 - 2011: Earth's most extreme weather since 1816?
Tom, #289, I would note that the Canadian Arctic is not as cold as it used to be last century. If that temperature is truly a factor in our severe weather, it could help explain why the incidence of strong tornadoes is dropping. -
CBDunkerson at 20:47 PM on 7 July 2011Over the tipping point
Ranyl wrote: "Wonder what weather changes the rapid loss of arctic summer ice will bring?" Yeah, that's the looming question. The problem is, as the article notes, it is just such a huge change that we can't tell what will happen. Will the removal of the sea ice allow a strong Pacific to Atlantic current to develop through the Arctic ocean? Will that change the course of the Gulf Stream and thus replace warm North Atlantic waters pulled up from the equator with frigid waters pulled down from the North Pole? Will the albedo shift be enough to warm Arctic waters to the point that clathrates release large amounts of methane into the atmosphere? What will all these changes do to the melt rate of the Greenland ice cap? And if the weather has been on a crazy roller-coaster ride for the past couple of decades what will a fundamental change to the planet's climate system provoke? The whole world is about to get a first hand demonstration of why the saying, 'May you live in interesting times', is considered a curse.
Prev 1623 1624 1625 1626 1627 1628 1629 1630 1631 1632 1633 1634 1635 1636 1637 1638 Next


