


 Arguments


Recent Comments
Prev 1699 1700 1701 1702 1703 1704 1705 1706 1707 1708 1709 1710 1711 1712 1713 1714 Next
Comments 85301 to 85350:
-
Camburn at 12:24 PM on 4 June 2011Of Averages & Anomalies - Part 2A. Why Surface Temperature records are more robust than we think
It would be interesting to compare the anomoly of GISS to the DMI temperature data sets. http://ocean.dmi.dk/arctic/meant80n.uk.phpResponse:[DB] Digging a little deeper gives an answer to that:
"The temperature graphs are made from numerical weather prediction (NWP) "analysis" data. Analyses are the model fields used to start NWP models. They represent the statistically most likely state of the atmosphere, given the information available to make the analysis. Since the data are gridded, it is straight forward to deduce the average temperature North of 80 degree North.
However, since the model is gridded in a regular 0.5 degree grid, the mean temperature values are strongly biased towards the temperature in the most northern part of the Arctic! Therefore, do NOT use this measure as an actual physical mean temperature of the arctic. The 'plus 80 North mean temperature' graphs can be used for comparing one year to an other."
DMI presents us a tool; like any tool, it can be put to purposes other than intended. Like a direct comparison to GISS...
-
Daniel Bailey at 12:17 PM on 4 June 2011CO2 – Some facts, figures and outcomes
Speaking of facts, figures and outcomes: Ain't Google swell? Looks like too much of a good thing...
-
Camburn at 12:16 PM on 4 June 2011Of Averages & Anomalies - Part 2A. Why Surface Temperature records are more robust than we think
Actually, in the Arctic there is a vast array of temperature metrics that are available to be used. They are not presently used by GISSTEMP, but I do expect them to be added in the near future to improve the quality of the anomolies. http://nsidc.org/cgi-bin/get_metadata.pl?id=g00791 -
Eric the Red at 11:41 AM on 4 June 2011Amazon drought: A death spiral? (part 2:climate models)
Not sure where you are getting your information Albatross, but the warmest years on record are all El Nino years; 1998, 2005, 2010. The opposite for La Nina. Where are the inconsistencies? I do not know what issue you have with the CRU scientists, but it is the longest running thermometer database. We have probably gotten a little OT, but ENSO does affect Amazon rainfall, so I would be willing to keep it to that. -
scaddenp at 10:05 AM on 4 June 2011Are you a genuine skeptic or a climate denier?
Eric (sk), your comment on flood adaptation was interesting to me. A large part of my institute works on identification and assessment of geological risk. We despair at local authority handling of this (despite planning laws that many US states I think would regard as draconian). We would love to see more private insurance involvement - ie insurers assessing risk before a development goes ahead so everyone knows up front about insurance risk. On other hand, your idea of removing levies sounds tricky. Landowners suddenly exposed and unable to get insurance are going to feel property rights were violated and surely they are in different category to those who knowingly bought property in a floodway. Good luck getting their votes. Better still - slow the rate of climate change so you dont have to do expensive adaptation. -
dana1981 at 08:23 AM on 4 June 2011Of Averages & Anomalies - Part 2A. Why Surface Temperature records are more robust than we think
I'm glad our readers are reading the article so carefully! I fixed the typos noted by skywatcher and paulgrace - thanks guys. MarkR - yes, I would say "silly" is an appropriate description for somebody who averages out an exponential increase and pretends it's linear. I could think of a few other descriptive words as well! -
skywatcher at 08:18 AM on 4 June 2011Of Averages & Anomalies - Part 2A. Why Surface Temperature records are more robust than we think
Another excellent and clear article Glenn. I like the way you can see all the cherry-pick arguments falling apart as you read through it. One quick typo, in the 4th paragraph from the end "... are less significantly less ..." maybe lose the first 'less'. As there seems to be some discussion about it, and I don't actually know the answer ... how does GISS treat summer Arctic temperatures? The holding of surface temperatures in summer to about freezing so long as there is ice cover is well known, and I might assume that GISS accounts for this, but maybe I'm wrong? It would not seem right if summer surface temperatures were extrapolated to be well above freezing far out over the melting ice. -
MarkR at 08:15 AM on 4 June 2011Of Averages & Anomalies - Part 2A. Why Surface Temperature records are more robust than we think
#3 ClimateWatcher: isn't it a bit silly to just put a linear trend on the IPCC expectations and assume the trend now is the same as the average? ...they aren't. The trend now is expected to be lower than the trend later. -
paulgrace at 08:05 AM on 4 June 2011Of Averages & Anomalies - Part 2A. Why Surface Temperature records are more robust than we think
Just a typo, search for "esplained in Part 1A" and fix the s. ...Unless Ricky Recardo is being quoted... -
warm at 07:55 AM on 4 June 2011Of Averages & Anomalies - Part 2A. Why Surface Temperature records are more robust than we think
@Eric, The explanation: "Note that an isothermal melt period can be observed in the time series for each dataset when the SAT reaches the ice melt point. During this period the SAT is maintained at about 0C until all the snow and ice in an area have melted." The solution: "During most seasons, SAT trends can be studied by simple statistical methods, but during summer, because these masses hold the SAT to the melting point of sea ice, detection of changes in SAT must rely on other, less direct indicators such as the length of the melt season." -
ClimateWatcher at 07:46 AM on 4 June 2011Of Averages & Anomalies - Part 2A. Why Surface Temperature records are more robust than we think
Yes. Surface temperature trends (CRU: 1.5 K/century, GISS: 1.7K/century) are pretty close to (RSS LT: 1.4K/century, UAH LT: 1.4K/century, and sea surface: 1.3K/century)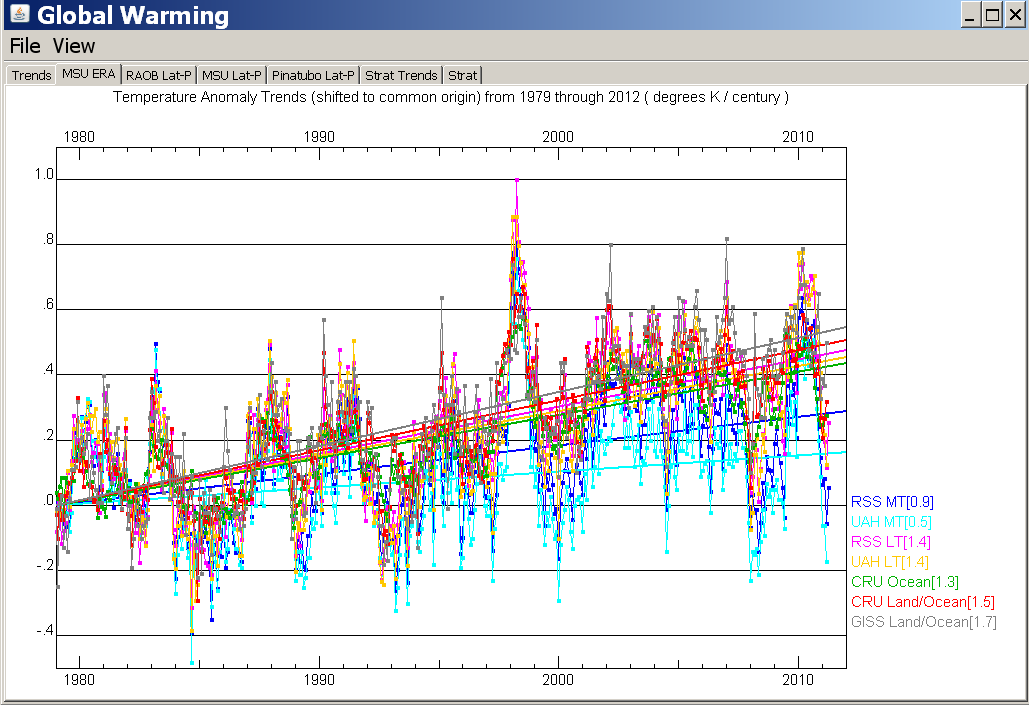 So we have some confidence in the trends, which we then observe are less than the IPCC best estimate for the 'Low Scenario' of 1.8K/century.
Moderator Response:
So we have some confidence in the trends, which we then observe are less than the IPCC best estimate for the 'Low Scenario' of 1.8K/century.
Moderator Response:[DB] What is the paternity of your furnished graphic?
[Dikran Marsupial] IIRC the projections have temperatures rising at an increasing rate, so an increase of 0.14 to 0.17 K/decade at the present time is perfectly consistent with a projected rise of 1.8 K/century. I suspect the projections have temperatures rising faster than 0.18K/decade towards the end of the century. -
Bob Lacatena at 07:40 AM on 4 June 2011Are you a genuine skeptic or a climate denier?
289, Eric, No, Eric, spoken like someone who has learned not to waste his time with people who have made up their minds before bothering to learn as much as they should, and then just want to play games by dancing around and using debate tactics instead of actually trying to get closer to the truth. We'll bump on other threads, I'm sure. -
Byron Smith at 07:13 AM on 4 June 2011CO2 – Some facts, figures and outcomes
Thanks Agnostic - a very informative post and a great place to send people who wonder what the fuss is about things getting a few degrees warmer. Thanks DB (and all other mods), once again. Pete - I believe that Hansen and Sato are speaking of the possibility of 5m by 2100: "BAU scenarios result in global warming of the order of 3-6°C. It is this scenario for which we assert that multi-meter sea level rise on the century time scale are not only possible, but almost dead certain." Pretty much everyone agrees that >10m becomes very likely on centuries or millennia timescales once Greenland and the WAIS pass tipping points that we may well already be close to. -
Albatross at 07:06 AM on 4 June 2011Amazon drought: A death spiral? (part 2:climate models)
Eric @27, Sorry, but you are talking through your hat, and your observations regarding the impact of ENSO on global SATs are incorrect and inconsistent with each other. Ironic that the CRU global SAT dataset (made by those "cheating" scientists) is now the darling of the 'skeptic" crowd-- I wonder why (/sarc)? Might I suggest we move the discussion about the impact of ENSO on global SATs (yea, mea culpa) to a more appropriate thread, as this page is about the Amazon (a regional response). -
scaddenp at 07:00 AM on 4 June 2011Amazon drought: A death spiral? (part 2:climate models)
Eric- one needs to look at the change in temperature as function of the ENSO index. Have a look at Tamino's analysis where relationship with MEI and volcanos is factored in. In press I believe. -
scaddenp at 06:53 AM on 4 June 2011Are you a genuine skeptic or a climate denier?
Eric(skeptic) - whoops, you are correct. Confusing sensitivity with GHG forcing. You said " It isn't 3.7 W/sq meter for doubling of CO2" but now agree that it is? Again, my point here is that you appear to have beliefs without published science to back them. As coal-powered goods. I'm amazed (and encouraged) that you would even consider carbon-tariff. I was really asking whether you were so ideological driven that even if you knew that costs of mitigation where lower than cost of adaptation, you would reject any effective emission strategy. With that encouragement, what would carbon tariff look like that was acceptable? Do you think other libertarians would accept it if you also became convinced that emission-reduction was cheapest option? -
miklos treiber at 06:53 AM on 4 June 2011The Fake Scandal of Climategate
Show me the empirical data, methodology, and computer codes for any scientific argument you can produce and the truth will be known. If you persist in hiding the data, methodology and code, the work you have done is for naught. Without validation such work is only opinion at best. Predictions based on non-validated work is at best a guess.Moderator Response:[e] There is a comprehensive catalog of available climate data sources here. This site also makes extensive efforts to cite all claims back to the original research. If there is a particular piece of information you are looking for, please use the search function or peruse this site's list of skeptic arguments.
The surface temperature post may be of particular interest to you, as it discusses the multiple independent reconstructions and validations that have been done on the CRU and NASA data.
-
scaddenp at 06:44 AM on 4 June 2011Are you a genuine skeptic or a climate denier?
J Bob, not that interesting - ignores other forcings. Benestad and Schmidt is interesting. As is Tamino's but not published yet. -
Eric the Red at 06:32 AM on 4 June 2011Of Averages & Anomalies - Part 2A. Why Surface Temperature records are more robust than we think
Very interesting warm, While winter temperatures are somewhat correlated between the land and ocean, in the summer they found, "no correlation between the interior land and ocean observations." -
RSVP at 05:42 AM on 4 June 2011CO2 – Some facts, figures and outcomes
Conclusion "Those governments can and should be compelled to act responsibly by imposing a carbon tariff " ( -Accusations of deception, fraud, dishonesty or corruption snipped- ).Response:[DB] Please note that posting comments here at SkS is a privilege, not a right. This privilege can be rescinded if the posting individual treats adherence to the Comments Policy as optional, rather than the mandatory condition of participating in this online forum.
Please take the time to review the policy and ensure future comments are in full compliance with it. Thanks for your understanding and compliance in this matter.
-
Pete Dunkelberg at 05:31 AM on 4 June 2011CO2 – Some facts, figures and outcomes
Thanks for assembling this. Lets note that this "... Hansen and Sato predict a rise of up to 5m." is not really a prediction of the high end. Unfortunately, under a business as usual scenario, there is no reason why sea level can't go up that high. In fact it is very likely to, but how soon? Unfortunately this can't be determined yet. By the way, if you are looking for consequences here's one. -
warm at 04:52 AM on 4 June 2011Of Averages & Anomalies - Part 2A. Why Surface Temperature records are more robust than we think
An important paper about long range correlations in arctic: Variations in Surface Air Temperature Observations in the Arctic, 1979–97. Rigor et al. 1999. http://citeseerx.ist.psu.edu/viewdoc/download?doi=10.1.1.167.1697&rep=rep1&type=pdf See fig. 5 and table 2 -
Chris G at 04:41 AM on 4 June 2011IEA CO2 Emissions Update 2010 - Bad News
Dr PhD, I suspect your perception of hostility is due in part to your assumption that some demonstrably highly knowledgeable individuals are simply unaware of really basic things. And, your last response indicates an unawareness that Dana is not advocating 100% solar and/or that there exist ways of storing energy for later use. Do we have such capacity to store energy on industrial scales now? No, but it is an engineering problem and I have more faith that it can be solved than the problem of fusion or some other miracle cure will be found. Personally, I don't know and don't care if nuclear is required. Compared to the costs/effects of widespread food shortages, an incident like Fukushima every decade or so is a fair trade-off. Chernobyl like situations are to be be avoided, of course. My guess is that fast-breeder reactors are a viable course for base load, but nothing is going to be as expensive as continuing fossil fuel use. It is likely that Camburn is right that the US will not implement cap-and-trade anytime soon, and I prefer a phased-in carbon tax+dividend anyway, but that does not mean that the US and the world at large would not be better off if some attempt to limit CO2 production were made. For instance, if a disastrous harvest in Russia can spark a wave of revolts across the Middle East, I'm not looking forward to seeing what a serious drought across the agricultural regions of China triggers. China will just buy up whatever their shortfall is, but that won't be good news for whichever poorer nations have to bid against them. If it happens that the US has a poor harvest at the same time, I don't know that the US could get away with an export ban as Russia did; China has leverage on the US because of debts. It is a pretty safe bet that food production will suffer some impacts in a BAU world. Here is something recent: Mapping hotspots of climate change and food insecurity in the global tropics -
Jigoro Kano at 04:33 AM on 4 June 2011Are you a genuine skeptic or a climate denier?
RSVP @ 181 As the moderator suggested, I posted a reply at the 2nd Law thread. -
Jigoro Kano at 04:26 AM on 4 June 20112nd law of thermodynamics contradicts greenhouse theory
RSVP @ 182 or 181? . Igloo do not make you warmer, they slow your loss. Igloos are not ovens. The contents, be it Eskimos or lamps, must have it's own power source. To further your parallel resistance analogy. If your circuit is powered with a 240 W sources, how many resistors, any arrangement of your choosing, are required to increase the supply power to 390 W? -
Dr. Jay Cadbury, phd. at 04:21 AM on 4 June 2011Renewables can't provide baseload power
Okay so to better understand my opinion, I'm a big free market guy, believe the market is self-correcting and finds its own solutions. When I look at global final energy consumption and I see alternatives contributing between 0-1%, I'm not optomistic. I firmly believe there would be a car running on solar if it were cheaper but I don't think it is. I think we might find that fossil fuels are permanently cheaper than alternatives because of the massive potential in gas hydrates.Response:[dana1981] My moped runs on solar energy. A lot of peoples' cars run on solar energy, too. I'll be one of them in a few years. Fossil fuels are already more costly than renewable energy, and that includes coal. Try reading the Renewable energy is too expensive rebuttal. Right now the "free market" doesn't take into account the full costs of fossil fuel energy. Not even close. Economists hate it - it's a market failure. That's the point of a carbon price, to make the free market work better.
-
Eric the Red at 04:21 AM on 4 June 2011Are you a genuine skeptic or a climate denier?
Spoken like a true denier Bob. -
Phila at 03:59 AM on 4 June 2011IEA CO2 Emissions Update 2010 - Bad News
Dr. Jay, PhD: I like wind and solar but everybody besides dana knows that at night the sun is gone and there is a moon and the wind is not always blowing. The hostility, such as it is, arises from the fact that you don't seem to know what you're talking about. In the first place, storage systems already exist for solar energy. You can try googling "thermal storage." Or if that's too technical for you, "batteries." Are these solutions perfect? Obviously not. Is there no conceivable way of improving them? Obviously not. Are companies working on these problems right now? Of course. Beyond that, the complaint that "I don't see 100% of our energy needs met with renewable energy" is basically a strawman, as well as an example of the fallacy of exclusion (i.e., it implies that we can meet 100 percent of humanity's energy needs with nuclear and fossil fuels. Which is debatable, to say the least). It's also funny that the people who whine about the practical availability of renewable resources tend to be downright cornucopian about our supply of fossil fuels, but that's a rant for another day.Moderator Response: A better thread for continued discussion of this topic (if Dr. Jay chooses to reply) is Renewables can’t provide baseload power. -
Charlie A at 03:22 AM on 4 June 2011Can we trust climate models?
Kevin C, you may find the following article from International Journal of Forecasting interesting as it uses a variety of metrics to compare the HadCM3 AOGCM of Hadley center with some time series forecasts. Validation and forecasting accuracy in models of climate change Non-paywalled draft paper Discussion and additional info from author at Pielke Sr's blog. When looked at from the point of view of a statistician or forecaster, the climate models don't do very well globally, and are very poor at regional predictions. The climate models, in many tests, have predictive capability worse than a random walk. -
David Lewis at 02:57 AM on 4 June 2011Climate Change Denial book now available!
RE: my earlier reference to Public Radio International's "Living on Earth" March 25 2011 interview with Amory Lovins, which I said illustrated my point that Lovins operates in a similar manner to Lord Monckton. The interview is still there, i.e. http://173.236.147.250/shows/segments.html?programID=11-P13-00012&segmentID=2 but it seems that "Living on Earth" has now removed all comments from their shows and no longer allows them. My point expands a bit, from why do opponents of nuclear power have to lie if the case against nuclear is so strong and clear, to include, why do shows caught airing the lies have to censor people who comment who point out that the lies exist? Its something for an author who studies how and why climate science deniers operate who argues against nuclear power the way you do, to think about, I think. -
Bob Lacatena at 02:37 AM on 4 June 2011Are you a genuine skeptic or a climate denier?
280, Eric the Red, I don't care much what you think of me or what you say to others about me, or about what I've said. The words are there for anyone who cares to go back and read. I also don't come here to have open ended, pointless debates with people who are in clear denial. If we bump heads on another thread, so be it. I'm not going to educate you on all of the vagaries of climate science here. That, you'll have to do on your own. And if you feel like you already know it all, well... I've already stated my position on that. After all, that is the actual point of this thread, distinguishing skeptics from deniers. You know which category I think you fall into (and the people who are in denial aren't worth my time -- they're completely lost, until they first figure out how to be skeptics). Only real skeptics are worth conversing with. -
John Hartz at 02:32 AM on 4 June 2011Are you a genuine skeptic or a climate denier?
Climate Truthers: Why Global Warming Deniers Are Conspiracy Theorists, Not Rational Skeptics" is an excellent essay by Sahil Kapur posted on Huffington Post May 31). http://www.huffingtonpost.com/sahil-kapur/climate-truthers-why-glob_1_b_869294.html Kapur's article nicely supplements John Cook's essay, "Are you a genuine skeptic, or a climate denier?" -
Bob Lacatena at 02:30 AM on 4 June 2011Are you a genuine skeptic or a climate denier?
283, J. Bob,...show it.
I already made the only offer I'm going to make. An open ended invitation to simply try to convince you that you are mistaken in your beliefs is pointless. You can pursue what I offered, or drop it. The choice is yours. -
les at 02:23 AM on 4 June 2011Are you a genuine skeptic or a climate denier?
284 "pist modern" should, of course, be "post modern" - although the iPhone may be trying to make a point on behalf of the Machine of Loving Grace! -
les at 02:11 AM on 4 June 2011Are you a genuine skeptic or a climate denier?
277 - Eric (Sceptic) Given your somewhat Randian philosophical perspective, you might enjoy a documentary being put out by the BBC just now: All Watched Over by Machines of Loving Grace. Before I get slapped for not respecting 282-Mods. I think this is central to the "denier" trope, a large part if which is libertarian and pist modern; the two combine into a mind set (I'm nit referring to Eric here) where science & objective reality (tge irony with Rands 'objectivim' isn't lost) can be sacrificed to 'defend' personal liberty from government/the UN/the NWO.Response:[DB] Understood.
-
Tom Curtis at 01:39 AM on 4 June 2011Ljungqvist broke the hockey stick
RyanStarr @11, I am uncertain as to what you are trying to point out. Before examining that, however, let's get the facts straight: a) The range of temperatures between the highest reconstructed temperature (0.196 for 950-959) and the lowest reconstructed temperature (-0.692 for 1690-1699) is 0.888 degrees C; b) The difference between the instrumental value for the decade 1990-1999 (0.388 degrees C) and the reconstructed temperature for the same decade (0.056) is 0.332 degrees C; and c) The increase in the instrumental temperature record over the last three decades has been very large compared to the range of temperatures shown in the reconstruction, with a total increase over the three decades of 0.883 degrees over the three decades, or 99.4% of the reconstructed range of temperatures over the preceding two thousand years, and an increase of 0.4 degrees C in the last decade, or 45% of the range of temperatures over the last two thousand years. The first thing I thought of when you started comparing the appropriate figures above is that it highlights how extraordinary has been the increase in temperatures over the last three decades. What is more, this increase comes from a high base with final reconstructed decade only exceeded by eight other reconstructed temperatures out of 200, or just 4%. This absolutely underlines how implausible are claims that recent temperature increases are due primarily to natural variability, both because of the extreme temperature rise in so short a time, and because the temperature has risen in just three decades to exceed the previous highest value by approximately two thirds of the range of variability over the last two thousand years, with no indication that the temperatures will not continue rising. Now, knowing you, I'm sure that is not your point. It escapes me how you can avoid noticing the implications of those facts, however. Thank you for bringing it to my notice. Knowing you, I believe that you are attempting to cast doubt on either the reconstructed temperatures or the instrumental temperatures (or both) based on the discrepancy. I do not know which, so you will have to elucidate. However, in doing so, please confine yourself to the relevant facts. Specifically, it is irrelevant how high the instrumental value for 2000-2009 is above the reconstructed value for 1990-1999. There can be no discrepancy between the two because they do not cover the same period. The discrepancy between the 1990-1999 reconstructed and instrumental values, on the other hand, is relevant. It amounts (as noted) to a difference 0.332 degrees, or 37.4% of the total range of the reconstructed value. -
J. Bob at 01:18 AM on 4 June 2011Are you a genuine skeptic or a climate denier?
Sphaerica @ 269 says, “First, as I have repeatedly said, I don't have an opinion, I instead understand the science”. OK, if you understand science, show it. At least scaddenp @ 268 presented one of Paul Barton’s graphs. Scaddenp @ 268, interesting graph, hope to get back to you tomorrow. -
Jigoro Kano at 01:09 AM on 4 June 2011Are you a genuine skeptic or a climate denier?
Baines 275 You asked: "I would love to ask jiguro "who on earth suggests a real taxation rate of 75% for 250k?" and "aren't sin taxes about shifting relative costs?" and "didn't Bush II cut taxes, and didn't the surplus he inherited turn to a deficit?" Way way off topic. 75% is to illustrate the point. However, during Carter top marginal rate 70%, FDR 99.5%, Obama just this week proposed 65%...not far off. Check your financial data history. Clinton did leave as debt surplus not the deficit surplus. Debt is year to year, deficit is accumulation of year to year. So although Clinton realized a small debt surplus, the deficit still increased. Bushes first term saw 911 which devastated the economy. By cutting taxes the treasury tax receipts increased. In fact, the receipts were growing so fast the treasury projected surplus by late 2008. Why the market crash of 2008...well that too far of topic---Hayak vs Canes is a debate for a different site. Suffice it to say, the problem for all administrations beginning with FDR, deficit spending (future taxes)out pacing economic growth.Response:[DB] Everyone, can we please remove this type of discussion to the CO2 limits will harm the economy (or other, more-appropriate-than-here) thread? This thread is about Are you a genuine skeptic or a climate denier?
Thanks!
-
Camburn at 01:02 AM on 4 June 2011IEA CO2 Emissions Update 2010 - Bad News
Eric: Yes we are. And it involves a larger area than ND. That is why our Senators were going to vote no on Waxman. ND is an energy exporting state. We have permitted 4 large windfarms, with another being built this summer. I live 13 miles from one large windfarm, and it is great to see the turbines turning. -
Charlie A at 00:40 AM on 4 June 2011Can we trust climate models?
Kevin C @84. "Eschenbach's other mistake is that his model is too simple. His single time constant can't reflect the more complex response function of the real system." His simple single time constant lag model has 0.99+ correlation with the output of two different AOGCMs. Like you, he doesn't believe this is likely to be a good replica of the real, complex response fuction of the real climate system. That was the point of that series of articles. He was surprised at well the GCM model outputs (on a global average) could be replicated by simply multiplying the forcings by a constant, or multiplying by a constant and then a lowpass filter. The models parameterize things like clouds. So the models wouldn't show things like a change in the daily cloud patten so common in the tropics. Clear in the morning, clouding up and raining in early afternoon. It wouldn't take much of a time shift in the daily pattern to have a large, relatively fast feedback. -
Kevin C at 00:06 AM on 4 June 2011Can we trust climate models?
And here are the results with the original forcings to 1990, and Hansen's 2011 values from Charlie's post #81. (Misread Hansen first time, sorry). 0.861 0.491 0.808 0.792 0.525 0.584 0.817 0.194 0.811 Still worse. -
Eric the Red at 00:04 AM on 4 June 2011Can we trust climate models?
Thanks Kevin, I am keenly interested in the aerosol research, and hope to see much more in the near future. Especially given the high uncertainties attributed to aerosols and clouds. Volcanoes have always been difficult to model for endless reasons. BTW, if you like simplicity, take the monthly CRU data starting from 1880 and subtract a trebnd equal to 0.005C/month (0.6C/century). -
RyanStarr at 00:03 AM on 4 June 2011Ljungqvist broke the hockey stick
I understand the red HadCrut line starts rising above the blue prior to its (the blue's) conclusion. However if we presume that the overlay has been performed correctly through the time axis (and I don't presume otherwise) then the point remains that Ljungqvist concludes at 0.07'ish degrees in 2000 and the HadCrut overlay concludes 10 years later at 0.8. Of course we expect some disagreement here, proxy vs instrument, but lets put this difference into some perspective. In the space of 2000 years the Ljungqvist reconstruction hits a low of -0.7 and a high of 0.2, suggesting a range of 0.9 for that period. That is to say, taking this as an arbitrary (though recent) climate window suggests min/max extents 0.9 degrees apart. Allow via subtraction 0.2 degrees for the 10 years and the difference is still 58 % of the 2000 year min-max range. HadCrut plots http://www.skepticalscience.com/news.php?p=4&t=168&&n=394 -
Eric the Red at 23:42 PM on 3 June 2011IEA CO2 Emissions Update 2010 - Bad News
Camburn, While accurate, your choice of month and years renders the cooling trend almost meaningless. Long term, the temperature has increased, although most of the increase has occurred during the winter (even including the cooling trend of the last decade), and prior to the mid 1930s. If you check the seasonal trends prior to and after 1935, winter prior to 1935 showed the greatest warming, with almost no temperature trend in either the summer or fall from 1935-present. Not sure were we are going with this, except to point out the fallacy in determining trends over short time frames. It is interesting to note that ND has shown no warming over the past 30 years. Bucking the trend, are you?Response:[DB] Please, let us remove our focus from the weather and back to the topic of this thread, IEA CO2 Emissions Update 2010 - Bad News.
Weather is now off-topic on this thread.
-
Camburn at 23:40 PM on 3 June 2011IEA CO2 Emissions Update 2010 - Bad News
Yvan Dutil: Note I said regional. The 30 year trend for winter is down as well based on the long term mean, and the last 10 years have shown an accelerated downward trend. I live here, I believe the trend. -
Yvan Dutil at 23:34 PM on 3 June 2011IEA CO2 Emissions Update 2010 - Bad News
Camburn. Such short term slope are going in every direction. Anything shorter than 30 years make no sense for climate trend analysis. This is only basic statistics. This has been discussed extensively here and elsewhere.Response:[DB] This has been pointed out to Camburn many times previously. I believe the distinction to be lost.
-
Kevin C at 23:25 PM on 3 June 2011Can we trust climate models?
I tried a quick experiment with two choices for the reflective aerosol term. Here's the R2 values for the original forcings. I got the baselines wrong for the holdout stats, so I've redone them here. Sorry about the lack of formatting. Table rows and columns as before. 0.865 0.500 0.818 0.813 0.525 0.648 0.856 0.445 0.815 And here's the same data setting the reflective aerosol term to -0.5 * the well mixed GHG term: 0.852 0.482 0.786 0.790 0.522 0.579 0.809 0.212 0.779 Both the fitted data score (top left) and the predictive power (bold numbers) suggest this set of forcings is less good at explaining the 20th century temps using an empirical lag model. (But fitting on only 62 years of data is probably unrealistic. Should really run with 31/93, 93/31, and maybe 31/62/31 predicting the middle.) Eric: According to my (possibly flawed) understanding, Eschenbach's 'risibile fantasy' quote is hard to reconcile with the physics of the system. Radiative forcing is simply a measure of the extra energy being pumped into the system. Of course it is simply related to how the energy in the system varies over time. The only reason this isn't transparently obvious is that we don't have a simple way to measure that energy - we only measure the temperature of a subset of the components, which in turn have different heat capacities and are continuously exchanging energy among themselves. Thus, although there are annual variations, I think it is totally reasonable that the global temperature averages of the GCMs can be modelled with a simple lag model - and clearly so does Hansen, since he does exactly that in his 2011 draft paper. Eschenbach's other mistake is that his model is too simple. His single time constant can't reflect the more complex response function of the real system. This would be OK apart from the volcanoes, which are the only forcing with sharp discontinuities. As a result he has to fudge the volcanic forcing. (This was Tamino's point, but my alternative model parameterisation supports his conclusion.) -
Camburn at 23:02 PM on 3 June 2011IEA CO2 Emissions Update 2010 - Bad News
With the economic numbers out this morning in the USA, I don't forsee much of an increase in CO2 coming from this area any time soon. I don't see any legislation coming any time soon either. There are too many current problems that need to be addressed before long term problems will find a foothold. -
Eric (skeptic) at 22:48 PM on 3 June 2011Are you a genuine skeptic or a climate denier?
scaddenp, the coal-powered goods is a confluence of several problems, one of which is our exporting of carbon emissions. I don't like it and I avoid it, but other people buy those goods because it's their choice. If you are asking in the hypothetical if I would propose a carbon tariff, I'd have to see the details, and we'd have to (hypothetically) eliminate the political manipulations that usually accompany tariffs. The 3.7 W/m2 is radiative forcing from line-by-line models of CO2 doubling, not GCMs with water vapor. The 3.7 alone will produce about 1C rise, the water vapor feedback will produce the rest. I don't have a total here, but will put one in an appropriate thread at some point. -
Camburn at 22:45 PM on 3 June 2011IEA CO2 Emissions Update 2010 - Bad News
Djon: The more samples, the more reliable the mean. Take a look at our winters 2000-2010. We have been experiencing a cooling trend verses the long term mean which surprises no one living here. This is only a regional observation, and in no way implies that the world as a whole is not warm. I picked those months because the temp/trend is important to life here.
Prev 1699 1700 1701 1702 1703 1704 1705 1706 1707 1708 1709 1710 1711 1712 1713 1714 Next


