


 Arguments


Recent Comments
Prev 1709 1710 1711 1712 1713 1714 1715 1716 1717 1718 1719 1720 1721 1722 1723 1724 Next
Comments 85801 to 85850:
-
Albatross at 04:31 AM on 28 May 2011Temp record is unreliable
BP @203, Try reading the thread every now and then. It was KR quoting Braganza et al 2004, who said "observed diurnal temperature range (DTR) changes are actually much larger than predicted by models". It's a pity it was fabricated." Actually BP, you need to read very carefully what you wrote @191. I know what Braganza found, and KR's reading of the paper @186 is correct. Braganza (2004): "Observed DTR over land shows a large negative trend of 0.4C over the last 50 years that is very unlikely to have occurred due to internal variability. This trend is due to larger increases in minimum temperatures (0.9C) than maximum temperatures (0.6C) over the same period." Inconvenient for you and Watts is that Fall et al's work brings the models into closer agreement with the observations. Watts loses again. Also, the models did not predict a statistically significant decline over much of the contiguous USA between 1950 and 1999, consistent with the findings of Fall et al. (see Fig. 3 in Zhou et al. 2010). Watts loses again. What was fabricated? By whom? The only things that was possibly fabricated was the following claim made by you @191 when you said: "Or, alternately, you can insist the temperature record is reliable, but the fast increasing DTR is inconsistent with model predictions." Do you see that word "increasing" that you typed? Perhaps you meant to say was something like "the rate of decrease in observed DTR is greater than that predicted by the models over the USA". Do you not read what you type before disparaging others? Again, if anything, Fall et al's work actually brings the models into closer agreement with the observations over the USA, and one of the paper's authors Dr. John Nielsen-Gammon agrees with that. Another "skeptic" bubble burst.... KR, @186 "The issues with day/night temperature range are quite different - you might profitably look at Braganza et al 2004, who note that observed diurnal temperature range (DTR) changes are actually much larger than predicted by models, most likely because of insufficient accounting for temperature driven cloud increases in those models." -
dana1981 at 04:30 AM on 28 May 2011The Critical Decade - Part 1: The Science
The alkilinity statement is taken directly out of the report, so you'll have to take it up with the authors! -
Stephen Baines at 03:49 AM on 28 May 2011The Critical Decade - Part 1: The Science
boba's right. Alkalinity has a very specific definition in chemical oceanography. The ocean is getting less alkaline, in that pH is declining, but alkalinity is not decreasing. Very confusing, I know. Wikipedia is actually pretty good on this point. -
David Lewis at 03:47 AM on 28 May 2011Climate Change Denial book now available!
I see GE is making big news proclaiming how cheap solar power will be within a few years. Bloomberg (http://www.bloomberg.com/news/2011-05-26/solar-may-be-cheaper-than-fossil-power-in-five-years-ge-says.html) has a story quoting GE's global research director, Mark Little: "If we can get solar at 15 cents a kilowatt-hour or lower, which I’m hopeful that we will do, you’re going to have a lot of people that are going to want to have solar at home,” Contrast that "coming real soon now" of 15 cents kWhr with your statement in "Climate Change Denial" that nuclear, at the price MIT said it could be produced for now, i.e. 6.7 cents kWhr, is "not cheap" and therefore we should not be putting any money into nuclear. You make statements about solar in your book that carefully avoid putting the cost into an understandable form, i.e. cost per kWhr now or at some date, you claim the problems with solar "have been largely solved", and you lump nuclear advocates with climate deniers together as opponents of solar who don't know what they are talking about, i.e. "this is contrary to the views expressed by nuclear and denial advocates". James Hansen is a nuclear advocate who happens not to be a climate science denier, or a solar opponent. -
boba10960 at 02:46 AM on 28 May 2011The Critical Decade - Part 1: The Science
Excellent summary of information that is valuable to have at ready access! However there is an error in the statement: "The alkalinity of the ocean is decreasing steadily as a result of acidification by anthropogenic CO2 emissions." Rising atmospheric CO2 does not change the alkalinity of seawater. Rather, rising CO2 lowers the concentration ratio of carbonate ions to bicarbonate ions, while maintaining a constant alkalinity. It is the concentration of carbonate ion that is thought to most affect calcification by organisms. -
Philippe Chantreau at 02:38 AM on 28 May 2011Temp record is unreliable
If BP is refering to Anthony Watts' miserable operation, I stand by my statement. There is data analysis to substantiate. -
Philippe Chantreau at 02:31 AM on 28 May 2011It's cosmic rays
THanks for that link Arch. The real problems with the GCR hypothesis are unresolved. The effect is weak at best, whatever particles are created are too small, and no possibility for a particle growth process has been put forth yet. -
Rob Honeycutt at 02:09 AM on 28 May 2011Even Princeton Makes Mistakes
Mike @ 100... "Really, you might as well give up on this, unless you like banging your head against a wall." I believe the point to an article like this from Chris Colose and anyone else who publishes a response to Happer's article (or posts comments like these to articles) is to not give up. I would never assume that anything we say here, Chris says, or even the other faculty at Princeton say will have any impact whatsoever on Happer's choices. As I stated before, this is ideological for him... he doesn't care what we think about the science. But I will continue to bang my head against these kinds of walls. I encourage people like Chris to continue to do so as well. And hopefully others will also continue to point out when people like Happer attempt to confuse the public. To say nothing is to be complicit with Happer's statements. -
John Russell at 01:46 AM on 28 May 2011Has Global Warming Stopped?
Thanks, Doug. For the record, you'll find the response where I used the info in the thread here. -
Bern at 00:35 AM on 28 May 2011The Climate Show Episode 13: James Hansen and The Critical Decade
Holy guacamole, John - it takes you an hour and a quarter to get to UQ??? I guess you're on the other side of the city centre then... or are you talking peak hour? That might only be 5 k's through Toowong & St Lucia, in that case! Gotta love Brisbane traffic, especially on Fridays. :-P (for those who aren't familiar with the traffic in Brisbane, I frequently average less than 30km/h on my trip to work along a 100km/h-zoned freeway, although my record is three and a half hours for the 17km trip home) A good show, in any event. I quite enjoyed the Hansen interview, although I'm going to have to listen to it again, got kinda distracted by upset offspring.Response: I was factoring in peak hour - turns out I didn't quite get to the end of the show on the drive home. -
arch stanton at 00:32 AM on 28 May 2011It's cosmic rays
JoeRG and anyone reading this discussion might be interested in the new topic posted at RC -
John Russell at 00:08 AM on 28 May 2011Has Global Warming Stopped?
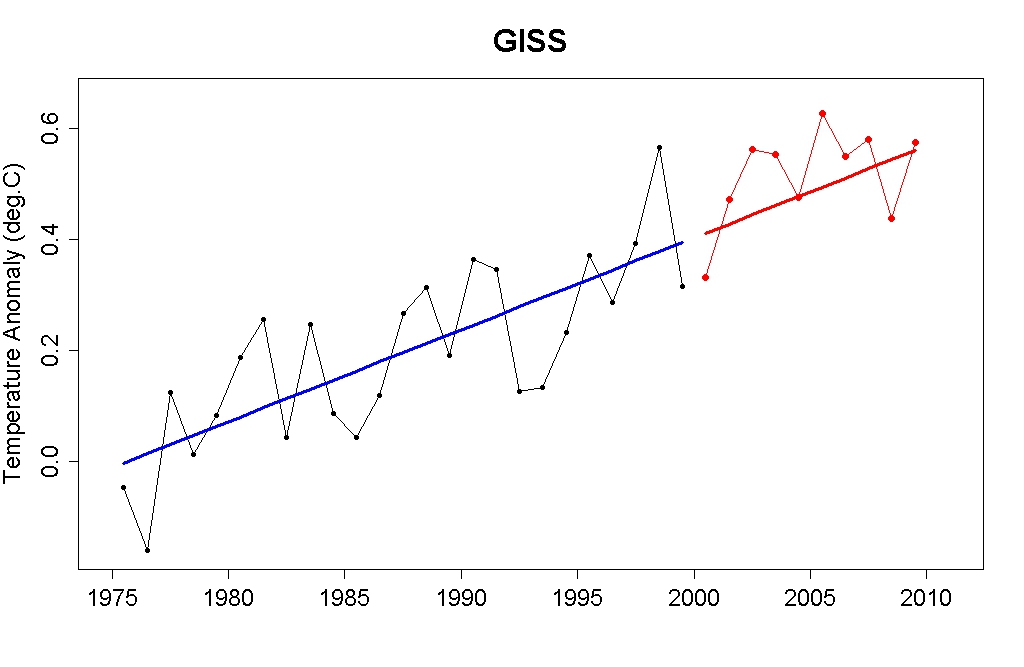
I'd be very grateful if someone could provide an update on this topic (to answer someone elsewhere). Would data gathered in the last year alter the statement that "...there has (only just) been no statistically significant warming since 1995... etc."?Response:[DB] Tamino examined this issue back in January here.
Based on his analysis, the warming since 2000 is statistically significant (the error bars do not include zero):

Considering the Aughts (the decade 2001-2010) were the warmest in the instrumental record, with 2010 being tied for the warmest year on record, you can safely say that global warming is still happening today.
-
DSL at 23:41 PM on 27 May 2011If It's Not Sex, Drugs, and Rock 'n Roll, what is it? Creativity maybe?
There's plenty of optimism out there. * There's the widespread tendency to believe that everything's going to be ok because technology will save us. * There's the widespread tendency to believe that everything's going to be ok because the free market will save us. * There's the widespread tendency to believe that everything's going to be ok because god(s) will save us. * There's the widespread tendency to believe everything's going to be ok because, hey, "it's ok here, and I'm middle class, educated, and insured, so I'll survive" and since the middle class controls cultural production, the overwhelming message in cultural production is "we'll be ok." * There's the widespread tendency to believe that things are going to be ok because everyone knows that people who prophecy doom are extremists, one and all nutjobs--whether scientists or not. * There's the widespread tendency to believe that things are going to be ok because "we've been through tough times before." * There's the widespread tendency to believe that things are going to be ok because all we really need to do to solve something is talk about it . . . and keep talking about . . . and keep talking . . . [no doubt true, but action at some point . . .] All of this optimism is the momentum of BAU. If you want to use "culture" to change culture, don't directly address the issue. Write a bunch of scripts for stage and screen that have as a central crisis people not heeding the obvious and then having to pay the price (include the elements of technological failure, market failure, and religious failure -- good grief, just turn the last hundred years of actual human history into a TV show). Get that "meme" (a word that means "idea" but doesn't sound as dangerous) out there, let it sink in, and then deliver a strong comprehensive dose of evidence. -
skywatcher at 23:24 PM on 27 May 2011Even Princeton Makes Mistakes
Apologies for being a little O/T but some context for Happer's Greenland misinformation: It's an egregiously false statement of Happer's to suggest Greenland in the Holocene has been anything other than a mostly ice-covered continent with small zones of climatically marginal, but viable, land mostly in two regions of the southwest. We know from isotope data that Norse Greenlanders' diet evolved from mostly terrestrial to mostly marine over the lifetime of the settlement (e.g. Arneborg et al. 1999, Radiocarbon), indicating a move from a pastoral terrestrial farming lifestyle, like Iceland or Norway, to one dominated (up to 80%) by a marine diet. But we also know they survived the transition, and were not reliant on outside aid for their basic subsistence. Trade, e.g. export of walrus ivory, and a large reason for the colony, is another matter. A leading modern hypothesis for the demise of the colony is that the walrus ivory trade to Europe dried up, because of African ivory and/or political change in Scandinavia. There are other hypotheses (e.g. Inuit encroachment from the north), but the hypotheses are not often dominated by the coincident climatic deterioration (e.g. a couple of accessible refs: Dugmore et al 2008; Ogilvie et al 2009). The climatic deterioration reduced but didn't eliminate the growing season (and they adapted anyway), and the glaciers advanced a small distance (~1-2km), certainly not down into the area of settlements. Popular perceptions of glaciers bulldozing the settlements, or the Norse dying of cold just don't hold up to scrutiny of the evidence. And as ever, local temperature changes in Greenland (or English wines, see Tom's post #101) on the order of 1-2C don't disprove anything in regard to global climate sensitivity except that they do support higher climate sensitivity values, and say nothing in regard to modern global temperature forcing drivers. Coincidentally, Greenland's modern temperature is pretty close to that during the MWP, so areas of green that you see in summer Google Earth or Modis imagery are comparable to those present 1000 years ago. But don't be fooled into thinking that the green areas all turned white in the LIA - they turned just a little less green! -
Tom Curtis at 23:11 PM on 27 May 2011Even Princeton Makes Mistakes
Dikran Marsupial @106, your point about natural variability is well illustrated by one particular model run (shown in lime green). Measured temperatures have, it turns out, been tracking it quite closely except for 2005 (which was above it). After 2010 the lime green model shows another decline in temperature, and continues to lie below the 17 model mean until around 2035, but by 2100 it lies well above the mean. Clearly very short periods are not sufficient to validate long term trends. Given that, and given that the measured values lie within the confidence intervals, and given that the measured trend is very close to the predicted trend, I think that Happer's claim that "...since the predicted warming has failed to be nearly as large as computer models forecast..." is simply false. They are very nearly as large as predicted by any reasonable measure. I suspect that is too subtle a point for Dr Cadbury to admit error on, however (if any point is not too subtle for that). -
Tom Curtis at 23:00 PM on 27 May 2011Temp record is unreliable
Berényi Péter @209, the accompanying "zonal mean" graph is exactly that, an accompanying graph. It is not published by GISS apart from the relevant map which is hte primary data; and nor was it published apart from it here. As such people seeing it are unlikely to be confused into thinking the zonal mean from 60 to 80 degrees south represents anything but the obvious measured anomaly rather that the equally obvious grey unmeasured areas. Further, the important thing is the 0.05 global mean anomaly between the respective periods. If you think noticing a large number of temperature measurements where you claim there was only one, and noticing that no claim was made of measurements in unmeasured areas contrary to your claim is without substance, then no wonder you are a denier. However, seeing you object to that map, consider the following which, as it compares 1940-1960 to 1970-1990 is more relevant to your claim of no warming between 1950 and 1980. Notice that the anomaly is 0.08 degrees C. Or perhaps you would prefer a simple comparison of 1950 with 1980 which has a 0.29 degree c anomaly. Clearly you claim is false. As this post shows that, you will no doubt consider it also without substance.
-
Dikran Marsupial at 22:49 PM on 27 May 2011Even Princeton Makes Mistakes
Tom Curtis@105 It is worth pointing out that the model projections estimate only the forced component of any trend (i.e. the trend due to changes in forcings), whereas the trend we actually observe is composed of both the forced component and the unforced component (i.e. "natural variability"). As a result, we shouldn't expect the model trends to be a precise match for the observed trend. The spread of individual model runs gives an indication of the plausible magnitude of the unforced component, so if the observations lie within the spread of the model runs, then the models are as accurate as they claim to be. Very clearly from the diagram, they are. The claim that "since the predicted warming has failed to be nearly as large as computer models forecast" is indicative of a rather poor understanding of climate physics, how climate models work and how they are used. The claim clearly is not factually correct as the model forecast says that trends that are smaller than the observed trends are plausible, but trends a little larger are more probable. -
Tom Curtis at 22:35 PM on 27 May 2011Even Princeton Makes Mistakes
Apologies to Dr Cadbury and all. I made a significant error in my graphic manipulations which I have now corrected below: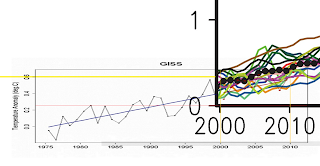 In light of this I have to amend my claims as follows:
a) The measured trend is slightly less than the trend of the 17 model mean;
b) Just three of eleven measured values lie on the 17 year mean with the rest lying below it;
c) Two measured values (2000 and 2008) lie below the lowest prediction by any model for that year; and
d) No measured value lies on or above the highest predicted value for any year.
Clearly I jumped the gun (and should probably have known better. The Earth is in fact warming slower than model projections. It is just marginally slower, slow enough that I needed to lay the full 35 year trend of measured valued along the mean to ascertain the trend was slower. Consequently I still consider Happer's claim unwarrented. But having gone in so hard rhetorically on a mistake, I hardly expect to convince anyone of that. Oh well ...
In light of this I have to amend my claims as follows:
a) The measured trend is slightly less than the trend of the 17 model mean;
b) Just three of eleven measured values lie on the 17 year mean with the rest lying below it;
c) Two measured values (2000 and 2008) lie below the lowest prediction by any model for that year; and
d) No measured value lies on or above the highest predicted value for any year.
Clearly I jumped the gun (and should probably have known better. The Earth is in fact warming slower than model projections. It is just marginally slower, slow enough that I needed to lay the full 35 year trend of measured valued along the mean to ascertain the trend was slower. Consequently I still consider Happer's claim unwarrented. But having gone in so hard rhetorically on a mistake, I hardly expect to convince anyone of that. Oh well ...
-
lord_sidcup at 22:29 PM on 27 May 2011Even Princeton Makes Mistakes
Happer is the first I have come across to claim wine was exported from England in the Medieval period. Is there really going to be any reliable documentary evidence of English wine exports 1000 years ago? Smacks of exaggeration and hyperbole to me. -
Eric the Red at 21:54 PM on 27 May 2011Can we trust climate models?
Scaddenp, I agree that the climate responds to the forcings of the time. The LIA in the SH was probably mitigated by the vast stretch of ocean. Going forward, the climate will also respond to the strongest forcings. If that becomes CO2, then I would expect to see substantial warming. If we observe a strong solar minimum, then I would expect that to dominate. The fact that the models reflect the past has little to do with the accuracy of the models, but is a reflection of past temperature inputs into the models. Afterall, who would design a model which did not accurately reflect the past. The true test of the models will come in future temperature projections and observations. Unfortunately, this may take several years (decades). I also agree that temperatures are not accelerating. However, I would add that recently temperatures are neither increasing nor decreasing; 2010 being sandwich between a cold (relative) 2009 and start of 2011. Is this the start of a long-term decrease as GC maintains, or simply a blip in a long-term increase? Stay tuned, and watch nature, not tv. -
Berényi Péter at 21:52 PM on 27 May 2011Temp record is unreliable
#208 Tom Curtis at 14:01 PM on 27 May, 2011 With the exception of water near the West Antarctic Peninsular, and hence Orcadas Base, the anomaly south of about 60 degrees is not shown in the anomaly map you are objecting to. But it is shown in the accompanying "zonal mean" graph (with no error bars whatsoever). Your remark, therefore, is without substance.
-
Tom Curtis at 21:34 PM on 27 May 2011Even Princeton Makes Mistakes
Dr Jay Cadbury, Phd, consider Happer's claim that:"The supposed reason for limiting it is to stop global warming—or, since the predicted warming has failed to be nearly as large as computer models forecast, to stop climate change."
Again, do you agree with Happer that measured warming has failed to be nearly as large as that predicted by computer models? And do you know, or can you obtain the citation for this claim? For myself, I take a fairly simplistic approach to claims like this. Specifically, I took a magnified plot of the temperature predictions for the A2 scenario from the IPCC AR4. (Actual image taken from the PDF version for higher resolution.) I then took a plot of the Gisstemp global temperature index from Tamino. Noting that the predictions were relative to the 1980-1999 mean, I plotted that onto Tamino's graph (redline) and also added some additional lines (yellow) to aid alignment. Having aligned the to graphs to ensure correct scale, I then merged them, producing the following result: Having done so I noticed several things:
a) The trend line of actual measurements is greater than the trend line of the 17 model mean predictions;
b) Just two measured values (2000 and 2008) lie below the 17 model mean;
c) No measured value lies on or below the lowest predicted value for that year by any model; and
d) 4 out of 11 years lie on or above the highest model prediction for that year by any of the 17 models.
I find it difficult to reconcile these facts with a claim that measured warming has failed to be nearly as large as the predicted warming. In fact, on the contrary, I find it impossible to interpret this as being anything other than measured temperatures exceeding the model predictions both as to values and with regard to the trend. The Earth is warming faster than the models predicted, not slower.
In other words, Happer has stated the complete reverse of the truth.
Considering your spirited defence of Happer's inexactitudes, can you please explain just when it is that you are entitled to not just your own opinions, but your own facts - once you have a PhD? Or only after being appointed to a chair at Princeton?
PS: I apologise for the difficulty reading measured values in the area in which the graphs overlap, and unfortunate by product of the graphical method used. I'm sure one of the clever programming literate people around here would find it handy to reproduce the graphs from scratch for greater clarity.)
Having done so I noticed several things:
a) The trend line of actual measurements is greater than the trend line of the 17 model mean predictions;
b) Just two measured values (2000 and 2008) lie below the 17 model mean;
c) No measured value lies on or below the lowest predicted value for that year by any model; and
d) 4 out of 11 years lie on or above the highest model prediction for that year by any of the 17 models.
I find it difficult to reconcile these facts with a claim that measured warming has failed to be nearly as large as the predicted warming. In fact, on the contrary, I find it impossible to interpret this as being anything other than measured temperatures exceeding the model predictions both as to values and with regard to the trend. The Earth is warming faster than the models predicted, not slower.
In other words, Happer has stated the complete reverse of the truth.
Considering your spirited defence of Happer's inexactitudes, can you please explain just when it is that you are entitled to not just your own opinions, but your own facts - once you have a PhD? Or only after being appointed to a chair at Princeton?
PS: I apologise for the difficulty reading measured values in the area in which the graphs overlap, and unfortunate by product of the graphical method used. I'm sure one of the clever programming literate people around here would find it handy to reproduce the graphs from scratch for greater clarity.)
-
les at 21:33 PM on 27 May 2011If It's Not Sex, Drugs, and Rock 'n Roll, what is it? Creativity maybe?
6/7 some interesting thoughts... Just reviewing Paris '68 I noticed an interesting slogan (and the French are good at slogans!) "The future will only contain what we put into it now." Maybe we need a version of that now? "The future atmosphere will contain what we put into it now." -
Eric the Red at 21:32 PM on 27 May 2011Even Princeton Makes Mistakes
I feel compelled to comment on the vikings in Greenland (maybe its a name thing). I seriously doubt anyone would believe that Greenland was "green" during the Viking colonization, except for small tracts of land along the southern coasts, and as Tom points out, are still green today. The ice cap has been there for perhaps a hundred thousand years (maybe more), and likely to remain so for a similar era (maybe less). In short, the entirety of human history, as Tom stated. Records during the viking era are sketchy at best, but most indicate increases in sea ice extent as the major reason for the demise of the viking settlements. The vikings in Greenland required constant supplies which waned (and eventually ceased) with the increasing sea ice. Anecdotal evidence, along with studies like the following all point in this direction: https://www.cfa.harvard.edu/~wsoon/DanBotkin08-d/MorosAndrewsetal06-DriftIceHolocene.pdf I know nothing about English wines, avoiding them like the plague. -
witsendnj at 21:16 PM on 27 May 2011If It's Not Sex, Drugs, and Rock 'n Roll, what is it? Creativity maybe?
I love the idea of transformation through theatre. But the premise that the '60's were fueled by fun of any sort seems dubious or at least overly simplistic to me, having lived through that era in my formative years. I remember quite a bit of outrage, fear, and rebellion (and far too much fun too!). And as you pointed out, currently - at least for the wealthiest citizens of earth who have the largest footprint whether it is carbon or other sorts of pollution - there is a smorgasbord of fun to be had already, without any (perceived) sacrifice required. I think it will be nigh impossible to persuade such individuals to convert to more socially responsible forms of entertainment (let alone increase prices by pricing externalities) when it's difficult to compete with the surfeit of artificially cheap toys that mesmerize them now. It's also an uphill battle to convince people to relinquish creature comforts/luxuries for the betterment of the environment in the future when so many of the "leaders" of the green movement do have insanely and inexcusably disproportionate personal impacts. I'm thinking of Arnold Schwarzenegger, who before his latest misogynist embarrassment was supposed to exemplify a green Republican, and yet rather than move to the state capital, he commuted to his duties as governor by private jet. Okay that's an egregious example but there are a number of leaders in the movement who shall remain nameless that fly around the world giving talks, raising funds for their philanthropic organizations and selling their books. Can anyone blame the casual, unenlightened observer for smelling hypocrisy? If there is really a planetary emergency, why don't those who warn of it behave like there is? Given the dire prospects faced by humanity, not to mention every other species subject to our domination and exploitation, I think some sheer terror based on actual, unprecedented events - like the Joplin tornado...the floods in Columbia, Pakistan, Tennessee...and the heatwaves, droughts and wildfires in Texas, Canada, Europe and Russia (and that list is by no means comprehensive) - is in order, and would be more effective. Having said that, I wish I could be an extra in the film! -
quokka at 21:07 PM on 27 May 2011If It's Not Sex, Drugs, and Rock 'n Roll, what is it? Creativity maybe?
I've thought about this quite a bit, having been involved in the anti Vietnam war movement since high school and missing out on conscription by a whisker by being barely too young. Saved by "It's Time" and Labor in 1972. One thing should be fairly obvious is that the prospect of being conscripted and having one's bodily parts rearranged in a stinking unconscionable colonial war in Vietnam certainly focuses the mind and lends a great sense of immediacy. Very important in both Australia and the US, but the outrage was widespread especially in Europe fed by images such as the NLF soldier being dragged by a rope tied around the feet behind an armoured personnel carrier. Or the little girl, naked, fleeing the napalm. This together with a succession of colonial wars such as the French war in Algeria, the struggle for civil rights in the US, an emerging feminist movement, the ever present threat of nuclear war and various events such as the 1968 student uprising in Paris and the Prague Spring and situation was ripe for rejection of the whole stinking setup. Influence of pacificism, internationalism and the left in culture - music , film and literature both fed on the politics and in turn fed back into it. This was a unique confluence of historical circumstances and there is really nothing comparable today. Young people now do not understand how different it was - and not in a good way. For example women were not allowed in public bars in Qld - a situation that is utterly unthinkable today. It should go without saying that trying to produce some echo of the '60s is pretty much doomed to failure. Hansen is absolutely correct - there is ultimately no substitute for feet on the streets. It is not just a matter of protest - it is a matter of exercising countervailing political power to the political power of the Murdochs and fellow travelers. Easy to say and not so easy to do. And it wouldn't half help if popular culture could rise above "Australia's Got Talent". But I think is comes down to something other than this: "I would suggest that far from being trivial, those are some important questions for social scientists to muse over." With all due respects, social scientists have to do a little more than "muse over" the issue. They must be activists as were some of the outstanding academics of the '60s perhaps exemplified by Chomsky. Furthermore, astute political thinking is not really the property of social scientists - as a group they are probably not very good at it and it is sorely needed. One learns also by doing, as well as thinking. @Arkadiusz Semczyszak You reckon 5 million people died AFTER the end the American war on Vietnam? Sources please! -
les at 21:02 PM on 27 May 2011The Stockholm Memorandum
18 - damorbel "Of course they can be experts in multiple disciplines but what is lacking is evidence of their expertise in the 'other' disciplines." OK, so why did you say "Which of these Nobel Prize winners has published on climate matters?"?!?!? As for your new statement - take a look at the biographies; you've a pretty good spread of disciples and even un-obvious things like Rubia's interested in 'other' nuclear fuel systems. More over, they're calling for actions on the issues you list... not proposing policy which, I suppose they feel, is the job of domain specialists. 20 - "a link?" try this one, from the above article http://globalsymposium2011.org/wp-content/uploads/2011/05/The-Stockholm-Memorandum.pdf You will see that this is not just about climate change (I said "core findings" for a reason) So again, why ask: "Which of these Nobel Prize winners has published on climate matters?"? Especially if you now feel they should have expertise in, some 'divers fields' other than what they have already... bit confusing. -
damorbel at 20:39 PM on 27 May 2011The Stockholm Memorandum
Re #18 les you wrote:- "Certainly they've agreed with the core findings" I see nothing to justify this; do you have a link? -
damorbel at 20:37 PM on 27 May 2011The Stockholm Memorandum
Re #21 & #2 You asked "Why do they have to be experts in just one particular disceplen?!?!?". Of course they can be experts in multiple disciplines but what is lacking is evidence of their expertise in the 'other' disciplines. If these well respected Symposium participants are to contribute successfuly to the stated goals of the Symposium; which are, let me remind you:- 1/ Reaching a more equitable world; 2/ Managing the climate - energy challenge; 3/ Creating an efficiency revolution; 4/ Ensuring affordable food for all; 5/ Moving beyond green growth; 5/ Reducing human pressures; 6/ Strengthening Earth System Governance; 8/ Enacting a new contract between science and society. What is to be provided really should be more than just a cursory references to (justified) reputations in their diverse fields. They are not alone in having such goals and if the Symposium is to be useful then much more is needed than acknowledgement of past success in (sometimes) rather recondite research. -
Darcindora at 18:58 PM on 27 May 2011If It's Not Sex, Drugs, and Rock 'n Roll, what is it? Creativity maybe?
Creativity in all its forms is a great motivator for change, with a touch of subversive and maybe a smidgeon of cool for good measure -
Rob Painting at 18:26 PM on 27 May 2011If It's Not Sex, Drugs, and Rock 'n Roll, what is it? Creativity maybe?
Mandas -So which one isn't fun? And. -
Riccardo at 17:38 PM on 27 May 2011Roy Spencer’s Latest Silver Bullet
Arkadiusz Semczyszak maybe you didn't notice, Dr. Bickmore reproduced Spencer's work. As for your point 1, then, it's Spencer that should eventually be blamed. As for point 3, Dr. Bickmore showed that a flawed methodology produced a wrong result. Should have, by chance, produced the correct results, it is still flawed. -
Arkadiusz Semczyszak at 17:14 PM on 27 May 2011Roy Spencer’s Latest Silver Bullet
Post this on (4.) the SkS is here -
mandas at 17:14 PM on 27 May 2011If It's Not Sex, Drugs, and Rock 'n Roll, what is it? Creativity maybe?
".....The 1960’s arguably were powered by Sex, Drugs, and Rock ‘n Roll....One or two of those can be legitimately called fun...." So which one isn't fun? -
Arkadiusz Semczyszak at 17:07 PM on 27 May 2011Roy Spencer’s Latest Silver Bullet
Okay. Briefly. 1. Your criticism is "too hot" - too poor in the reference - do not exhaust the subject, in one word: biased. 2. Simple models are: OHC - climate sensitivity - the better. 3. Result (final conclusion) Spencer is correct - it really: similar to Barreiro and Masina 2011. What is your opinion about this paper and Xie and Vallis 2011? 4. What would you have found errors in the analysis cited by me (conclusions regarding OHC - climate sensitivity - are similar to those of Spencer)? -
les at 16:44 PM on 27 May 2011The Stockholm Memorandum
20 - Shoyemore I kind-a think it's something more than a "Brains Trusts who have considered the evidence" and agree / disagree with the findings. Certainly they've agreed with the core findings - but their focus seems to be more about what to do. And that takes a multi-disciplinary approach, lead by folks with some degree of authority across the board. This is the point damorbel decided to ignore, which is why s/he couldn't answer my question. -
shoyemore at 16:14 PM on 27 May 2011The Stockholm Memorandum
@Jeff T #16 I look upon the Stockholm Nobel Laureate Symposium as the ultimate scientific unbiased jury. They certainly cannot be accused of "grant whoredom", and could all retire comfortably on their money and reputations, which are unimpeachable. Unless they are all raving socialists, which I doubt. They are also men and women of formidably independent intellects from different disciplines, so "groupthink" can hardly apply. The amount of agreement among the Nobel holders (among whom are at least two atmospheric physicists) should make any climate science contrarian think again, but probably won't. So this is not an Appeal to Authority. It reports Findings of one of the world's foremost Brains Trusts who have considered the evidence -
moctical at 15:54 PM on 27 May 2011If It's Not Sex, Drugs, and Rock 'n Roll, what is it? Creativity maybe?
Stephan, you might want to familiarize yourself with generational theory of the saeculum e.g. "The Fourth Turning" by William Strauss and Neil Howe. They breakdown Anglo-American histroy into four recurring phases, perpetually fuelled by four recurring generational archetypes. According to the theory, in the 60s and 70s we were in an Enlightenment phase where we undergo an inner revolution. At present we've just entered the Crisis phase during which there will be an 'outer' revolution where old systems will be replaced by new (following some form of struggle). The outcome is not necessarily positive or negative, only that some revolution will occur. -
Bern at 15:30 PM on 27 May 2011The Stockholm Memorandum
Stevo: that's a good point - I haven't noticed any mention of this symposium in the MSM at all, only on RealClimate & here. The only MSM coverage of global warming here lately has been about what a great big new tax it'll be, and how much it'll cost, and how it'll ruin the entire economy if we wean ourselves off the fossil fuel addiction. Actually, two or three articles I read in today's newspapers seemed to take it as given that the only "solution" to CO2 emissions is to switch from coal to gas. -
Stevo at 14:06 PM on 27 May 2011The Stockholm Memorandum
Jeff T @ 16. I agree that, strictly speaking, this page may be off topic for this site, it might be worth keeping it here as a reminder to us that there is some activity happenning in the public sphere that is not following a 'skptical' adjenda. There is every chance that this symposium will produce decisions or ideas that will be relevant to spreading science based reasoning to the greater public (i.e. non-scientists like myself) and Its my hope that this site will report on them because I'm not very confident that the mainstream media will. -
Tom Curtis at 14:01 PM on 27 May 2011Temp record is unreliable
Berényi Péter @206:"Come on. Until 1943 there was a single GHCN station south of 60S, BASE ORCADAS (-60.75 -44.72). Therefore the huge 1950-1980 positive temperature anomaly in the south (relative to 1919-1949) is entirely believable, isn't it?"
We should also note that: 1)There was also a very large whaling fleet operating in Antarctic waters; and 2)With the exception of water near the West Antarctic Peninsular, and hence Orcadas Base, the anomaly south of about 60 degrees is not shown in the anomaly map you are objecting to. Your objection, therefore, is without substance. -
Tom Curtis at 13:50 PM on 27 May 2011Temp record is unreliable
Berényi Péter @197, the diurnal temperature range data for Australia are taken from the Australian high-quality climate site network, which has been vetted for the quality of the stations, with stations rating poor(4) or very poor(5) on a five point scale having been removed from the network. I have seen some attempts by Australian deniers to question the network, and they are pathetic. Indicative of how desperate they are, they have argued that one outback site should be classified as urban because it is located near some graded runways, ie, because it is near (within 50 meters) of exposed dirt in an area which is 80% exposed dirt. is a discussion of another site they considered to be "urban". Had there been substantial issues to raise, I'm sure the deniers would have latched on to them. By inference, therefore, the genuine efforts of the Bureau of Meteorology to maintain high quality meteorological data have paid of. Further, aerosol optical depth is not well quantified, and indirect aerosol effects on cloud albedo are even less well quantified, but aerosol emissions are well known. Therefore, whatever the net aerosol forcing for a given aerosol load, we know that it increased from the 1950's through to the 1970's, decreased there after, and has been increasing again over the last decade:
-
adelady at 13:43 PM on 27 May 2011If It's Not Sex, Drugs, and Rock 'n Roll, what is it? Creativity maybe?
I like the mall idea. My longstanding preference is for an image from a more innocent past is something like The Jetsons. The unstated technological marvel there was, of course, the 'too cheap to meter' promise of nuclear power. But the idea of clean skies (not necessarily including flying cars) and an abundant lifestyle is perfectly in accord with ideas of both modernity and clever use of resources. -
Tom Curtis at 12:53 PM on 27 May 2011Even Princeton Makes Mistakes
Dr Jay Cadbury, PhD, as you are so determined to defend Happer's pontifications, perhaps you could consider the following claim:"There have been many warmings and coolings in the past when the CO2 levels did not change. A well-known example is the medieval warming, about the year 1000, when the Vikings settled Greenland (when it was green) and wine was exported from England."
(My emphasis) Given the authority you obviously attribute to Happer, perhaps you could point out whether you agree with him that: 1) That Greenland was green in the MWP (or at any time in human history); and 2) England exported wines in the MWP. As you are also Happer's friend, perhaps you can elicit from him his sources of this information. For my part, I believe that Greenland has been covered by an icecap for the entirety of human history, and that describing the MWP as the period when Greenland "was green" because at that time, as todady, a few square kilometers on the southern coast are green on a seasonal basis is misleading (to say the least). I also believe that while England had 42 vinyards at the time of the Domesday Book, that was partly because wine preservation was rudimentary so that the superior wines of France and Spain all to easily turned to vinegar when transported to England, and that consequently, there would be no export market for the inferior English wines transported the other way. Absent evidence to the contrary, it appears to me that Happer has simply embellished the well known reports of MWP English wines because, as is well known, there are over 300 commercial Engish vinyards today, not to mention Sweden, Scotland, and soon to be, Norway. Given knowledge of modern viniculture in England, 42 vineyards really isn't that impressive, but if they were exported, well, that's something you can base some spin on. So exported they were, for need trumps truth every time in spin. (Or so it seems to me.) Now, you appear to have been defending the right of Happer to make up his own facts because he has a PhD, and lectures at Princeton. If that is not your claim, then we can expect clear citations proving MWP wine exports from England. -
Jeff T at 11:58 AM on 27 May 2011The Stockholm Memorandum
Outside of introducing the interesting term "anthropocene" for those who missed it at Real Climate, this post seems off-topic for Skeptical Science. It doesn't present or discuss any evidence; it is just an appeal to authority. SkS usually does much better. -
Mike Lemonick at 11:28 AM on 27 May 2011Even Princeton Makes Mistakes
Rob@97 says: "Mike @ 95... Princeton can't screen how a tenured professor chooses to represent his credentials but I'd bet dollars to doughnuts there are some meetings going on at Princeton following Happer's piece that are very close to coming to fisticuffs. Happer has clearly chosen to make a public and highly politicized statement on behalf of the George C Marshall Institute BUT chosen to identify himself using his Princeton credentials (and curiously omitting his GMI connection). Princeton would have every right to be utterly furious about this kind of activity. It'll be curious to see if the university responds publicly in some manner." It won't. Happer's statements are the equivalent of someone who keeps passing gas at a party. It's embarrassing, and you'd be happier if they left, but you just politely ignore it. Happer's Princeton credentials are genuine, and he has every right to use them, even though it makes sensible people cringe. Really, you might as well give up on this, unless you like banging your head against a wall. -
Berényi Péter at 11:26 AM on 27 May 2011Temp record is unreliable
[DB] More cherries for BP Come on. Until 1943 there was a single GHCN station south of 60S, BASE ORCADAS (-60.75 -44.72). Therefore the huge 1950-1980 positive temperature anomaly in the south (relative to 1919-1949) is entirely believable, isn't it?Response:[DB] Curious, that the temperature records show an inexorable rise every single year, isn't it? ;)
Let us not focus on the few cherry-flavored flat or declining spots lest we miss that overall rising signal in the noisy background:

[Source]
-
scaddenp at 11:12 AM on 27 May 2011Antarctica is gaining ice
The ice is not melted by conductive energy transfer so specific heat is irrelevant. Melting is from radiative energy transfer - ie the energy is the from sun and more of it is trapped because of the CO2. Perhaps you should do the math. What does an extra 1.5W/m2 (global annual average all forcing) give you? Also warmer water onlapping Antarctica increases calving which I believe remains the main source of ice loss in the Antarctic. -
adelady at 11:10 AM on 27 May 2011Antarctica is gaining ice
Rosco, sorry I hit the button too soon. Melting. The issue is that much of the ice does not melt in situ. It thins, weakens and breaks off and the ocean transports it away in the form of icebergs. These may not melt for quite a long time after they've subtracted their bulk from their source glacier. -
adelady at 11:06 AM on 27 May 2011Antarctica is gaining ice
Rosco, see the Intermediate version of this post. The land ice on Antarctica does not 'melt' by direct heating from air or insolation so much as it loses the balance it formerly had between gains and losses. The losses are (mainly) attributable to the heat now in the oceans, accumulated over the last couple of centuries. The ocean is taking more from the edges than the icecap and glaciers can accumulate at their centre/top.
Prev 1709 1710 1711 1712 1713 1714 1715 1716 1717 1718 1719 1720 1721 1722 1723 1724 Next


