


 Arguments


Recent Comments
Prev 1726 1727 1728 1729 1730 1731 1732 1733 1734 1735 1736 1737 1738 1739 1740 1741 Next
Comments 86651 to 86700:
-
Hockey stick is broken
Bud, This is getting ridiculous. You were asked about global warming, so now you produce a paper about warming in China? What's more, the timeframe referenced for the warm period in that paper is substantially different from the time period in your first paper. The Icelandic warming is timed around 1000 A.D., while the Chinese warming is around 200 A.D. These are different warming events localized to different regions Bud. Please show us some truly global evidence and stop spamming this thread with irrelevant and outdated papers. -
Bern at 10:05 AM on 17 May 2011Is the CRU the 'principal source' of climate change projections?
Actually, I think nanjo's comment about OHC not increasing is best explained by this post over at Tamino's blog. In short: AGW denier posts an article at WUWT which cherry picks data to make it seem like OHC predictions are completely wrong, when they're actually pretty good. -
Bud at 10:00 AM on 17 May 2011Hockey stick is broken
Dana. This 2002 paper using data from China confirms period AD 200 that is "The peak at about AD 200 represents the warmest stage of the last two millennia, temperature was even higher than during the 20th century." "General characteristics of temperature variation in China during the last two millennia," GEOPHYSICAL RESEARCH LETTERS, VOL. 29, NO. 9, 1324, 10.1029/2001GL014485, 2002 Bao Yang Institute of Cold and Arid Regions Environmental and Engineering, Chinese Academy of Sciences, China Achim Braeuning Institute for Geography, University of Stuttgart, Stuttgart, Germany Kathleen R. Johnson Department of Earth and Planetary Science, University of California, Berkeley, CA, USA Shi Yafeng Institute of Geography and Limnology, Chinese Academy of Sciences, 210008, Nanjing, China http://www.ess.uci.edu/~johnsonlab/files/Download/Yang%20et%20al.,%202002.pdfResponse:[DB] Please slow down the linear posting of studies until you have properly discussed the ones you have already posted. For example, e countered your Huang et al 1997 with Huang et al 2008 which effectively overcomes your position altogether.
-
Hockey stick is broken
Bud >These scientists find that Iceland was warmer. So what? The topic of discussion is global warming. Do you have up to date evidence that the globe was warmer that the present (meaning 2000-2010 not the 90's)? More importantly, why would that even be relevant to your argument? The key question is the physics that underly the warming and what that means for future temperature trends. -
Marcus at 09:54 AM on 17 May 2011Special Parliament Edition of Climate Change Denial
Sorry if this is OT but, as a scientist myself (though not a climate scientist), I get *deeply* offended by implications that scientists in the public sector are part of some big "Gravy Train". Trust me, no-one working in the public sector is getting rich, & research grants-be it from the public or private sector-are incredibly hard to come by. Now, with my level of expertise, I could easily move into a big Bio-tech firm & earn a six figure salary-with about half of the headaches, but I *choose* to work in a *public* institution that has a reputation for *good* science. Now, if we want to look at Gravy Trains, we really need look no further than the bevy of most vocal critics of AGW-politicians from regions currently dependent on coal or oil extraction; politicians who get nice kick-backs from lobbyists in the fossil fuel industry; so-called "think-tanks" who also get a hefty amount of money from the fossil fuel industry & Mainstream Media Outlets who are also heavily dependent on advertising revenue from a number of big business entities-including the fossil fuel industry. Anyone want to place bets on which group I'd think are less likely to be influenced by motives of personal gain? As the sayings go-"Que Bono?" (Who Benefits?) and "Follow the Money". -
Bud at 09:46 AM on 17 May 2011Hockey stick is broken
Dana. I pretend nothing. These scientists find that Iceland was warmer. "Once again" meant that they are by no means the only scientists to publish of warmer periods. Since you claimed "There are no millenial reconstructions which show the MWP hotter than present" I gave you a reference to the August 1997, Huang, Pollack, and Shen paper in Geophysical Research Letters. Here's another reconstruction. There's a nice graph on this page: http://www.scotese.com/climate.htm Bibliography here: http://www.scotese.com/scotesepubs.htmResponse:[DB] Please see e's pre-emptive reply to you at 80 above.
-
Hockey stick is broken
Bud @77, Huang et. al. have an updated paper here, published in 2008. From the abstract (emphasis mine): "We present a suite of new 20,000 year reconstructions ... all referenced to the 1961–1990 mean of the instrumental record. ... The reconstructions show the temperatures of ... the maximum of the MWP at or slightly below the reference level ... and end-of-20th century temperatures about 0.5 K above the reference level. Note that they found that end-of-20th century temperatures were warmer than the MWP, and keep in mind that the 21st century is known to be warmer still. Also note the discussion of their previous paper: "Below we describe their respective datasets, and show why the results of HPS97 cannot be used for comparing MWP warmth to the 20th century." So Bud, you readily cited the work of these particular scientists when you felt their conclusions agreed with yours. Are you going to stick with them now that their conclusions differ? Are you actually willing to change your point of view given new evidence, or are you just going to cherry pick the versions that you agree with? -
JMurphy at 09:23 AM on 17 May 2011It's the sun
Cole, your linked paper starts : The variable Sun is the most likely candidate for natural forcing of past climate change on time scales of 50 to 1000 years. And ends : We note that our conclusions can not be tested on the basis of the last 30 years of solar observations because, according to the proxy data, the Sun was in a maximum plato state in its longterm evolution. All recently published reconstructions agree well during the satellite observational period and diverge only in the past. This implies that observational data do not allow to select and favor one of the proposed reconstructions. Therefore, until new evidence become available we are in a situation that different approaches and hypothesis yield different solar forcing values. Our result allows the climate community to evaluate the full range of present uncertainty in solar forcing. Can you explain in your own words (i.e. not from WUWT) what you get from that paper ? -
dana1981 at 09:17 AM on 17 May 2011Hockey stick is broken
Bud #79 - and I quote:"Once again we have a science paper indicating warmth of the more distant past clearly exceeded that of the recent past....I did NOT say Ran, L., Jiang, H., Knudsen, K.L. and Eiriksson was global."
Stop playing games. If you want to argue that the the North Icelandic Shelf was hotter during the MWP than now, then say so. Don't pretend we're misrepresenting you when you talk about "warmth" in a hockey stick (northern hemisphere) temperature discussion. -
dana1981 at 09:12 AM on 17 May 2011Hockey stick is broken
Bud - the study you reference excluded data from the 20th century, aside from other problems. See the Notes section here.Response:[DB] Dana, I'm not sure the Notes sections are viewable to the public. If that is the case, the gist is this:
Summary and Conclusions [25]
The 20,000 year reconstructions presented in HPS97 utilized observations contained in a database of terrestrial heat flux measurements.
Data from the depth range 0– 100 meters, the depth range where most of the information about 20th century climate change resides, were excluded from the reconstruction because of noise considerations.
Thus the reconstructions derived from that dataset cannot be used to compare the Medieval Warm Period to changes taking place in the 20th century.
-
Bud at 09:06 AM on 17 May 2011Hockey stick is broken
Sorry, I did NOT say Ran, L., Jiang, H., Knudsen, K.L. and Eiriksson was global. No cherry picking by me. Knee jerk reactions by some of you though. -
dana1981 at 09:02 AM on 17 May 2011It's the sun
I'll probably do a post on this paper. To be fair, if the reconstruction is correct (which I don't think is plausible), it does suggest a very low climate sensitivity, so you could argue that climate models are wrong in that sense. Sensitivity would have to be in Spencer/Lindzen territory, below 1°C for 2xCO2 if this reconstruction is right. I don't think it's plausible, but should make for an interesting post. -
Bud at 08:57 AM on 17 May 2011Hockey stick is broken
@dana: In August 1997, Huang, Pollack, and Shen. Geophysical Research Letters. Using the borehole data, they reconstructed the temperature in the last 20,000 years. Their results are three curves based on different degrees of variation. Shown are a warm holocene climate optimum, a warm and pleasant period around 8,000 years ago that lasted for about 3 millenia, a cool period 2000 years ago followed by the medieval warm period 800 years ago which was also warmer than the present. http://www-personal.umich.edu/~shaopeng/97GL01846.pdf I will respond at length on physics elsewhere, so that perhaps I won't be deleted by the monitor of this blog.Response:[DB] Comments that are on-topic and formulated to comply with the Comments Policy receive no moderation. This, as always, applies to all participants here.
-
Stephen Baines at 08:47 AM on 17 May 2011It's the sun
Cole, Dana's right. I'm not sure you read that paper. In fig 4 there no net change in solar forcing since 1950. And why is the 30 year lag relevant? And what justification for 30 year lag other than " the oceans are vast and deep" do you have? -
Stephen Baines at 08:35 AM on 17 May 2011Hockey stick is broken
Sigh. I wonder if they read these things before they post. -
Albatross at 08:24 AM on 17 May 2011Hockey stick is broken
Sorry, I of course meant to say "GISP2", not "GIPS2" -
Albatross at 08:10 AM on 17 May 2011Hockey stick is broken
Dana, "For this paper, the North Icelandic Shelf does not represent the entire hemisphere or globe." Exactly--"skeptics" cherry picking again. They seem to never learn from their mistakes--i.e., the misrepresentation of the GIPS2 data. Also a recent paper by Thibodeau et al. (2010) shows that: "We conclude that the 20th century warming of the incoming intermediate North Atlantic water has had no equivalent during the last thousand years. " Just saying.... -
dana1981 at 07:58 AM on 17 May 2011It's the sun
Cole -"This paper shows the Models underestimate solar forcing by up to six times."
It does no such thing. The paper suggests that other TSI reconstructions underestimate the amplitude of TSI changes in the past. It has very little to do with climate models, and in fact specifically notes that their TSI estimates over recent decades, during which we have good measurements, are no different than previous TSI reconstructions. -
dana1981 at 07:54 AM on 17 May 2011Hockey stick is broken
Bud - what do you mean "once again"? There are no millenial reconstructions which show the MWP hotter than present. For this paper, the North Icelandic Shelf does not represent the entire hemisphere or globe. And the study concludes the sea surface on the North Icelandic shelf "was not as warm during the last century as during the Medieval Warm Period." It's not the last century anymore. And finally, the anthropogenic global waming theory is based on physics, not on being "unprecedented". The fact that the planet warmed naturally in the past doesn't change the physics that humans are causing warming now. -
pbjamm at 07:51 AM on 17 May 2011Hockey stick is broken
Bud@everywhere See here and here. You are exploring well charted ground without consulting the maps or the natives. -
Bud at 07:45 AM on 17 May 2011Hockey stick is broken
Once again we have a science paper indicating warmth of the more distant past clearly exceeded that of the recent past, with the peak temperature of the MWP exceeding that of the current period by about 0.6°C, or about the same temperature increase that is expected by a doubling of CO2 concentration. This indicates there is nothing unusual, unnatural or unprecedented about the earth's current level of warmth in this particular part of the planet. Ran, L., Jiang, H., Knudsen, K.L. and Eiriksson, J. 2011. Diatom-based reconstruction of palaeoceanographic changes on the North Icelandic shelf during the last millennium. Palaeogeography, Palaeoclimatology, Palaeoecology 302: 109-119. -
Cole at 07:35 AM on 17 May 2011It's the sun
This paper shows the Models underestimate solar forcing by up to six times. http://www.aanda.org/index.php?option=com_article&access=standard&Itemid=129&url=/articles/aa/abs/2011/05/aa16173-10/aa16173-10.html It makes perfect sense for us to take time to cool the oceans are vast and deep so 30 years of lag time are more than exeptable. -
Stephen Baines at 07:17 AM on 17 May 2011Is the CRU the 'principal source' of climate change projections?
Reading between the lines a bit, but I think nanjo seems to be arguing that CO2 won't increase according to the projections because the ocean is cooling. This argument could be (not certain, though) a variation on the Co2 is coming from the ocean meme. That is, the post industrial increase in CO2 is not from humans but from the ocean which is warming for other inscrutable reasons. Wow. Talk about a house of cards. -
dana1981 at 06:48 AM on 17 May 2011Newcomers, Start Here
Cole, you seem to believe "if I read it on the interwebs and want it to be true, then it must be true." -
dana1981 at 06:44 AM on 17 May 2011Is the CRU the 'principal source' of climate change projections?
nanjo - wow, I don't even know where to begin. I guess a good place is to point out that it's "Mauna Loa", not "Lao". By "assumes" I believe you mean "theorizes". Regardless, the figure you're referencing does not depend on temperature changes. Your claim about OHC diverging from the models, aside from being off-topic, is also wrong.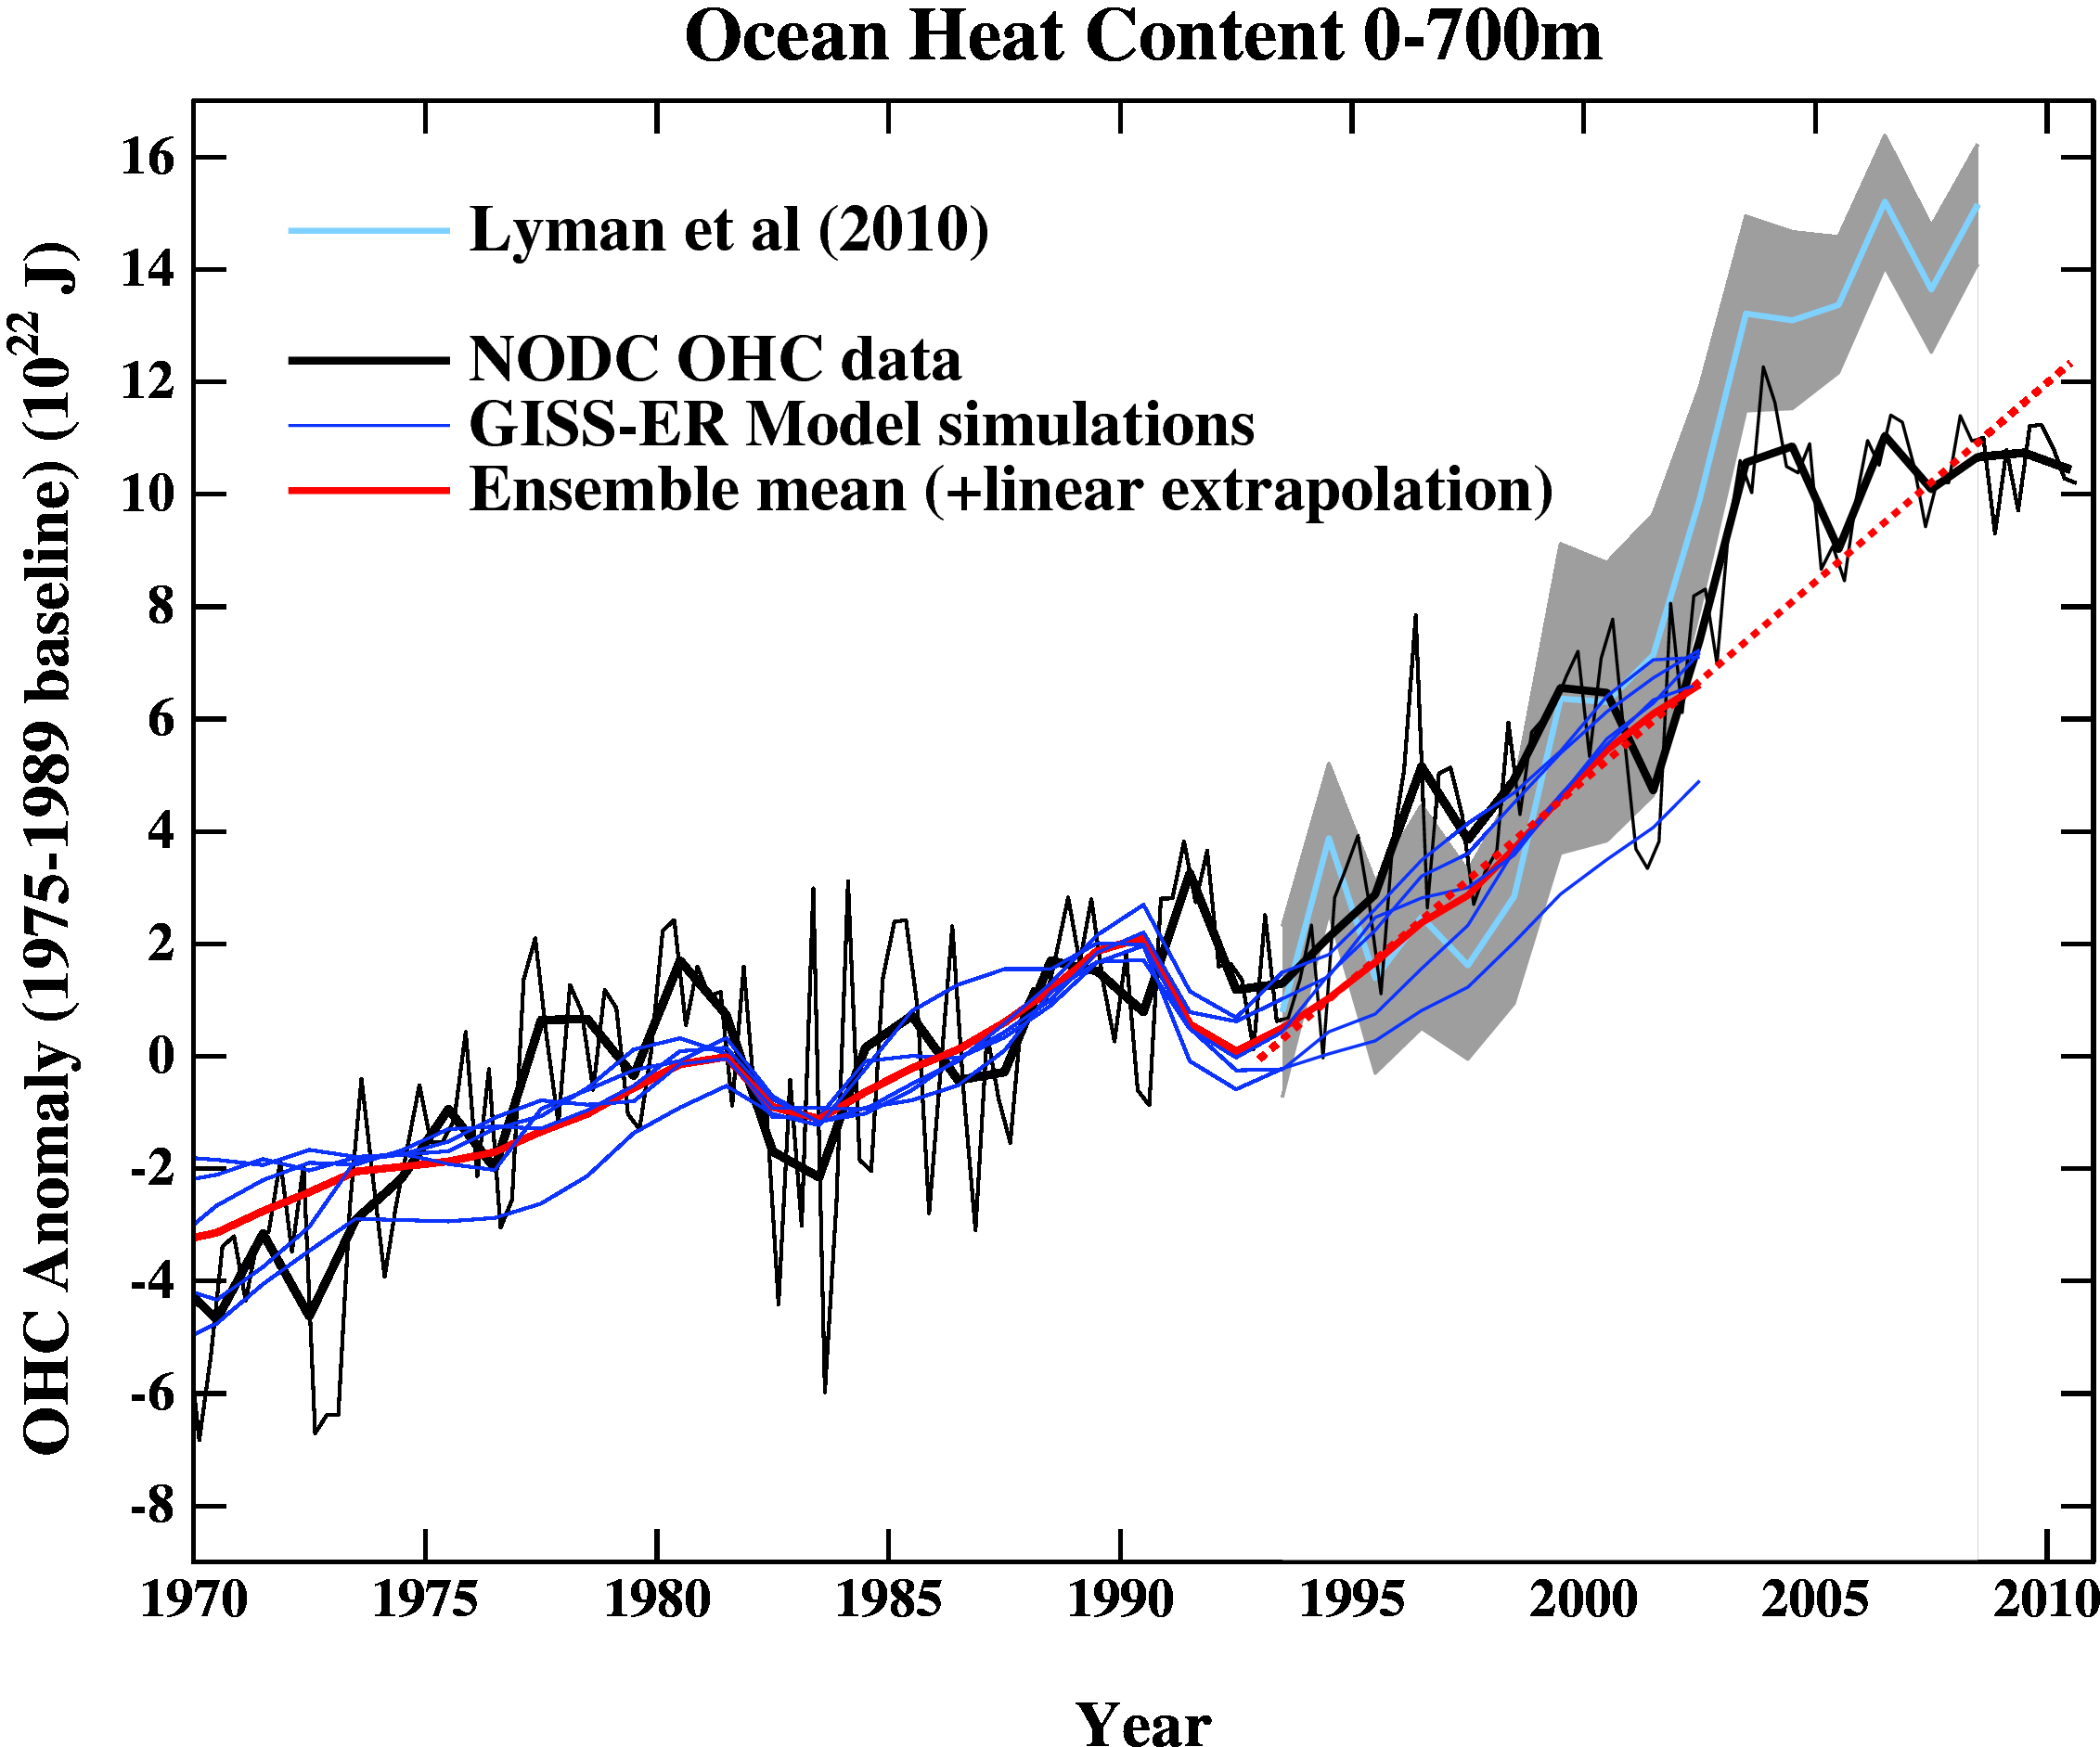
"when you write articles like this, it makes the sceptics laugh."
"The sceptics" should probably do a little research before laughing at others. That way they wouldn't look so foolish. -
DSL at 06:44 AM on 17 May 2011Is the CRU the 'principal source' of climate change projections?
najo: huh? Why are those four points necessary pretext for a graph showing forecasts of CO2 concentration? And where have you been watching OHC? -
Cole at 06:42 AM on 17 May 2011Newcomers, Start Here
Hey there. I do not believe that CO2 drives climate and I have many good reasons such as.... Paleoclimatology, http://www.biocab.org/carbon_dioxide_geological_timescale.html The IPCC underestimates Solar forcing by up to six times... http://www.aanda.org/index.php?option=com_article&access=standard&Itemid=129&url=/articles/aa/abs/2011/05/aa16173-10/aa16173-10.html Doctoring of Data to show alarmist results (straight from Forbes if you've got a problem with it you are more than welcome to attempt to sue them) http://blogs.forbes.com/jamestaylor/2011/05/11/nasa-funded-group-doctors-sea-level-data/ Vs. Real world Data http://www.jcronline.org/doi/abs/10.2112/JCOASTRES-D-10-00157.1 AGW is based on increasing downwelling radiation, while over the 14 years of this study, CO2 increased 5% but Downwelling radiation decreased... http://journals.ametsoc.org/doi/abs/10.1175/2011JCLI4210.1 Predictions repeatedly fail http://environment.about.com/od/globalwarming/a/envirorefugees.htm The top Japanese experts thing AGW is no better than Astrology... http://www.theregister.co.uk/2009/02/25/jstor_climate_report_translation/ James Hansen just put out a paper admitting that climate models greatly exaggerate man made global warming... http://www.climatechangedispatch.com/home/8992-james-hansen-admits-man-made-global-warming-has-been-greatly-exaggerated-by-climate-models And Solar scientists don't believe in AGW...In fact it seems mostly only Climate scientists do... http://fullcomment.nationalpost.com/2010/05/21/its-the-sun-stupid/ So there you have it, I think we've been paying too much attention to the cries of an infant science while mature ones tell us to hold off...Response:[DB] Quite frankly, your comment betrays a lack of knowledge of the science of climate change, which is well-discussed here at Skeptical Science on many hundreds thousands of threads.
Please use the Search function to find individual threads for each of your points, such as CO2 Is Not The Only Driver Of Climate. As constructed, your comment is essentially a Gish Gallop thus needing no refutation.
If anyone wants to respond to one of Cole's points, please do so on a more appropriate thread with a pointer here. Thanks!
-
DSL at 06:33 AM on 17 May 2011Special Parliament Edition of Climate Change Denial
Wouldn't work, KR--there's that whole sand thing protecting the Congressional noggins. -
nanjo at 06:22 AM on 17 May 2011Is the CRU the 'principal source' of climate change projections?
when you are showing that forecasts for measured CO2 at the Mauna Lau site, you should point out 1: the CO2 model assumes that increasing CO2 causes the increase in temp ( the basic AGW model ) 2: increase in atmospheric temps will be as the IPCC models state 3: ocean outgassing is affected by the atmospheric temps and OHC 4: Ocrean OHC is assumed to be as IPCC models state I have been watching OHC. It is diverging from the model forecast, pretty badly. Nothing we assumed in AR4 is coming true in that front. Kevin Ternbirth might one day say, "It is a travesty we cannot explain that" and the effect of atmospheric temp on outgassing will be minimal. Most probably that part of the models has to be revisited, in near future when you write articles like this, it makes the sceptics laugh. -
KR at 06:19 AM on 17 May 2011Special Parliament Edition of Climate Change Denial
pbjamm - "John, congratulations on the book. Can you make a special US Congress Edition? " Agreed, John. And can you deliver it by (ahem) dropping each copy onto their heads from a great height? -
pbjamm at 06:12 AM on 17 May 2011Special Parliament Edition of Climate Change Denial
Bud is repeating himself. This is the same discussion that took place on the Infographic thread. At least it was somewhat on topic there. John, congratulations on the book. Can you make a special US Congress Edition? -
Rob Painting at 06:11 AM on 17 May 2011Drought in the Amazon: A death spiral? (part 1:seasons)
Albatross - thanks, but I don't have time to correct every misguided "skeptic" notion. The following installments will rectify that. Stephen Leahy - thanks once again. A paper published two weeks ago indicates (based on paleodata) that ENSO will only intensify as the tropical Pacific warms. -
Riccardo at 05:26 AM on 17 May 2011National Academy of Sciences on Climate Risk Management
I'm glad that one of the most reputable scientific organization tackled the problem of managing the risk. This is at the very heart of the problem we are facing. And, like it or not, the National Academy of Sciences is "Where the Nation turns for Independent, Expert Advice". -
Stephen Baines at 05:22 AM on 17 May 2011Special Parliament Edition of Climate Change Denial
Moderator...didn't realize consensus was off topic here. My apologies. Bud...a vigorous discussion of consensus is here. I have reposted my question there. there.Moderator Response: [e] The note was directed more towards the "ice age predicted in 70s" line of argument, though consensus in general has also been discussed at length in other threads. -
Stephen Baines at 05:20 AM on 17 May 2011Infographic: 97 out of 100 climate experts think humans are causing global warming
This is a repost of a response to Bud in another thread. Bud said "I have following this subject since 1980 when many of these same people were alarmed about global cooling." I remember 1980 Bud. Your timeline is wrong. I was only an undergraduate at the time, but the NAS Charney Report on global warming came out the year before in 1979. We discussed it in class. At that point there was already a consensus on the action of GHG on climate among climate modelers - and that consensus, based on the known physics at the time, suggested warming not cooling. There were still a lot of scientists who remained unconvinced at that point and into the 90s. They have been gradually convinced over the ensuing three decades by the accumulating evidence until virtually all of them now agree. Those people have not arrived at their opinions by appealing to authority, but by evaluating evidence. Look...What if you took your car to 100 mechanics, and 97 of them said you needed to replace your radiator to prevent an engine failure while providing good reasons for their position. One disagreed without giving you a good reason, claiming simply that the others don't know what they are talking about and are not completely sure. Who would you listen to? -
les at 05:09 AM on 17 May 2011National Academy of Sciences on Climate Risk Management
3. the fritz - Must be said, "consensus among economists" doesn't really seem plausible, what ever the target.Give me a one-handed economist! All my economists say, "On the one hand on the other"
Harry S Truman http://www.economist.com/node/2208841?story_id=2208841 -
Albatross at 05:07 AM on 17 May 2011Drought in the Amazon: A death spiral? (part 1:seasons)
Mr. Solomon seems to have missed this Ecology Letters paper's findings (Feeley et al. 2007): "The impacts of global change on tropical forests remain poorly understood. We examined changes in tree growth rates over the past two decades for all species occurring in large (50-ha) forest dynamics plots in Panama and Malaysia. Stem growth rates declined significantly at both forests regardless of initial size or organizational level (species, community or stand). Decreasing growth rates were widespread, occurring in 24–71% of species at Barro Colorado Island, Panama (BCI) and in 58–95% of species at Pasoh, Malaysia (depending on the sizes of stems included). Changes in growth were not consistently associated with initial growth rate, adult stature, or wood density. Changes in growth were significantly associated with regional climate changes: at both sites growth was negatively correlated with annual mean daily minimum temperatures, and at BCI growth was positively correlated with annual precipitation and number of rainfree days (a measure of relative insolation). While the underlying cause(s) of decelerating growth is still unresolved, these patterns strongly contradict the hypothesized pantropical increase in tree growth rates caused by carbon fertilization. Decelerating tree growth will have important economic and environmental implications." -
JMurphy at 05:07 AM on 17 May 2011Special Parliament Edition of Climate Change Denial
Bud, I seriously urge you to look up the word 'refute', because you have refuted nothing so far. If you DO intend to refute anything (in the real sense of the word), why not do so on the relevant threads. As well as the other suggestions that have been sent your way (and seemingly ignored) you could have a look at : Ice-age predicted in the 70s Not the 80s, as you have suggested, so perhaps you could provide more information about those 80s 'predictions' - on that thread. -
Stephen Baines at 05:00 AM on 17 May 2011Special Parliament Edition of Climate Change Denial
"I have following this subject since 1980 when many of these same people were alarmed about global cooling." I remember 1980 Bud. Your timeline is wrong. I was only an undergraduate at the time, but the NAS Charney Report on global warming came out the year before in 1979. We discussed it in class. At that point there was already a consensus on the action of GHG on climate among climate modelers - and that consensus, based on the known physics at the time, suggested warming not cooling. As has been pointed out in the consensus thread, there were still a lot of scientists who remained unconvinced at that point and into the 90s. They have been gradually convinced over the ensuing three decades by the accumulating evidence until virtually all of them now agree. Those people have not arrived at their opinions by appealing to authority, but by evaluating evidence. Look...What if you took your car to 100 mechanics, and 97 of them said you needed to replace your radiator to prevent an engine failure while providing good reasons for their position. One disagreed without giving you a good reason, claiming simply that the others don't know what they are talking about and are not completely sure. Who would you listen to?Moderator Response: [e] When responding to clearly off-topic comments, please place the comment in the appropriate thread then link to it here (or politely point the commenter to the appropriate thread). Thank you. -
Bud at 04:36 AM on 17 May 2011Special Parliament Edition of Climate Change Denial
The moderator's statements are wrong. If statisticians do not have the relevant expertise to weigh in on climate modelling, and obvious misuse of statistical techniques used by climate scientists, then climate science is not a science.Moderator Response: [e]As has been discussed, the paper you cited has been retracted and no longer has bearing on this discussion. If you are concerned about the opinions of statisticians, note that the American Statistical Association endorses the IPCC's conclusions.
In any case, the statistical viability of Mann's research is discussed elsewhere on this site. Please review the existing discussions and take your points to the appropriate thread. Future off-topic posts will be deleted.
-
Paul D at 04:16 AM on 17 May 2011Special Parliament Edition of Climate Change Denial
Bud: "I am also discrediting the use of consensus..." The consensus is based on a vast tranche of data and research. So in reality using the concept of consensus does make sense because it is a written shorthand for that research. -
Paul D at 04:12 AM on 17 May 2011Special Parliament Edition of Climate Change Denial
Bud said: "Most of these climate scientists are dependent on continuing money from governments for the pay checks to study global warming, so most of them are heavily biased to keep the gravy train rolling." But you are quoting from scientists that are also paid for by public money! You are a ( -snip- ) is stating that one set of publicly funded scientists should be ignored and others should be listened to. Effectively you are invalidating the idea that payment from taxes is an issue.Response:[DB] Please attack the argument only.
-
Bud at 04:07 AM on 17 May 2011Special Parliament Edition of Climate Change Denial
DSL, I am a scientist-businessman, and people are spending billions of dollars trying to corrupt the public understanding of science - just on rhetoric and politics - but I don't demonize them. These people are doing great harm to science. I have following this subject since 1980 when many of these same people were alarmed about global cooling. I believe I am more ready to accept new evidence than you are. In any event, I have no ties to academic grants or oil or energy companies (except being a normal energy user). If I have any errors in my posting, then tell me. But posting elsewhere would be better. But keep in mind, unlike many responders here, I am staying on the the point of this thread, i.e. I was giving examples with regard to the ability of non-climate scientists to falsify a climate scientist's hypothesis. I am also discrediting the use of consensus, which is known in science and logic as a fallacious appeals to authority in the general form: Person (or people) P makes claim X. Therefore, X is true. As I said, I am not trying to re-argue the science published by others. If you deny that there have been more ad hominem attacks on AGW skeptics than on proponents, then you are not honest with yourself. Just look at the responses to me in this specific thread.Moderator Response:[e]The comment on global cooling has already been addressed here.
[Edit: I cited the wrong thread here. I intended to direct you to the ice age predicted in the 70s thread.]
The examples you gave were not scientific evidence but opinion statements by persons without the relevant expertise necessary to lend weight to their opinion (discounting retracted research). They have no relevance to this thread.
If you prefer to discuss the scientific evidence rather than general expert consensus, then you are in good company on this site. If you review this site's list of skeptic arguments you will find that this site is predominantly focused on discussing the scientific evidence. You are welcome to find the appropriate thread and take your scientific objections there.
-
Paul D at 04:06 AM on 17 May 2011Special Parliament Edition of Climate Change Denial
Bud: "In science, a consensus or testimony by one of more authorities does not validate an hypothesis." That isn't exactly true. Logically if those 'authorities' have gathered enough evidence, then it validates the hypothesis sufficiently as understood at the time. One can only act on what is known at the time, not on an alternative hypothesis that might be formulated in the future. -
dana1981 at 03:52 AM on 17 May 2011National Academy of Sciences on Climate Risk Management
CBD - yes, this is a very good point. If the "skeptics" were right and a carbon price did begin to cripple the economy, it could simply be scaled back if the public so demanded. I find it very frustrating that there is no intelligent reason not to implement a carbon price, some exceptionally compelling reasons to implement one, and yet we're still not doing it. -
the fritz at 03:50 AM on 17 May 2011National Academy of Sciences on Climate Risk Management
consensus amongst economists with climate expertise -------------------- Waouh! a consensus among economists, all climate experts in addition; that must be a great family -
CBDunkerson at 03:47 AM on 17 May 2011National Academy of Sciences on Climate Risk Management
I like the point in the second bullet about how easy it would be to reverse course if we later found that the 'uncertainties' surrounding climate science caused us to overshoot on avoidance efforts. It nicely counters the nonsense about 'massive costs'. If we were to start implementing significant clean energy policies now it'd still be decades before they were up to a large scale and imposing those 'massive costs'... which means that if Inhofe and the like were correct we'd have plenty of time to observe the growing problem and switch back to fossil fuels... since in their reality we'd also be seeing no further warming over those decades. Might be a way to call them on their BS. Build into global warming legislation that clean energy funding gets pulled if it is costing XX% more than fossil fuel energy or if global temperature anomalies decline from one decade to the next. That would 'protect' us from the problems they claim to foresee so there should then be no reason to oppose the legislation. Of course they would anyway because all their concerns are a smokescreen for propping up the fossil fuel industry, but it'd be easier to make everyone see that. -
chris at 03:31 AM on 17 May 2011Lindzen Illusion #5: Internal Variability
Ken Lambert at 00:12 AM on 17 May, 2011 Well Ken, there's a huge set of data that bears on our knowledge of any particular element of the climate system. It's astonishing to me that someone would focus on truly deficient stuff in junk journals to attempt to reinforce a preferred conclusion. It's not "emotive cat-calling" to call dismal analysis, dismal, and atrocious scholarship, atrocious! D/K’s analysis is objectively pretty dismal. I’ve indicated a major problem in my post above. But D/K is additionally a dismal attempt at estimating “Recent Energy Balance of the Earth”. It’s obvious that their energy balance estimation is incorrect. They recognise that vonSchuckmann's analysis is greatly at odds with theirs but can manage only one sentence of "analysis", viz: “Why the von Schuckmann case is an “outlier” is worthy of further study.” That’s simply unacceptable in a scientific paper, if their aim is to provide a sensible estimate of the energy balance. They have to comment on the huge difference. They have to comment on the fact that von Schuckmann’s analysis contains data to the deeper oceans, and they have to comment on the fact that all the evidence for the thermal component of sea level rise indicates that this has remained positive during their study period. Otherwise it's a deeply flawed “show and tell”. It doesn’t add to our knowledge or provide insight into the natural world. It’s almost certainly incorrect. It’s atrocious scholarship. I suspect D/K simply don’t care; neither does the International Journal of Geosciences as judged by their acceptance of this in a 10 day received-“reviewed”-revised-accepted process. We can surmise that Douglass at least doesn’t care very much since he has a habit of doing this. He butchered an analysis of comparison of model and empirical tropical tropospheric temperature (by using a completely inappropriate statistical analysis), he (with Knox) butchered an analysis of climate sensitivity based on the response to the Pinatubo eruption (by using a completely inappropriate single box representation of the climate system)....You seem a little precious in your aversion to robust descriptors ("atrocious", "dismal", "butchered"), but if one wishes to find out about the world around us, we do need to recognise what is rubbish and what isn't - one may as well be robust about this! As for "You are not arguing on the numbers Chris." What's the point of "arguing" Ken? The numbers are there in all of the papers we're discussing. The evidence strongly supports the conclusion that the earth is in positive radiative imbalance, whatever the uncertainty in the precise numbers over whatever long or short period of time you wish to "dice" up the analysis. I'm comfortable waiting to see how these subjects develop over the next couple of years. You choose to plant your flag with D/K. As I said above, we're clearly not going to agree over this, so why "argue"? Has there been very little ocean heat uptake into the upper 700m of the ocean in recent years? Maybe, maybe not. When we're confident about that we can ask the questions of whether the radiative imbalance has reduced quite a bit for a time or not, and why or why not. You can stick for D/K-style show-and-tell; I'm plumping for the science "in the round"! -
DSL at 03:16 AM on 17 May 2011Special Parliament Edition of Climate Change Denial
Bud @34: no, really, it doesn't. These claims about money are uncritical. Describe, if you would, this "gravy train" and how it differs from the "gravy train" of privately-funded science. In whose interests is publicly-funded science done, and how is integrity maintained? In whose interests is privately-funded science done, and how is integrity maintained? If you were a scientist and someone spent tens of millions of dollars just to try to corrupt the public understanding of your conclusions--just on rhetoric--you would also endlessly demonize that someone. But what I'm waiting for now, Bud, is your recognition that you might have made a few errors in your original postings (on CO2 as a forcing). If you were a true skeptic, you'd consider the evidence and either provide a counterargument or change your understanding of the situation (not here, of course: on the appropriate thread). Can we expect this from you, or will you go the way of so many others and refuse to admit new evidence into your understanding? -
JMurphy at 03:10 AM on 17 May 2011Special Parliament Edition of Climate Change Denial
Yes, very ironic about Bud's use of Wegman, but what is even more ironic is that so-called skeptics rely so much on 'criticisms' of Climate science which are themselves (authors and papers) perfect examples of those supposed criticisms. And yet, for some strange reason, the so-called skeptics can't see the irony ! Won't be long before we hear the wailing of "Conspiracy !", "They're all biased against our 'experts' !" and "The truth is being suppressed !!".Response:[DB] You mean like this?
Prev 1726 1727 1728 1729 1730 1731 1732 1733 1734 1735 1736 1737 1738 1739 1740 1741 Next


