


 Arguments


Recent Comments
Prev 1732 1733 1734 1735 1736 1737 1738 1739 1740 1741 1742 1743 1744 1745 1746 1747 Next
Comments 86951 to 87000:
-
Charlie A at 00:11 AM on 18 May 2011Is the CRU the 'principal source' of climate change projections?
DB inline comments: "Tamino shows clearly the nature of the "Cherry-pick" that is 2003". and "Smoothed (simple 5-year averages), one gets this:" When Roger Pielke started posting the OHC graphs, 2004, not 2003, was the highest point. At that time, several years ago he explain his choice of 2003 as being the point where the Argo data dominated the record. It is only in the 2010 revisions that 2003 became the highest point. Splicing together datasets of different types of measurements is difficult, and when a newer system has much better coverage and accuracy than an older system it is quite common to do analysis starting from the introduction of the new system. Some common examples: Sea Ice measurements from beginning of satellite coverage, ignoring earlier surface based observations. GRACE mass loss measurements. Lower tropospheric temperatures from satellites vs earlier radiosonde measurements. In post #12 Ken Lambert refers to an article on XBT-Argo transition. A key element of that explanation is Schuckmann 2009, "Global hydrographic variability patterns during 2003–2008" Was Schuckmann cherry picking when he started his analysis in 2003? Much more likely is that he chose 2003 because that is when the reliable, comprehensive dataset started. Regarding the 5 year smoothed plot: The beauty of OHC content is that one does not need to average over a long period. The change in ocean heat content over a 3 month period is a direct integration of the radiative imbalance over that 3 month period. It reflects variations (over that 3 month period) of such things as the average albedo due to variations in cloud cover or aerosols. -
chris at 23:48 PM on 17 May 2011Lindzen Illusion #5: Internal Variability
Ken Lambert at 22:08 PM on 17 May, 2011 That’s poor, Ken. You’ve done a little bait and switch. The point is that your mate D.H. Douglass butchered an attempt at statistical analysis of comparison of model and empirical data to attempt to draw a false conclusion about the reliability of the models (they wanted to pretend that the empirical data was incompatible with the range of model variability). The laughable nature of their analysis is described in a lecture by Dr. Santer which is worth an hour of anyone’s time – very enlightening and instructive indeed. (if you only want the relevant bit start at around 30 mins in). I can see why you love D/K’s style of “research” since it’s a little similar to your researches; i.e. look for areas of uncertainties in sub-disciplines of a subject, assume that the most extreme end of the uncertainty that matches your preconceived idea is the true description of the reality bounded by the variance of the uncertainty (e.g. by putting your faith in D/K's "outputs")…..and then pretend that that calls into question all levels of greater certainty above. As your bait-n-switch quote shows, whereas Douglass was determined that the uncertainty could be repackaged to assert that models was incompatible with empirical data on a rather small element of atmospheric response to radiative forcing ( strength of a hotspot), Santer et al are rather more relaxed and honest about the nature of uncertainty. This nice paragraph of yours is apposite: ” The geothermal effect should be easily eliminated from measurements. A negative 0.1W/sq.m TOA imbalance at equilibrium is required to eliminate this effect, otherwise the biosphere would gain energy indefinitely.” I wasn’t going to be too hard on Douglass/Knox but since you brought that up (and them up!), it’s worth mentioning another analysis that D/K butchered. They proposed that the warming in Iceland between 1979-1996 is due to the geothermal effect that you mention. H. Bjornsson, T. Jonsson, and T. Johannesson from the Icelandic Meteorological Office in their comment linked under “butchered” just above, showed that the map of volcanic activity (where geothermal effects should dominate) is incompatible with the expectation from geothermal contributions to surface temperatures, that there is no evidence for an enhancement of the geothermal flux during the period of interest, and that the geothermal flux is anyway approaching 3 orders of magnitude too low. D/K are obviously having great fun with their very late second careers as climate contrarians; but your reliance on them for info on climate-related matters is misplaced… [P.S. Ben Santer has just been elected to the National Academy of Sciences for his outstanding work on climate science - good work, yes?!] -
Bob Lacatena at 23:24 PM on 17 May 2011Lindzen Illusion #2: Lindzen vs. Hansen - the Sleek Veneer of the 1980s
I'd like to suggest to any casual readers that they look at angusmac's posts, and those in response, and note how he quite simply refuses to see the point of the entire argument. He is so intent on proving a point that he desperately wants to be true that he is ignoring the simple and obvious... even after it has been explained to him over and over again. This is an important behavior to watch for on these threads, the habit of some to make their case by mere repetition, often through the inclusion of as many numbers and graphs and equations as possible, while simply and blatantly ignoring even the most basic and irrefutable arguments that knock the supports right out from under their case. Merely repeating a flawed argument over and over, with more and more intricate (if invalid) numbers, does not make it any more true, or convincing, and forcing others to repeat the same salient point over and over does not make that point any less true. Be wary. -
Berényi Péter at 23:21 PM on 17 May 2011Lindzen Illusion #5: Internal Variability
#106 Ken Lambert at 22:08 PM on 17 May, 2011 This whole ocean heating story is fascinating. We have an open bathtub holding vast amounts of water which is heated from above, the sides and below. Above from radiation and air transfer, the sides from ice shelf effects where they occur, and below from geothermal (0.1W/sq.m globally). Fascinating, indeed. What you are not told often, Ken, is that the deep oceanic circulation (aka thermohaline circulation) is not a heat engine, that is, the mechanical energy needed to push huge water masses around is not derived from entropy (that is, temperature and/or salinity) differences inside the hydrosphere. A heat reservoir heated from above in a gravitational field simply can't do that. Downwelling of high salinity cold water in subpolar regions could not go on forever, because sooner or later the abyss would get saturated, deep water would be as cold and salty as possible, so no more could go under in any way. There should be other processes operating elsewhere that pump heat down and remove salts from deep layers, to make room for more. Geothermal heating plays a small part in it (it warms water a bit at the proper level), as short wave solar radiation (light) also does when it penetrates into the water to a depth of several hundred meters. But the main player is turbulent mixing, driven by mechanical energy like wind and deep tidal breaking. Most of it is concentrated to small areas along coastlines and mid ocean ridges, where bottom topography is sufficiently rugged. BTW, about 80% of deep turbulent mixing happens in the Southern Ocean, so the true diver of ocean currents is located there. Thermohaline downwelling itself does not transfer any heat into the abyss, it removes heat from there. -
JMurphy at 22:43 PM on 17 May 2011National Academy of Sciences on Climate Risk Management
I hope someone will soon be reviewing another paper (Fall et al), which not only confirms the temperature trend (in the US), despite the belief of certain individuals; but also shows that peer-review works (as long as the paper is eventually accepted and published, of course) and that so-called skeptics are not prevented from publishing such work by an imaginary conspiracy. One paper, three proofs - what more could anyone want ?Response:[DB] A review is planned.
-
Ken Lambert at 22:40 PM on 17 May 2011Is the CRU the 'principal source' of climate change projections?
Charlie A #11 Have a look here for an explanation of the XBT-Argo transition: http://www.skepticalscience.com/news.php?p=2&t=78&&n=202 -
Ken Lambert at 22:36 PM on 17 May 2011Lindzen Illusion #7: The Anti-Galileo
chris #113 How about we agree to disagree about 0.1 +/-0.1W/sq.m -
Bern at 22:26 PM on 17 May 2011Special Parliament Edition of Climate Change Denial
[DB] response to #52: no, it's not like scientists are speaking in a different language, no matter how Tolkienesque. It's like the scientists write a journal article saying "It would appear that the sky is predominantly blue in colour, except at dawn & dusk when preferential scattering and refraction may produce a pinkish hue at times", whereupon the skeptics immediately start jumping up and down and screaming to their media contacts "Those scientists are saying the sky is pink! Everyone knows it's blue! It's never pink! They're corrupt liars, don't believe a word they say!" The press, of course, immediately write their headlines along the lines of "Breaking News: Scientists Say Sky is Pink!", followed by opinion columns by prominent skeptics about how the sky is blue, has always been blue, what are those scientists talking about, they obviously don't know anything about atmospheric physics, they must be either incompetent or conspiring to defraud the public, etc. The problem, of course, is deliberate miscontruing of scientific statements by deniers, aided by 'reporting' by the press that consists of little more than writing about or even just reprinting press releases from various thinktanks. If a little more effort went in to understanding what the scientists were saying, and reporting it accurately, then I think the message would get out quite easily. -
Ken Lambert at 22:08 PM on 17 May 2011Lindzen Illusion #5: Internal Variability
Chris #103 "He butchered an analysis of comparison of model and empirical tropical tropospheric temperature." Here is the conclusion from the butcher busters (Schmidt, Santer, Wigley et al) "We may never completely reconcile the divergent observational estimates of temperature changes in the tropical troposphere. We lack the unimpeachable observational records necessary for this task. The large structural uncertainties in observations hamper our ability to determine how well models simulate the tropospheric temperature changes that actually occurred over the satellite era. A truly definitive answer to this question may be difficult to obtain. Nevertheless, if structural uncertainties in observations and models are fully accounted for, a partial resolution of the long-standing ‘differential warming’ problem has now been achieved. The lessons learned from studying this problem can and should be applied towards the improvement of existing climate monitoring systems, so that future model evaluation studies are less sensitive to observational ambiguity." Seems like a pretty equivocal conclusion to me. "Has there been very little ocean heat uptake into the upper 700m of the ocean in recent years? Maybe, maybe not. When we're confident about that we can ask the questions of whether the radiative imbalance has reduced quite a bit for a time or not, and why or why not. You can stick for D/K-style show-and-tell; I'm plumping for the science "in the round"!" In other words - you don't know until further data is obtained. The upshot is that if the radiative imbalance has reduced quite a bit, then cooling forcings are in play which need to be identified, OR the warming forcings are not according to the theory. Hansen has a go with extra Aerosols, and the unbelievable 'delayed Pinitubo bounce decay effect'. This whole ocean heating story is fascinating. We have an open bathtub holding vast amounts of water which is heated from above, the sides and below. Above from radiation and air transfer, the sides from ice shelf effects where they occur, and below from geothermal (0.1W/sq.m globally). The geothermal effect should be easily eliminated from measurements. A negative 0.1W/sq.m TOA imbalance at equilibrium is required to eliminate this effect, otherwise the biosphere would gain energy indefinitely. The top and sides heating need plausible mechanisms for getting heat in and out, down from the top layers to the depths and into the abyss. -
JMurphy at 21:57 PM on 17 May 2011Lindzen Illusion #5: Internal Variability
Ken Lambert wrote : "RE: Dyson: He definitely does not subscribe to AGW - 'alarmist global warming'" I wish you so-called skeptics would try and agree on your terminology or at least (à la Poptech) stop using different versions of terms whenever you feel like it - and without even bothering to tell anyone ! And do you have your own version of "alarmist" too ? If so, please explain what it means. -
Arkadiusz Semczyszak at 21:43 PM on 17 May 2011Drought in the Amazon: A death spiral? (part 1:seasons)
Solomon is essentially a professional misinformer. Maybe ... Sometimes he is too biased - use "cherry picking". Only that this case shows that - here - he's right. Like Idso who cites many articles of the late twentieth century, for example: “In the relatively short-term study of Lovelock et al. (1999a), for example, seedlings of the tropical tree Copaifera aromatica that were grown for two months at an atmospheric CO2 concentration of 860 ppm exhibited photosynthetic rates that were consistently 50-100% greater than those displayed by control seedlings fumigated with air containing 390 ppm CO2.” Co2 favors the development of tropical forests and these buffering - the hydrological cycle - is less periods of extreme drought. And what says - cited by Solomon - Phillips et al., 2008., in: The changing Amazon forest : “Because growth on average exceeded mortality, intact Amazonian forests have been a carbon sink. In the late twentieth century, biomass of trees of more than 10 cm diameter increased by 0.62 +/- 0.23 t C ha-1 yr-1 averaged across the basin. This implies a carbon sink in Neotropical old-growth forest of at least 0.49 +/- 18 Pg C yr-1. If other biomass and necromass components are also increased proportionally, then the old-growth forest sink here has been 0.79 +/- 29 Pg C yr-1, even before allowing for any gains in soil carbon stocks. This is approximately equal to the carbon emissions to the atmosphere by Amazon deforestation.” And what speaks - on this topic - Greenpeace?: “ Rafael Cruz, a Greenpeace activist in Manaus who has been monitoring the drought, said that while the rise and fall of the Amazon's rivers was a normal process, recent years had seen both extreme droughts and flooding become worryingly frequent. Although it was too early to directly link the droughts to global warming, Cruz said such events were an alert about what could happen if action was not taken.” Of course it is. Historically, droughts have been even greater and the smaller population of Amazonia. So We must - firstly - to increase the possibility of water retention in periods of drought - of course ... It is always useful. Will Amazon drought significantly affected the photosynthesis?: “ We found no big differences in the greenness level [!] of these forests between drought and non-drought years, which suggests that these forests may be more tolerant of droughts than we previously thought,” said Arindam Samanta, the study's lead author from Boston University. The comprehensive study published in the current issue of the scientific journal Geophysical Research Letters used the latest version of the NASA MODIS satellite data to measure the greenness of these vast pristine forests over the past decade. A study published in the journal Science in 2007 claimed that these forests actually thrive from drought because of more sunshine under cloud-less skies typical of drought conditions. The new study found that those results were flawed and not reproducible. “This new study brings some clarity to our muddled understanding of how these forests, with their rich source of biodiversity, would fare in the future in the face of twin pressures from logging and changing climate,” said Boston University Prof. Ranga Myneni, senior author of the new study.” A significant mistake of catastrophic forecasts (the reaction of global ecosystems to extreme phenomena - were found to be greater resistance - a significant reduction of "tipping points") speaks this paper: The ecological role of climate extremes: current understanding and future prospects, Smith, 2011.: “For example, above- and below-ground productivity remained unchanged across all years of the study ...” Meanwhile in: The 2010 Amazon Drought Lewis et al, 2011., they are frighten us ... Lewis also threatens us with fire But here (SH - Southern Hemisphere) has recently seen something quite different - a surprising ... Large Variations in Southern Hemisphere Biomass Burning During the Last 650 Years, Wang et al. 2010.: “ These observations and isotope mass balance model results imply that large variations in the degree of biomass burning in the Southern Hemisphere occurred during the last 650 years, with a decrease by about 50% in the 1600s, an increase of about 100% by the late 1800s, and another decrease by about 70% from the late 1800s to present day. And so it looks like ... I recommend also comments (not the same "very incomplete" text post) - here - to this post. -
Ken Lambert at 21:42 PM on 17 May 2011Lindzen Illusion #5: Internal Variability
Albatross #102 RE: Dyson: He definitely does not subscribe to AGW - 'alarmist global warming'. "And, you seem to be blissfully unaware of the huge difference in measuring OHC in the top 700 m versus the top 1500-2000 m. Please stop confusing the two." Well you can tell us all what is happening between 700m and 2000m. Peer reviewed Argo analysis please. "What we have is data that says that maybe [warming] occurs, but it's within the noise....The point we have to keep in mind is that without any of this at all our climate would wander--at least within limits." Lindzen maybe, maybe not - right. It depends on how widely the limits of natural variability are drawn. -
CBDunkerson at 21:38 PM on 17 May 2011Increasing CO2 has little to no effect
This is one of the most bizarre things about the AGW 'skeptic' movement. After Arrhenius first suggested the possibility of AGW in 1896 real skeptics countered with arguments like 'the CO2 effect is saturated' and 'oceans would absorb all the extra CO2'... which based on the limited knowledge of the time were compelling enough that the vast majority of scientists rejected AGW. It was only after these objections were disproved by other advancements, around the 1960s, that science started looking at the possibility of AGW again... and found that it was already underway. Yet here we are half a century later and the modern 'skeptics' are recycling these ancient arguments as if they were new and valid... rather than long since proven false. -
Dikran Marsupial at 20:43 PM on 17 May 2011Increasing CO2 has little to no effect
trunkmonkey@40 The upper atmosphere, where the Earth's energy budget is decided is very cold and hence very dry. There isn't a great deal of water vapour there to absorb the photons. There is a good overview of most of this from Spencer Weart and Ray Pierrehumbert at Realclimate here. The summary is here, emphasis mine: So, if a skeptical friend hits you with the "saturation argument" against global warming, here’s all you need to say: (a) You’d still get an increase in greenhouse warming even if the atmosphere were saturated, because it’s the absorption in the thin upper atmosphere (which is unsaturated) that counts (b) It’s not even true that the atmosphere is actually saturated with respect to absorption by CO2, (c) Water vapor doesn’t overwhelm the effects of CO2 because there’s little water vapor in the high, cold regions from which infrared escapes, and at the low pressures there water vapor absorption is like a leaky sieve, which would let a lot more radiation through were it not for CO2, and (d) These issues were satisfactorily addressed by physicists 50 years ago, and the necessary physics is included in all climate models. There is also a follow up post here where Ray Pierrehumbert goes into the physics in more detail. Hopefully those two posts answer your questions, in short, physics has been able to solve this problem for about sixty years. -
JMurphy at 20:29 PM on 17 May 2011Special Parliament Edition of Climate Change Denial
Response: [DB] You mean like this? To make one last very off-topic comment : Yes, a bit like that but more like this last line from a classic Carry On film - if you like that sort of thing (which I do). -
Stephen Baines at 14:39 PM on 17 May 2011Lindzen Illusion #2: Lindzen vs. Hansen - the Sleek Veneer of the 1980s
Angumusac Pretty elaborate table. You could summarize it in two sentences though. 1. Hansen's early model had too high a sensitivity. 2. Scenario B ended up with the forcing that best matched reality out of the three. Why not just say that?Response:[dana1981] Because he's trying to exaggerate how far off Hansen was by using this "business as usual" quote, even though it's been explained to him several times that Hansen is not in the business of predicting future CO2 changes.
-
scaddenp at 14:38 PM on 17 May 2011Increasing CO2 has little to no effect
Numerous articles about this, but try Schmidt et al, 2010 for serious crack at it. -
trunkmonkey at 14:23 PM on 17 May 2011Increasing CO2 has little to no effect
The absorbtion bands of CO2 and water vapor overlap making it difficult to parse out the purely absorbtive greenhouse contribution of incremental CO2. How are we so sure water vapor would not absorb the photons if CO2 were removed, and for that matter, sure water vapor is not absorbing the photons INSTEAD of CO2. I realize both signatures are visible from space, but is seems the parsing problem should apply here as well. -
adelady at 14:16 PM on 17 May 2011National Academy of Sciences on Climate Risk Management
Bern, you're right. I think the biggest use of the book among politicians will be quite specific. Those who are interested _will_ read it. They know better than any of us which particular politician has which particular misconception(s). They'll be able to say "Hey, you don't need to read the whole thing. Just have a look at page/ chapter/ paragraph ... and tell me what you think." Very useful. And when the yesbuts come in reply, the references to the real science will be easily accessible. (I wouldn't mind betting a few of them get the phone apps to help out.) -
Charlie A at 14:06 PM on 17 May 2011Is the CRU the 'principal source' of climate change projections?
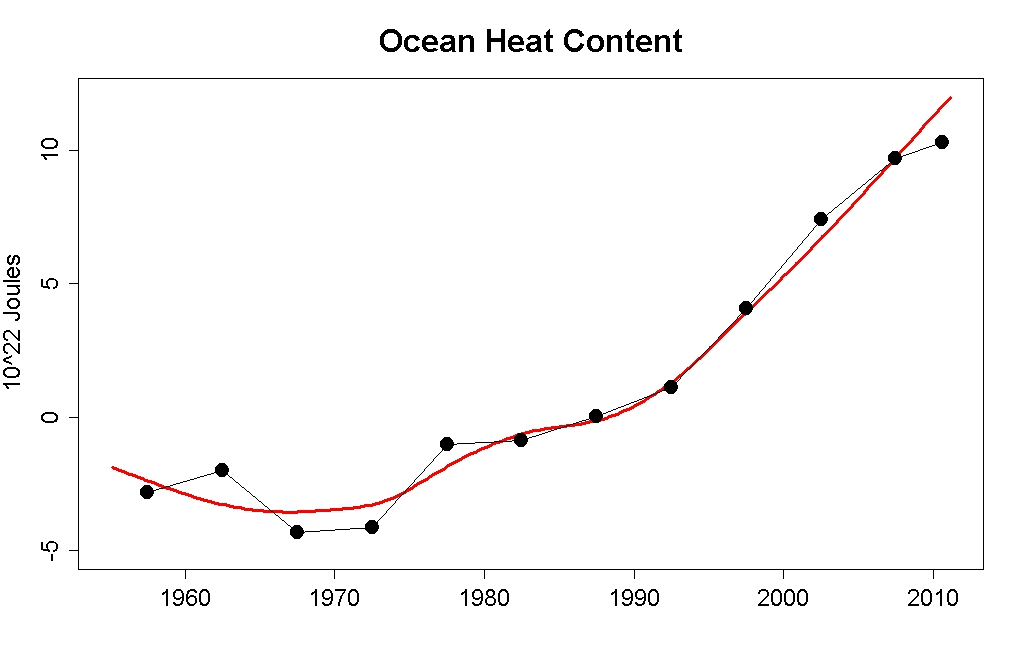
2003 is the first year that we had truly global coverage of ocean heat content measurement. The Argo network was started in early 2000's and expanded dramatically in 2003. If you look at the ocean heat content plots, you will see a very large discontinuity as the main measurement method changed over from XBTs to Argo floats. The recent adjustment of data reduced this non-physical step change, but it is still quite evident.Response:[DB] Tamino shows clearly the nature of the "Cherry-pick" that is 2003:

Looking at the totality of the data:
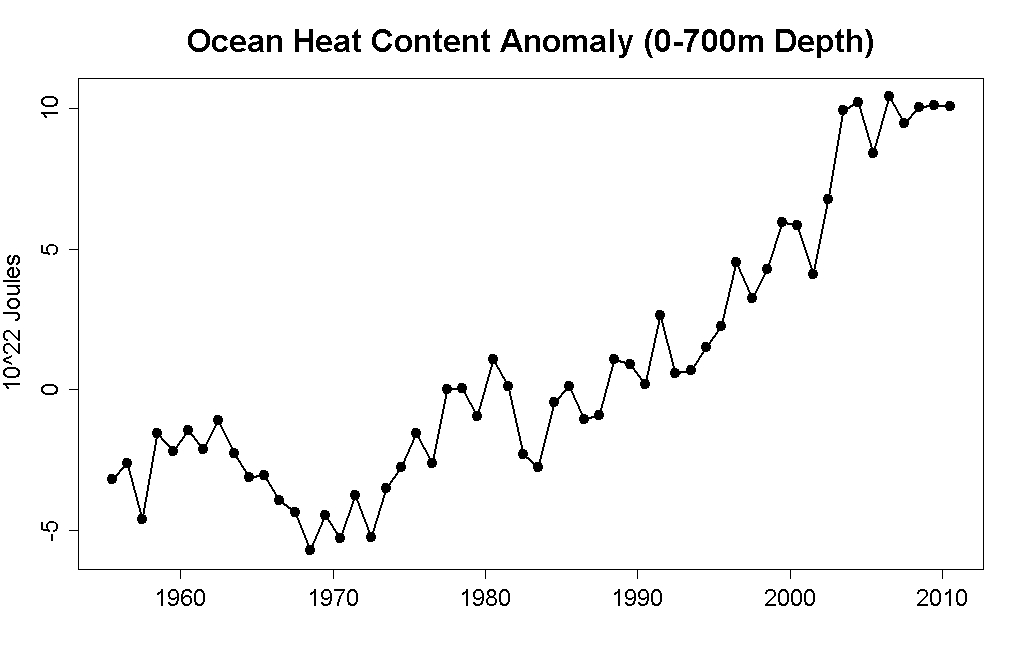
Smoothed (5-year averages), one gets this:
-
Albatross at 13:57 PM on 17 May 2011Hockey stick is broken
All, Bud seems to be cherry-picking papers from the NIPCC's "Prudent Path" misinformation document. If so, he can keep at this for some time.... Also, in the face of evidence to the contrary of his beliefs the "skeptics" just keeps forging ahead, mostly ignoring the inconvenient evidence. At this point one has to wonder whether the person is a "skeptics" or someone in denial about AGW. There are more Hockey Sticks out there than can be used by a NHL team, some generated using independent data not used in the original HS graph. e @85, good catch!Response:[dana1981] I suggest we follow Daniel's sage advice. DNFTT. Until Bud can address the fact that the lone hemispheric reconstruction he has referenced is flawed and outdated, there's little point in feeding him further.
-
angusmac at 13:57 PM on 17 May 2011Lindzen Illusion #2: Lindzen vs. Hansen - the Sleek Veneer of the 1980s
Dana, to summarise our discussuion, I enclose the timeline and narrative showing the reduction in the estimate for the 2019 temperature anomaly from Hansen's initial estimate of 1.57°C in 1988 to your estimate of 0.69°C in 2011. Links: Hansen (1988a), Hansen (1988b), Hansen (2005), Hansen (2006), Schmidt (2007) & Dana (2011)
-
Bern at 13:42 PM on 17 May 2011Is the CRU the 'principal source' of climate change projections?
Charlie A: why pick 2003 as the start date for your comparison? Is it because 2003 was an abnormally high data point for OHC, perhaps? Suggest you look at the link in my post #7. And the manuscript that goes along with the chart of OHC, on the NOAA page you linked? It says this: "Here we update these estimates for the upper 700 m of the world ocean (OHC700) with additional historical and modern data [Levitus et al., 2005b; Boyer et al., 2006] including Argo profiling float data that have been corrected for systematic errors." Note: the upper 700m of the world ocean - that's the top 20% or so. There's another 2,500 metres of water below that, and recent work suggests there's a lot more deep mixing going on that previously thought. Actually, a quick search reveals this nice SkS article about the energy balance problem. You should read that, and comment there, as this is getting seriously off-topic. -
Charlie A at 13:42 PM on 17 May 2011Is the CRU the 'principal source' of climate change projections?
Just to clarify something in the above post .... The numbers 0.7 x 10^22 joules expected versus 0.08 x 10^22 joules observed are the annual increases in OHC. (These are sometimes expressed in zetajoules or 10^21 joules as 7 zetajoules/year expected vs. 0.08 zetajoules/year observed.) As these are the annual changes, the zero points and the intercepts are not relevant. The change in the earth's heat content each year is a direct measure of the average radiative imbalance over that year. All the different ways of adjusting intercept points are not relevant to the annual radiative imbalance. If you prefer to use units related back to the watts/meter-squared forcings, the conversion is 1 x 10^22 joules/year (or 10 zetajoules/year) of heat content increase results from a forcing of 0.62 watts/meter-squared over the entire globe. -
Charlie A at 13:12 PM on 17 May 2011Is the CRU the 'principal source' of climate change projections?
There is a radiative imbalance between the total energy going into the earth system vs. the total energy leaving the earth system. The forcing from CO2 and various other things end up with a net incoming radiation (mostly shortwave) that is greater than the outgoing radiation (mostly longwave). That results in an increase in the heat content of the earth. About 95% of that increase in the earth's heat content appears in the upper 700 meters of the ocean. We have had fairly accurate measurement of this ocean heat content (OHC) since 2003 with the widespread deployment of the ARGO network. The expected radiative imbalance is around 0.7 * 10^22 joules. (See the SLOPE of the extrapolated line in comment 5, above). The observed rise in OHC since 2003 is about 0.08 * 10^22 joules. That is the missing energy that Trenberth referred to. OHC is a useful metric in that a snapshot of the delta of the OHC over a 3 month or annual period shows the net radiative imbalance of the earth over that period. No further adjustments needed. NOAA OHC page: -
Daniel Bailey at 12:28 PM on 17 May 2011Hockey stick is broken
To piggyback on the prevailing sentiment, regionalized warming/cooling is that: regional. For your examples given, the warming experienced regionally during the MWP was just that: regional periods of warming interspersed with bouts of regional cooling. So for every "dog" study showing a certain region was "warm at a certain time period therein, another "pony" study showing cooling during the period can be rolled out. As an example, Martín-Chivelet et al 2011, showed that the 20th century was the time with highest surface temperatures in Northern Spain in the last 4000 years (more robust discussion here), which includes the MWP. Whoopee. But where the warming/cooling of the past differs from the warming experienced in the last century & this is two-fold: 1. This warming is truly global 2. It is driven largely (especially since 1975 or so) by us with our GHG emissions. Please take the time to read the literally hundreds of posts at this site going over this in exquisite detail. Whichever sources of information you've been learning from so far have done you a disservice. -
Jerry at 12:15 PM on 17 May 2011Special Parliament Edition of Climate Change Denial
Not a Bud comment. In response to scientific certainty you say That humans are very likely (>90%) responsible for most of the temperature rise post-1970 due to fossil-fuel GHG emissions (primarily CO2). I recognize the need for scientific accuracy, but shouldn't it really be >99%, or even >99.99%? Someone could easily take >90% to mean there is a 1 in 10 chance--not horrible odds--when the reality seems more like 1 in a million. JerryResponse:[DB] You speak to the issue of scientific reticence (the over-arching need to "be right") vs colloquially-used language in the real world. In my response earlier, I phrased the expressions of certainty as used by both the National Academies of Sciences and the IPCC.
In the terms you reference, in the common tongue, you may well be correct. After all, unless the physics of human-produced GHGs differ entirely from those of GHG of natural origin (in worlds populated with Iris effects, cloud-causing ENSO and low-flying bacon), what other surmise can be drawn?
In order to effectively communicate with the outside world, scientists must learn to speak comfortably in the common tongue. As things now stand, scientists may as well be speaking in the high tongue of the Noldor.
-
Bern at 11:22 AM on 17 May 2011National Academy of Sciences on Climate Risk Management
Marcus: yes, hypocrisy and politicians seem to often go hand-in-hand. However, I think that we should be careful not to tar all politicians with the same brush, when many are acting without a full appreciation of the situation. Hopefully, though, John's book, and publications like this NAS report, will open the eyes of the more honest amongst the political ranks, who still endeavour to do what they think is best for their electorate. All it takes are a few prominent 'conversions' to the science, and some media coverage, for the average joe sixpack to think "hey, there might be something in this global warming thing after all...". As an example - I was talking to my mother recently, and she was surprised to hear that there was some substance to global warming - she thought it was just another non-issue the politicians were getting upset about. So there is a lot of ignorance (in the 'lack of knowledge & understanding' sense of the word) amongst the electorate. That's what we need to work to correct. I gave a presentation at my work a few weeks ago on global warming, and the response was along the lines of "Wow, I didn't know that!"... -
Marcus at 11:12 AM on 17 May 2011National Academy of Sciences on Climate Risk Management
@ Bern. Yes, thank you again for exposing the Rank Hypocrisy of Tony Abbott. Unless I lived as a total hermit, there is no way that I can avoid the full impact of a GST in virtually *every* facet of my life. By contrast, my use of public transport & green electricity means that my exposure to a carbon tax will be incredibly minimal-& can be reduced further still via some very sensible actions on my part. Its also interesting how Abbott is demanding that Gillard seek a mandate for the Carbon Tax, because she failed to announce it before the last election-yet again he was instrumental in putting together Work Choices, a policy which was brought in *without* a mandate from the electorate! His hypocrisy knows no bounds! -
Bern at 10:43 AM on 17 May 2011National Academy of Sciences on Climate Risk Management
"impose massive costs without meaningful benefits." Australian readers might be more familiar with this in phrased in slightly different language: "It's a great big new tax on everything!" Which is particularly ironic, given that "it" (being a carbon price) only taxes carbon emissions, and that the promulgator of the above soundbite was instrumental in imposing the only "great big new tax on everything" (i.e. the GST) that Australia has seen for the last few decades... -
sailrick at 10:24 AM on 17 May 2011Drought in the Amazon: A death spiral? (part 1:seasons)
On the California coast, La Nina brought us a wet winter and huge snowpack in the Sierra mountains this year. Not a typical La Nina year here, which are usually dryer than normal. Last year, we saw a fairly typical El Nino winter, with plenty of rain, but an unusually cool summer followed. Any ideas as to why? -
Hockey stick is broken
Bud, This is getting ridiculous. You were asked about global warming, so now you produce a paper about warming in China? What's more, the timeframe referenced for the warm period in that paper is substantially different from the time period in your first paper. The Icelandic warming is timed around 1000 A.D., while the Chinese warming is around 200 A.D. These are different warming events localized to different regions Bud. Please show us some truly global evidence and stop spamming this thread with irrelevant and outdated papers. -
Bern at 10:05 AM on 17 May 2011Is the CRU the 'principal source' of climate change projections?
Actually, I think nanjo's comment about OHC not increasing is best explained by this post over at Tamino's blog. In short: AGW denier posts an article at WUWT which cherry picks data to make it seem like OHC predictions are completely wrong, when they're actually pretty good. -
Bud at 10:00 AM on 17 May 2011Hockey stick is broken
Dana. This 2002 paper using data from China confirms period AD 200 that is "The peak at about AD 200 represents the warmest stage of the last two millennia, temperature was even higher than during the 20th century." "General characteristics of temperature variation in China during the last two millennia," GEOPHYSICAL RESEARCH LETTERS, VOL. 29, NO. 9, 1324, 10.1029/2001GL014485, 2002 Bao Yang Institute of Cold and Arid Regions Environmental and Engineering, Chinese Academy of Sciences, China Achim Braeuning Institute for Geography, University of Stuttgart, Stuttgart, Germany Kathleen R. Johnson Department of Earth and Planetary Science, University of California, Berkeley, CA, USA Shi Yafeng Institute of Geography and Limnology, Chinese Academy of Sciences, 210008, Nanjing, China http://www.ess.uci.edu/~johnsonlab/files/Download/Yang%20et%20al.,%202002.pdfResponse:[DB] Please slow down the linear posting of studies until you have properly discussed the ones you have already posted. For example, e countered your Huang et al 1997 with Huang et al 2008 which effectively overcomes your position altogether.
-
Hockey stick is broken
Bud >These scientists find that Iceland was warmer. So what? The topic of discussion is global warming. Do you have up to date evidence that the globe was warmer that the present (meaning 2000-2010 not the 90's)? More importantly, why would that even be relevant to your argument? The key question is the physics that underly the warming and what that means for future temperature trends. -
Marcus at 09:54 AM on 17 May 2011Special Parliament Edition of Climate Change Denial
Sorry if this is OT but, as a scientist myself (though not a climate scientist), I get *deeply* offended by implications that scientists in the public sector are part of some big "Gravy Train". Trust me, no-one working in the public sector is getting rich, & research grants-be it from the public or private sector-are incredibly hard to come by. Now, with my level of expertise, I could easily move into a big Bio-tech firm & earn a six figure salary-with about half of the headaches, but I *choose* to work in a *public* institution that has a reputation for *good* science. Now, if we want to look at Gravy Trains, we really need look no further than the bevy of most vocal critics of AGW-politicians from regions currently dependent on coal or oil extraction; politicians who get nice kick-backs from lobbyists in the fossil fuel industry; so-called "think-tanks" who also get a hefty amount of money from the fossil fuel industry & Mainstream Media Outlets who are also heavily dependent on advertising revenue from a number of big business entities-including the fossil fuel industry. Anyone want to place bets on which group I'd think are less likely to be influenced by motives of personal gain? As the sayings go-"Que Bono?" (Who Benefits?) and "Follow the Money". -
Bud at 09:46 AM on 17 May 2011Hockey stick is broken
Dana. I pretend nothing. These scientists find that Iceland was warmer. "Once again" meant that they are by no means the only scientists to publish of warmer periods. Since you claimed "There are no millenial reconstructions which show the MWP hotter than present" I gave you a reference to the August 1997, Huang, Pollack, and Shen paper in Geophysical Research Letters. Here's another reconstruction. There's a nice graph on this page: http://www.scotese.com/climate.htm Bibliography here: http://www.scotese.com/scotesepubs.htmResponse:[DB] Please see e's pre-emptive reply to you at 80 above.
-
Hockey stick is broken
Bud @77, Huang et. al. have an updated paper here, published in 2008. From the abstract (emphasis mine): "We present a suite of new 20,000 year reconstructions ... all referenced to the 1961–1990 mean of the instrumental record. ... The reconstructions show the temperatures of ... the maximum of the MWP at or slightly below the reference level ... and end-of-20th century temperatures about 0.5 K above the reference level. Note that they found that end-of-20th century temperatures were warmer than the MWP, and keep in mind that the 21st century is known to be warmer still. Also note the discussion of their previous paper: "Below we describe their respective datasets, and show why the results of HPS97 cannot be used for comparing MWP warmth to the 20th century." So Bud, you readily cited the work of these particular scientists when you felt their conclusions agreed with yours. Are you going to stick with them now that their conclusions differ? Are you actually willing to change your point of view given new evidence, or are you just going to cherry pick the versions that you agree with? -
JMurphy at 09:23 AM on 17 May 2011It's the sun
Cole, your linked paper starts : The variable Sun is the most likely candidate for natural forcing of past climate change on time scales of 50 to 1000 years. And ends : We note that our conclusions can not be tested on the basis of the last 30 years of solar observations because, according to the proxy data, the Sun was in a maximum plato state in its longterm evolution. All recently published reconstructions agree well during the satellite observational period and diverge only in the past. This implies that observational data do not allow to select and favor one of the proposed reconstructions. Therefore, until new evidence become available we are in a situation that different approaches and hypothesis yield different solar forcing values. Our result allows the climate community to evaluate the full range of present uncertainty in solar forcing. Can you explain in your own words (i.e. not from WUWT) what you get from that paper ? -
dana1981 at 09:17 AM on 17 May 2011Hockey stick is broken
Bud #79 - and I quote:"Once again we have a science paper indicating warmth of the more distant past clearly exceeded that of the recent past....I did NOT say Ran, L., Jiang, H., Knudsen, K.L. and Eiriksson was global."
Stop playing games. If you want to argue that the the North Icelandic Shelf was hotter during the MWP than now, then say so. Don't pretend we're misrepresenting you when you talk about "warmth" in a hockey stick (northern hemisphere) temperature discussion. -
dana1981 at 09:12 AM on 17 May 2011Hockey stick is broken
Bud - the study you reference excluded data from the 20th century, aside from other problems. See the Notes section here.Response:[DB] Dana, I'm not sure the Notes sections are viewable to the public. If that is the case, the gist is this:
Summary and Conclusions [25]
The 20,000 year reconstructions presented in HPS97 utilized observations contained in a database of terrestrial heat flux measurements.
Data from the depth range 0– 100 meters, the depth range where most of the information about 20th century climate change resides, were excluded from the reconstruction because of noise considerations.
Thus the reconstructions derived from that dataset cannot be used to compare the Medieval Warm Period to changes taking place in the 20th century.
-
Bud at 09:06 AM on 17 May 2011Hockey stick is broken
Sorry, I did NOT say Ran, L., Jiang, H., Knudsen, K.L. and Eiriksson was global. No cherry picking by me. Knee jerk reactions by some of you though. -
dana1981 at 09:02 AM on 17 May 2011It's the sun
I'll probably do a post on this paper. To be fair, if the reconstruction is correct (which I don't think is plausible), it does suggest a very low climate sensitivity, so you could argue that climate models are wrong in that sense. Sensitivity would have to be in Spencer/Lindzen territory, below 1°C for 2xCO2 if this reconstruction is right. I don't think it's plausible, but should make for an interesting post. -
Bud at 08:57 AM on 17 May 2011Hockey stick is broken
@dana: In August 1997, Huang, Pollack, and Shen. Geophysical Research Letters. Using the borehole data, they reconstructed the temperature in the last 20,000 years. Their results are three curves based on different degrees of variation. Shown are a warm holocene climate optimum, a warm and pleasant period around 8,000 years ago that lasted for about 3 millenia, a cool period 2000 years ago followed by the medieval warm period 800 years ago which was also warmer than the present. http://www-personal.umich.edu/~shaopeng/97GL01846.pdf I will respond at length on physics elsewhere, so that perhaps I won't be deleted by the monitor of this blog.Response:[DB] Comments that are on-topic and formulated to comply with the Comments Policy receive no moderation. This, as always, applies to all participants here.
-
Stephen Baines at 08:47 AM on 17 May 2011It's the sun
Cole, Dana's right. I'm not sure you read that paper. In fig 4 there no net change in solar forcing since 1950. And why is the 30 year lag relevant? And what justification for 30 year lag other than " the oceans are vast and deep" do you have? -
Stephen Baines at 08:35 AM on 17 May 2011Hockey stick is broken
Sigh. I wonder if they read these things before they post. -
Albatross at 08:24 AM on 17 May 2011Hockey stick is broken
Sorry, I of course meant to say "GISP2", not "GIPS2" -
Albatross at 08:10 AM on 17 May 2011Hockey stick is broken
Dana, "For this paper, the North Icelandic Shelf does not represent the entire hemisphere or globe." Exactly--"skeptics" cherry picking again. They seem to never learn from their mistakes--i.e., the misrepresentation of the GIPS2 data. Also a recent paper by Thibodeau et al. (2010) shows that: "We conclude that the 20th century warming of the incoming intermediate North Atlantic water has had no equivalent during the last thousand years. " Just saying.... -
dana1981 at 07:58 AM on 17 May 2011It's the sun
Cole -"This paper shows the Models underestimate solar forcing by up to six times."
It does no such thing. The paper suggests that other TSI reconstructions underestimate the amplitude of TSI changes in the past. It has very little to do with climate models, and in fact specifically notes that their TSI estimates over recent decades, during which we have good measurements, are no different than previous TSI reconstructions. -
dana1981 at 07:54 AM on 17 May 2011Hockey stick is broken
Bud - what do you mean "once again"? There are no millenial reconstructions which show the MWP hotter than present. For this paper, the North Icelandic Shelf does not represent the entire hemisphere or globe. And the study concludes the sea surface on the North Icelandic shelf "was not as warm during the last century as during the Medieval Warm Period." It's not the last century anymore. And finally, the anthropogenic global waming theory is based on physics, not on being "unprecedented". The fact that the planet warmed naturally in the past doesn't change the physics that humans are causing warming now.
Prev 1732 1733 1734 1735 1736 1737 1738 1739 1740 1741 1742 1743 1744 1745 1746 1747 Next


