


 Arguments


Recent Comments
Prev 1760 1761 1762 1763 1764 1765 1766 1767 1768 1769 1770 1771 1772 1773 1774 1775 Next
Comments 88351 to 88400:
-
scaddenp at 15:21 PM on 28 April 2011Models are unreliable
A lot to learn here. For the attribution question, see Schmidt et al. There is two issue though. One is current state - how much of the greenhouse effect is attributable to each gas in their current concentration in the atmosphere. The other is what happens when change CO2. The other greenhouse gases do not stay in same concentration (especially water varies with temperature) so feedback must be accounted for. Temperature change affects albedo as well and to lesser extent aerosols so this is not a trivial calculation. Why would you suspect something about what you dont know? Firstly, the modelling is physical not statistical. Codes like calculating the absorption of GHGs are improved slowly but code write and rewrite happens all the time as computer speed allows more and more physics to be added to the model. Realclimate has a good FAQ on modelling; I suggest you read it, rather than suspecting. Milankovich is irrelevant to DO and there is a large literature on what the causes actually are. But relevance to modern climate is??? -
Marcus at 15:09 PM on 28 April 2011CO2 is plant food? If only it were so simple
"If Dawei is happy to put a big question mark over the greenhouse work then I'd argue that conclusions drawn from this in vitro work should be in the region of complete speculation. Nothing wrong with that either as long as it's well understood." Well, HR, that just proves how little you know about the relationship between In Vitro & whole organism biology. History has shown us that what occurs at a cellular level tells us a great deal about what will occur at the whole organism level. Greenhouse work, by contrast, only tells us about how an organism will survive in carefully controlled conditions. Once again it seems your "skepticism" only stretches to those things which contradict the propaganda of the Contrarian Movement. -
Marcus at 15:06 PM on 28 April 2011CO2 is plant food? If only it were so simple
"And "your side of the debate" seem to have given up on human ingenuity or forgotten that throughout human history our ancestors have been fighting those problems you list, and generally winning." Tell that to the hundreds of millions of people who are already going hungry-across the world-& they'll probably laugh in your face HR. What do you think the metric will be when ingenious-but costly-solutions to the problems caused by eCO2 & related global warming push the price of basic food-stuffs even *further* beyond their reach? Or what do you think will happen to the price of crops if we have more record breaking droughts, like those in Russia, or massive storms & flood damage to crops, like those here recently in Australia? What's going to happen to the price of crops when some of the most arable land is under half a meter of sea-water? Yet the way you & your ilk would have us believe, with your simplistic reasoning, eCO2 will bring about a New Age of Abundance-whereas the realists amongst us can see that what it will really bring is a whole mess of new problems, in quick succession, that even our most ingenious minds might not be able to solve in time &-even if they do-will come at the cost of much higher prices for staples-like wheat, rice & soy-beans. We realists also recognize that it will be much cheaper-in the Mid to long term-to simply *avoid* this eCO2 scenario altogether, rather than take the chance that the boffins can solve all the problems it will create in time. Still, I guess if your only concern is the profitability of the fossil fuel sector, then you'd be willing to take that chance. -
HumanityRules at 14:59 PM on 28 April 2011CO2 is plant food? If only it were so simple
25 KR I'm not hiding my head in the sand, I'm standing up against unrealistic pessimism. I suspect under your cloud of doom you can't see that. -
trunkmonkey at 14:55 PM on 28 April 2011Models are unreliable
According to NASA the greenhouse effect of CO2 is 10 w/m^2 or 20% of the total greenhouse effect. I don't know where they got this, if it contains feedback assumptions, or if it is just the net absorbtion at 385 ppm. My understanding is that NASA is the custodian of the GISS model. I have effectively zero knowledge of numerical modeling so I haave to treat the model as a black box. First they tell me that Co2 is only 20% of the greenhouse effect, and then they tell me that when they take this 20% out of the box GAT drops six degrees in the first year. I have been lead to believe that the model was tested using hindcasting. I suspect that much of the source code was written before the ice cores were drilled.I assume (this is the weakest, honestly) that during this hindcasting the presumption was that CO2 had temperature on a leash. My suggestion is that until we discovered how much easier life can be if we burn that nasty black stuff, temperature had CO2 on a leash. Apologies for the excessive breadth of 339. I don't really believe in the "cycles". It's just how they are commonly referenced. The tendency on this website has been to say that because there is spectral significance for precessional cycle in the first half of the Pleistocene and eccentricity in the second half, that paleoclimatology is a done deal and it's all Milankovitch. Milankovitch is irrelevant in both the millenial DO and the billion year "cycles". I believe these "cycles" are actually more like the ENSO. -
HumanityRules at 14:54 PM on 28 April 2011CO2 is plant food? If only it were so simple
8 SNRatio In general I've got no real problem with this article other than it has a bias towards the most pessimistic conclusions. For example "This effect may potentially nullify some of the gains expected from excess CO2 in these plants." Much of the work supporting this is in vitro work performed on isolated enzymes. That is, it's not even in the plant. Earlier Dawei rightly critised greenhouse work for not well representing the real world. How well to you think a couple of isolated enzymes in a tube represent the real world? There is nothing wrong with this scientific approach, it's getting us a basic understanding of these enzymes but it's a long stretch to Dawei's conclusion from this work. If Dawei is happy to put a big question mark over the greenhouse work then I'd argue that conclusions drawn from this in vitro work should be in the region of complete speculation. Nothing wrong with that either as long as it's well understood. In the meantime all the reports of field trials still seem to show increased CO2 is either beneficial or at worst neutral to crop growth that still doesn't seriously undermine the idea of CO2 is plant food idea. -
CO2 is plant food? If only it were so simple
HumanityRules - "human ingenuity " and "our ancestors have been fighting those problems" are no excuse for short-sightedness, or hiding our heads in the sand while the tidal wave crests. Which, by dismissing the severity of global warming and it's impact on our lives, 'skeptics' appear to endorse. -
scaddenp at 14:39 PM on 28 April 2011Antarctica is gaining ice
Ryan, try taking arctic comments to arctic sea ice melt is a natural cycle -
scaddenp at 14:31 PM on 28 April 2011Antarctica is gaining ice
Wow - trotting out the old submarine photo. It's in a polynya! For evidence of part arctic sea-ice, see arctic sea ice threads. You can find pointers to the relevant papers on past sea-ice seasonal limits there. -
HumanityRules at 14:31 PM on 28 April 2011CO2 is plant food? If only it were so simple
7 Marcus And "your side of the debate" seem to have given up on human ingenuity or forgotten that throughout human history our ancestors have been fighting those problems you list, and generally winning. And all that without even knowing Rubisco Activase existed. Not a utopian but certainly a believer in the human spirit, I'd rather that than an utter pessimist. I'm not here to paint utopian visions just to counter unnecessary pessimism. I'm a molecular biologist. Give me a grant of a few hundred thousand dollars and a few research scientists and I'll give you 500 new versions of Rubisco Activase, or more if you want. Give me another ten years funding and I'll give you a field trial on x number of genetically modified crops with a new Rubisco Activase gene. There are always solutions to problem. ( -Questioning of motives snipped- ).Moderator Response: [DB] Don't go there. -
Philippe Chantreau at 14:26 PM on 28 April 2011Cosmic ray contribution to global warming negligible
Further correction Arch (sorry, it needs to be said): The particles generated by GCR are too small to act as CCN. A plausible mechanism for particle growth is the physical process lacking to give weight to the hypothesis. -
adelady at 14:21 PM on 28 April 2011CO2 is plant food? If only it were so simple
20 Marcus ".. changes in sowing times are a poor simulation of the kinds of conditions being predicted .." Yes, I noticed that. I realise that it's very limiting trying to do these experiments in the open air - and the equipment budget was probably entirely swallowed by the CO2 delivery and monitoring systems - but temp changes, (un)seasonal conditions and precipitation unreliability need attention. Who cares if the plants themselves do better if crops are ruined by two weeks of wet/ hot/ windy/ plague conditions just before harvest? I've seen grown men bravely blink away tears over rust ruining a thriving wheat crop - and that was a long time ago. Rust one year, locusts the next - following several drought years, makes Hanrahan look hopeful. -
RyanStarr at 14:09 PM on 28 April 2011Antarctica is gaining ice
Muoncounter, we've always had and always will have seasons, climate change isn't changing that. Look at photo above showing March and September extents for both the Arctic and Antarctic. Point me to some evidence which shows arctic ice extent used to be a more static quantity than it is now. I recall a picture from the 50s showing a submarine poking through slush at the north pole. -
RyanStarr at 13:57 PM on 28 April 2011Antarctica is gaining ice
@ 80 "...rising ocean temperatures have cleared out sea ice.." Cleared out sea ice in Antartica? You need to read the article above, it attempts to explain why the observed rising sea ice in Antartica can occur in a warming climate. -
Ian Forrester at 12:29 PM on 28 April 2011CO2 is plant food? If only it were so simple
Grain quality is decreased under high Co2 concentrations:Based on the modified physiology and biochemistry of wheat plants under CO2 enrichment, the concentration of total protein in grain was significantly decreased by 7.4% in the FACE treatment. The reduction in grain protein due to elevated CO2 is consistent with previous reports (Kimball et al. 2001; Taub et al. 2008; Wieser et al. 2008; Ho¨gy et al. 2009), resulting in potentially far-reaching consequences for the nutritional value and use by the processing industry........... ....Among the grain proteins, the N- and glutamine-rich gliadin fraction was significantly decreased under CO2 enrichment, thereby lowering the gluten concentration that is fundamental in determining physical properties of dough formation and product quality
-
jyyh at 11:59 AM on 28 April 2011CO2 is plant food? If only it were so simple
A complex subject, and good overview (with citations). -
muoncounter at 11:52 AM on 28 April 2011Cosmic ray contribution to global warming negligible
arch #43: "significant more (and more convincing) evidence that it does not." I suppose that depends on what it takes to convince. We're now far enough from the solar min to make some observations. From Mewaldt et al 2010: In the energy interval from ~70 to ~450 MeV nucleon–1, near the peak in the near-Earth cosmic-ray spectrum, the measured intensities of major species from C to Fe were each 20%-26% greater in late 2009 than in the 1997-1998 minimum and previous solar minima of the space age (1957-1997) ... Cosmic-ray intensity variations at 1 AU are found to lag IMF variations by 2-3 solar rotations That rotation period is 27 1/4 days, as viewed from earth. So the maximum lag, if any, is less than 90 days. According to the model, these elevated GCR intensities should make more clouds. Do 2009-10 or 1997-98 appear to be cloud-cooled? From tamino's adjusted GISS temperature graph ("we remove the el Nino, volcanic, and annual-cycle signals we have what we’ve called the adjusted GISS data"),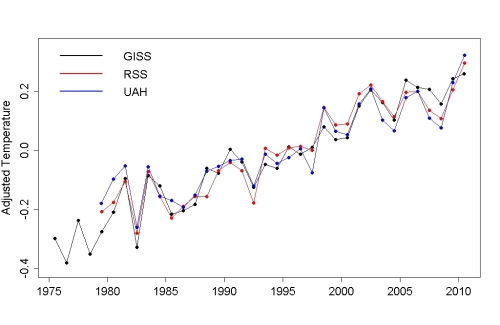 To summarize (with apologies to Sondheim),
And where are the clouds?
There ought to be clouds.
Well, maybe next year.
To summarize (with apologies to Sondheim),
And where are the clouds?
There ought to be clouds.
Well, maybe next year.
-
Marcus at 11:44 AM on 28 April 2011CO2 is plant food? If only it were so simple
"Trials to ascertain the effect of lower CO2 levels see reduced growth, growth apparently almost ceasing around 180ppm, however these obviously have to be conducted in enclosures." Which is ultimately a straw-man anyway, given that the odds of us ever experiencing CO2 concentrations of less than 200ppm are absolutely zero. The fact is that changes in sowing times are a poor simulation of the kinds of conditions being predicted when atmospheric CO2 levels really reach 560ppm-as I've said many times before. As I recall, though, the seed yield increases under those conditions (Rain-fed, slightly warmer) were negligible (when standard errors are accounted for) compared with ambient CO2-& at a cost of reduced nitrogen uptake under those conditions. Of course, other results from FACE trials show that enriched CO2 conditions favor an increase in certain soil-borne pathogens, increase the competitiveness of weeds & make plants more susceptible to attack by insect pathogens. All of which suggest, as I've said before, that the "CO2 is plant food" meme is *dangerously* simplistic. -
arch stanton at 09:47 AM on 28 April 2011Cosmic ray contribution to global warming negligible
Okay ;-) There is evidence that GCRs can trigger particles that can act as cloud condensation nuclei. There is little evidence that this has any influence of our climate, and significant more (and more convincing) evidence that it does not. Better? -
Ken Lambert at 09:07 AM on 28 April 2011Lindzen Illusion #1: We Should Have Seen More Warming
dana1981 Perhaps you could explain to the readers how an imbalance of 1.5W/sq.m at the surface becomes 0.9W/sq.m at TOA and still complies with the first law. -
CO2 effect is saturated
Berényi - I will also note that incorrectly using a graph from Anderson 2004 does not invalidate either Griggs 2004 or Chen 2007 (referenced in the original post), which fully support Harries 2001. The changes in TOA spectra over the satellite era from increasing CO2 are detectable, as predicted by modeling, and indicate that CO2 is not saturated. -
CO2 effect is saturated
Berényi - Several points from those two papers. - From Anderson 2004, final comments: "...there is an increase of greenhousegases from 1970 to 1996 that gives rise to recognizable bands in the observed spectrum." - Anderson makes no claims about invalidating Harries, and in fact notes/thanks him in the Acknowledgements. - Most importantly; Anderson's spectra are not corrected for global warming, to the equivalent black body temperatures. Anderson is showing the raw differences between the two satellite spectra with some fairly impressive corrections added. But this is not corrected for the equivalent black-body spectra (Brightness Temperature) as Harries did, and hence does not show what you claim it does. It would be stunning if there was no difference in IR spectra over 25 years given warming. But your superimposition of Harries black-body corrected spectra over raw differencing is invalid. The elephant has put on weight - but you can't compare that directly to a chart of how it's proportions have changed. -
johnd at 08:32 AM on 28 April 2011CO2 is plant food? If only it were so simple
Martin at 04:22 AM, the FACE trials that concentrate on food crops best replicate real world conditions regarding pests and diseases in that they are conducted alongside control plots generally in zones where the crops that are being trialled are normally grown. Rainfall and temperatures are replicated by changing the time of sowing, or by conducting parallel trials of the same varieties in areas that are warmer and drier than the main trial site. Such areas are readily identified from historic records and may only be a couple of hundred km away. Trials to ascertain the effect of lower CO2 levels see reduced growth, growth apparently almost ceasing around 180ppm, however these obviously have to be conducted in enclosures. Commercial greenhouse growers do have some knowledge of these effects having noted different zones of growth depending on how even CO2 circulation is within the enclosed area, being quickly depleted in those areas least exposed to the extra CO2 introduced, and not able to be replenished as occurs in the open air, but sometimes due to unintended leaks of air from outside do illustrate side by side, how the various concentrations manifest themselves in varying degrees of growth. As far as optimal CO2 levels, commercial greenhouse growers where CO2 enrichment has been utilised for several decades, tomatoes being perhaps the main, but just one of the foods you may have been eating all those years, find the optimal level is about 1200ppm. Whether that is optimal for growth or optimal for economic returns I'm not sure. In commercial cropping, most fertilisers are applied at rates that find the best balance of offsetting the cost of applying the fertiliser against the anticipated increased returns it will provide, so it is almost always a commercial decision, based on the law of diminishing returns. However as far as absolute growth is concerned, application rates for many commonly applied fertilisers more than double the normal rates will still see some growth response over lower rates. -
Philippe Chantreau at 08:03 AM on 28 April 2011Cosmic ray contribution to global warming negligible
Actuall, Arch, there is really little evidence to support the hypothesis that GCR affect cloud cover. There is some evidence, but there is little of it and, so far, no confirmed physical process. -
Berényi Péter at 07:40 AM on 28 April 2011CO2 effect is saturated
For your convenience I have merged Fig. 1. Harris 2001 into Fig. 8 (a) Anderson 2004. It is easier to compare them this way (click to enlarge). Between 1970 and 1996 atmospheric CO2 concentration as measured at the Mauna Loa Observatory has increased from 325.68 ppmv to 362.35 ppmv.
-
Bob Lacatena at 06:59 AM on 28 April 2011Clouds provide negative feedback
154, RW1,...there is really no physical or logical reason why the net cloud feedback would suddenly switch...
But there is. You're just denying that it exists. Hint: Go to the top of this web page and actually read the post. -
Berényi Péter at 06:57 AM on 28 April 2011CO2 effect is saturated
#152 KR at 00:37 AM on 28 April, 2011 But there is no uncertainty in the fact that CO2 is not saturated at current concentrations. Here is later study applying an improved algorithm. Journal of Quantitative Spectroscopy and Radiative Transfer Volume 85, Issues 3-4, 15 May 2004, Pages 367-383 doi:10.1016/S0022-4073(03)00232-2 Absolute, spectrally-resolved, thermal radiance: a benchmark for climate monitoring from space J. G. Anderson, J. A. Dykema, R. M. Goody, H. Hu & D. B. Kirk-Davidoff Compare it to the obsolete one referenced in the article above from Harries 2001
 Anderson et al. say the best estimate is the red curve (dof-wtd cells). Pay careful attention to the differences. Measured CO2 effect can be seen close to the left edge of both figures. The difference between the wavenumber 750-900 cm-1 range and wavenumber 710 cm-1 is about 1.5 K in both figures, but in the improved analysis it turns out only 0.4 K is due to decreased OLR intensity in the CO2 wing, while there is a 1.1 K increase in the low frequency (most transparent) part of the atmospheric window.
As surface temperature between 1970 and 1996 increased less than that (and temperature in the mid-troposphere even less), it can only mean photosphere height in this spectral range decreased during this period. It is consistent with balloon radiosonde data, which show decreasing atmospheric specific humidity above the 700 mbar level (while it was increasing closer to the surface).
There is an even more striking difference between the two analyses above the O3 absorption line, in the high frequency part of the atmospheric window. According to Anderson at al. brightness temperature anomaly here is 1-1.5 K less than at lower frequencies (while Harries puts them about to the same level).
The same is true for the relative depths of the CO2 and CH4 notches.
All this boils down to the conclusion that while the CO2 effect may not be fully saturated at the wings, it is almost negligible compared to methane (which is not saturated) and is counteracted to a considerable degree by water vapor (negative feedback).
Anderson et al. say the best estimate is the red curve (dof-wtd cells). Pay careful attention to the differences. Measured CO2 effect can be seen close to the left edge of both figures. The difference between the wavenumber 750-900 cm-1 range and wavenumber 710 cm-1 is about 1.5 K in both figures, but in the improved analysis it turns out only 0.4 K is due to decreased OLR intensity in the CO2 wing, while there is a 1.1 K increase in the low frequency (most transparent) part of the atmospheric window.
As surface temperature between 1970 and 1996 increased less than that (and temperature in the mid-troposphere even less), it can only mean photosphere height in this spectral range decreased during this period. It is consistent with balloon radiosonde data, which show decreasing atmospheric specific humidity above the 700 mbar level (while it was increasing closer to the surface).
There is an even more striking difference between the two analyses above the O3 absorption line, in the high frequency part of the atmospheric window. According to Anderson at al. brightness temperature anomaly here is 1-1.5 K less than at lower frequencies (while Harries puts them about to the same level).
The same is true for the relative depths of the CO2 and CH4 notches.
All this boils down to the conclusion that while the CO2 effect may not be fully saturated at the wings, it is almost negligible compared to methane (which is not saturated) and is counteracted to a considerable degree by water vapor (negative feedback).
-
John Bruno at 06:23 AM on 28 April 2011CO2 is plant food? If only it were so simple
Great post! Iv'e been waiting to see a sophisticated treatment of this. As even the comments make clear, this is a complex issue as it involves not only the factors limiting plant productivity and biomass but also plant consumers and more broadly food webs. Community ecology is a messy business! One issue not really addressed by the post, although touched on in the comments, is how warming will increase plant pathogens and general rates of herbivory. Plenty of work supports the first prediction and the latter is a simple function of physiology: warming increases insect metabolism and thus metabolic demands. Plant photosynthesis also responses positively to increasing temperature, but at a slightly lower rate, eg, see this paper and this summary of it. The end effect, all things being equal and assuming nutrients and water are available, is more primary production and less plant biomass. Of course if you consider what limits insect (and other grazer) populations, things get a lot more complicated; it often isn't plant tissue but rather minerals, disease, weather, climate and predators. Martin #16, I personally don't believe it is possible to generalize like that (ie, is more or less CO2 "better" for all crops) but you can be sure a warmer world will have more plant disease and likely more plant consumption. -
scaddenp at 06:22 AM on 28 April 2011Models are unreliable
There is a difference between "this is unexplained" and "there are multiple explanations and current data doesnt constrain them". "nothing we have comes close to explaining the three things" What??? I really dont get this. You invoke million year and 200 million year "cycles" which are controversial to call cycles. I dont actually see anything in any your points which challenge current climate science. There are multiple possible explanations, none applicable to current warming. And yes, perhaps we have missed something but the energy flow to produce current warming shouldnt be hard to miss. Meanwhile we have perfectly good physical theory which accounts for we see and ignoring that while looking for something fanciful seems like extremely poor risk management to me. -
CO2 is plant food? If only it were so simple
Martin asks a good question. I think this post shows that any rapid change in CO2 is a disturbance that will have complex and numerous effects. Humans can disturb the CO2 level upward faster than natural changes can (barring rare events). I would like to add a question to Martin's: Are there any drawdowns of CO2 that are as fast as the anthropogenic increase? I can't think of a mechanism that would sustain a rapid reduction. I have to dig through my notes to find it, but I remember reading about a theory that the drawdown of CO2 leads to a state where forest die, which in turn reduces the rate that global forests sequester CO2, allowing atmospheric levels to rise. In other words, low CO2 invokes a reverse feedback effect. I'll hunt for that reference. jg -
arch stanton at 04:56 AM on 28 April 2011Cosmic ray contribution to global warming negligible
HR @ 27: The number of citations is an interesting metric. The AR4 cites Svensmark several times in their discussion about why the GCR hypothesis is not likely responsible for the observed climate change. Anyone refuting a paper should cite it. arch -
arch stanton at 04:23 AM on 28 April 2011Cosmic ray contribution to global warming negligible
Humanity Rules @25: Don’t quote me out of context. Why would you do such a thing? (Rhetorical question- just think about it). What I said was: “I admit that it is an interesting hypothesis, but only folks highly selectively biased by personal belief could possibly believe that galactic cosmic rays have a climate effect greater than that of the change we have seen in atmospheric CO2 levels. Little in the scientific literature supported it then and even less does now.” I never said there was little evidence to support the fact that CR may affect cloud cover. Indeed there is. What is lacking is substantial evidence that the changes in cloud cover are significant enough to affect climate to a degree greater than (anthropoid changes in) CO2 does. I thought this summary was a good one when it came out 2006 at the start of the CERN CLOUD experiments. I think it still is. HTH, arch -
Martin at 04:22 AM on 28 April 2011CO2 is plant food? If only it were so simple
I'm not quite sure whether I have correctly understood your post. Have there been experiments which include changes in CO2, temperature, water, competing plants (weeds) and pests? Another question: If the effects of higher CO2 are on balance negative, would a lower CO2 be better? Are there any experiments from which one can conclude what an optimal CO2 level would be for the world's major crops? -
CO2 is plant food? If only it were so simple
Excellent post! I would nit-pick at you choice of words in the paragraph: "Only recently have researchers begun to pull away from these controlled settings and turn their attention to outdoor experiments." I would say that the experiments aren't recent; rather, they were started some time ago but it takes several years before the results can be reported, and the results are recent. Back to the main idea, I've often replied to "CO2 is plant food" by saying "yes, where CO2 is a limiting nutrient" and these same people usually have irrigated and fertilized lawns and gardens but never thought of trying to add CO2. I also like to point out the tree-topped mountains where I live, and ask why do the trees grow up there and not on desert and chaparral? For the thinner air? Reading your post, I'm beginning to think my "where CO2 is limiting" response is too simple. Rising CO2 affects plant growth whether it is or isn't a limiting nutrient. thanks, jg -
muoncounter at 02:49 AM on 28 April 2011Cosmic ray contribution to global warming negligible
Going off-topic for a moment. Seems like we have bigger things to worry about than the 'ideologically motivated' demise of GCR/climate research. the House of Representatives proposed budget includes no replacement for the NOAA polar orbiting weather satellites. -
dhogaza at 02:28 AM on 28 April 2011Cosmic ray contribution to global warming negligible
"Those that seem to want to kill the CGR/climate connection are as ideologically motivated as the worst sceptics" Yeah, that's why we insist that the GCR/climate connection violates the 2nd law of thermodynamics, just like certain skeptics insist that radiative transfer theory does. /snark -
Chris G at 02:24 AM on 28 April 2011CO2 is plant food? If only it were so simple
This is a good article. I would come at it from a different angle. Greenhouse studies are not a good indication of a real world scenario; most people agree on this. FACE studies are a bit better, and show less improvement from CO2 enhancements than greenhouse studies. But if you want a more accurate reflection (although still not perfect) of how CO2 increases will affect crop plants in the real world, you have to account for the shifting climate zones. For instance, you try growing crop varieties commonly used in Missouri, but try to grow them in central Texas, adding all the CO2 you want. Anyone want to bet on whether the results will continue the downward trend on yield improvements seen in moving from greenhouse to FACE? -
dana1981 at 01:51 AM on 28 April 2011Lindzen Illusion #1: We Should Have Seen More Warming
KL #94: top of the atmosphere energy imbalance is not the same as radiative forcing at the surface. -
Charlie A at 01:41 AM on 28 April 2011CO2 is plant food? If only it were so simple
The article states "FACE studies...; unfortunately, the results of these studies are not nearly as promising as those of greenhouse studies, with final yield values averaging around 50% less in the free-air studies compared to greenhouse studies " In looking at the reference cited, it's clear that the article should state that the "with the INCREASE in final yield values averaging around 50% less in ..... " As the first reference ( Leaky et al. 2009 provided in that section of the article says, there are 6 important lessons learned from FACE studies: "First, elevated CO2 stimulates photosynthetic carbon gain and net primary production over the long term despite down-regulation of Rubisco activity. Second, elevated CO2 improves nitrogen use efficiency and, third, decreases water use at both the leaf and canopy scale." ..... (read the article to see the rest) So CO2 is not only a plant food, but it also decreases water use and improve the efficiency of nitrogen use. -
Philippe Chantreau at 01:36 AM on 28 April 2011Cosmic ray contribution to global warming negligible
HR: "Applied science is never based on one piece of evidence and an idea is never dismissed because one piece of the puzzle still eludes us." Curiously, that is exactly what some regular skeptic contributors have suggested when they protested against the larger picture type of concept. I will make sure to cite you when running into attempts to do exactly that by so-called climate skeptics. I know it won't be long until it happens. In this case, it can be reasonably argued that the physical mechanism is more than just "one piece of the puzzle." "that's funny." Why? "The necessary experiments" is exactly what CERN's CLOUD program is all about. You know, that darn government-run, public-money scientific research thing. So far the only truly clear result is that the chamber walls overwhelm whatever other effect could possibly exist. Now, whomever is running the program must manage to get money to continue it. It may be decided that CERN's priorities are elsewhere and I wouldn't venture to emit a judgement on the issue if it happens. I'm sure there are countless people better qualified than me to say how CERN should allocate resources. However, your snark is unwarranted. I'm all for understanding nature, even that part. -
LazyTeenager at 01:29 AM on 28 April 2011Lindzen Illusion #1: We Should Have Seen More Warming
Ken Lambert at 95 says This should not be a cause of the abuse and denegration of any scientist as long as the opinions held are honest and in good faith. Error is not a crime. ----------- I agree. But: Lindzen has written one newspaper article, if memory serves,.that abuses and denigrates other scientists, so maybe you should explain this to Lindzen. Lindzen is often presented as an authority, which means he should check his facts and not dogmatically communicate the same wrong information over and over again. Science is a collective enterprise, so the tendency to claim yourself as correct and everyone else as wrong, incompetent or dishonest is not a valid position. If Lindzen is propagating information which is in error, people should be able to explain why without having their own motives impugned. -
Albatross at 01:24 AM on 28 April 2011CO2 is plant food? If only it were so simple
Pete @10 raises a very interesting point. It could be that elevated CO2 creates more biomass to burn in a warmer world. -
Albatross at 01:14 AM on 28 April 2011Lindzen Illusion #1: We Should Have Seen More Warming
Re "Lintzen is plumbing for the low end, others the high end." @94, I do agree that Lindzen is aiming for the low end alright (< 1 K), in the very tails of the probability distribution function for climate sensitivity in fact. Lindzen is an outlier in more than one sense-- we are still waiting for his mystical negative cloud feedback mechanism to kick in, while evidence to the contrary continues to mount. Not sure who the "others" are in the above quote, but the IPCC is actually stating the middle ground for climate sensitivity at 3 K, and that is derived using data from multiple independent lines of evidence and studies (e.g., Knutti and Hegerl 2008). To be high they would have to be calling for a climate sensitivity greater than about 4.5 K (see Annan and Hargreaves 2006, for example), and a paper by them in 2009 came to a similar conclusion supporting a most likely climate sensitivity near +3 K. See also Knutti et al. (2006). SkS continues to be an excellent source for genuine scientific information and a beacon of light in a "debate" often filled with invective, vitriol and hyperbole. Unfortunate then that contrarian posters have taken it upon themselves to try and ruin has become a valuable pedagogical tool. -
CO2 effect is saturated
Berényi - The only difference between those two phrases is in which you would use in polite company. Both indicate data made up, manufactured, in order to prop up an argument. Given that Trenberth 2009 is described as an update to Kiehl and Trenberth 1997 (see Trenberth 2009, second paragraph, for the reference), that is the very first location to look for items not discussed in detail in Trenberth 2009. I therefore consider your language here unwarranted. "Somewhat ad hoc" is a reasonable description given the 1997 paper. However, this does not address the underlying issue of using a summary, one that has been adjusted for internal consistency, in place of a GCM. From the 1997 paper, page 10: "The values put forward in Fig. 7 are reasonable but clearly not exact. The purpose of this paper is not so much to present definitive values, but to discuss how they were obtained and give some sense of the uncertainties and issues in determining the numbers. Several quantities in Fig. 7 are not adequately measured to pin them down as much as desirable, and the global climate models are not yet good enough to justify refining the estimates here, which are based on a much simpler but appropriately tuned and observationally constrained radiation model. By putting all the estimates together, however, the fact that the total heat budget at both the surface and the top of the atmosphere has to balance and all the components add up is a considerable constraint and lends some confidence to the values assigned. Regardless of the errors assigned to each component, the fact that the components sum to zero means some errors must cancel." (emphasis added) The 2009 paper has improved data, fewer uncertainties, but this is still a constrained summary and overview, not in itself a GCM. The biggest, most powerful constraint is that everything has to add up, and that "...some errors must cancel". Now back to the subject matter of this thread. There are definitely uncertainties in cloud absorption, much smaller uncertainties in water vapor distribution. But there is no uncertainty in the fact that CO2 is not saturated at current concentrations. -
Ken Lambert at 23:46 PM on 27 April 2011Lindzen Illusion #1: We Should Have Seen More Warming
"The IPCC 95% confidence range puts the total net anthropogenic forcing at 0.6 to 2.4 W/m2 (Figure 1)." and "For example, Hansen et al. have a new draft paper out which puts the aerosol forcing at -1.6 W/m2. CO2 levels have continued to rise since the IPCC report, and the CO2 forcing is now 1.77m W/m2. If we incorporate these figures, the most likely net forcing value becomes 1.5 W/m2" But of course Dr Trenberth says that the net forcing is actually 0.9W/sq.m NOT 1.5W/sq.m when the 'CLIMATE REPONSES' are taken into account. Surely this is enough of an indicator of the wide range of potential NET forcing to make a similarly wide range of temperature rise outcomes. Lintzen is plumbing for the low end, others the high end. This should not be a cause of the abuse and denegration of any scientist as long as the opinions held are honest and in good faith. Error is not a crime. The tone and quality of debate on this site has deteriorated since Moderators were appointed { - snip -}Moderator Response: [muoncounter] Complaints about moderation snipped. You know the rules; when you don't follow them, you have no one but yourself to blame. -
Waste heat vs greenhouse warming
RSVP - The difference in TOA effects between AHF (more coming in) and greenhouse gases (less energy going out) is very clear. Think of a pot on a stove. Adding AHF is equivalent to turning up the burner. The stew gets hotter, more steam comes out, it recovers equilibrium (stops changing temperature) when in = out. GHG's are equivalent to putting a lid on the pot, reducing outgoing energy. Less steam comes out, the stew gets hotter, it recovers equilibrium when in = out. Even leaving aside the small matter (!!!) of two orders of magnitude difference in energy as you wish to, the decreased TOA IR demonstrates that the primary cause of global warming is a reduction in energy loss to space, not an increase in energy fed into the climate. AHF therefore cannot be the primary cause of global warming. Your fixation on this in the face of logic, numbers, and physics is most unfortunate. -
Phil at 22:57 PM on 27 April 2011CO2 is plant food? If only it were so simple
HR @6 I still don't get why 'CO2 is plant food' is not a good general point to make Two reasons: 1. the implication of your statement is that from this it automatically follows that the agricultural yield of the planet will increase with higher levels of CO2. As Pete Dunkelberg points out @10, there are missing, more questionable steps in that argument 2. Your statement can have the implied follow-on "so therefore is nothing dangerous about CO2" which, as I'm sure you're aware, has all kind of logical fallacies attached to it. Changes to commodity prices over recent history don't suggest any beneficial effect on crop yields yet! (I accept, obviously, that this is somewhat crude measure) -
Pete Dunkelberg at 22:22 PM on 27 April 2011CO2 is plant food? If only it were so simple
Try a full accounting of plants vs CO2 at 550 ppm. With tundra and rain forest converting to more CO2 and even temperate plants succumbing to wildfire, and crops in broad continental interiors failing due to heat waves, it looks like CO2 turning existing plants into more CO2 rather than vice versa ;) At any temperature, what humans need is not "plant food" but "people food". All us animals need protein, which requires nitrogen. Plants can not turn carbon into nitrogen. Legumes with their nitrogen fixing bacteria may be able to produce more protein given more CO2 and genetic engineering may help other crops to use nitrogen for protein more efficiently but first these plants have to beat the heat. Good luck on that. -
witsendnj at 22:17 PM on 27 April 2011CO2 is plant food? If only it were so simple
I am delighted to see this topic receive more nuanced attention as it is generally neglected. We are indeed engaged in a vast experiment that has veered out of control, whereas even the best scientists barely understand all the complex ramifications to plantlife. I would venture to say that we are well behind the curve even compared to the relatively recent revelations about ocean acidification, as far as comprehending the cascading effects in the terrestrial ecosystem by altering the composition of the atmosphere. The consequences of dying trees - losing an essential CO2 sink and the production of oxygen, not to mention habitat for countless species - are at least as dire as losing coral reefs, pteropods and phytoplankton. It has so far been impossible to remove existing ambient background levels of tropospheric ozone for controlled experiments on trees and because of this, the long-term impacts are generally ignored. It's kind of like sea level rise - everyone knows it's going to be far higher than IPCC predictions based solely on thermal expansion, but because there is too much uncertainty in modeling the rates of melting ice sheets, it is simply left out of the predictions. Fine - that's science. The same is true for trees. Anyone the least familiar with ozone knows it is toxic to vegetation, and knows the background levels are inexorably rising. But because no one has been interested or, perhaps, had the funding to do a gigantic, enclosed, decades-long experiment comparing trees growing with pre-industrial levels (basically zero) to today's (anywhere from 40 ppb to 80 or more) we act as though there is nothing significant to worry about. And yet in the real world, in this uncontrolled experiment, it is easy to ascertain that trees everywhere are dying, and at a rapidly accelerating rate. This is true for trees of all species, in all habitats - even young trees being watered in nurseries. Their decline is chalked up to all sorts of other opportunistic causes - insects, disease, fungus, drought, road salt, natural gas line leaks, climate change and on and on. But there is an immense, global pattern here which is attributable to the one thing that trees everywhere share in common - the atmosphere, which is poisonous, and to which they are exposed season after season. They have the tree equivalent of AIDS, a compromised immune system. It has been my hope for years that someone with scientific credentials will reveal this existential threat before we lose the ability to preserve seeds and nuts. This article is a great leap forward, with a number of excellent references - there are many more links to published research collected at the top of my blog, http://witsendnj.blogspot.com/ -
SNRatio at 21:10 PM on 27 April 2011CO2 is plant food? If only it were so simple
#6 HR. In a sense, H2S is the "closest" relative to H2O, and it can surely be useful. Why, then, don't we praise its presence as a source of sulfur, which is biochemically essential? When we talk generally about different substances, we do of course refer to their effects in general. This post is a general, balanced account of CO2, or you should at least acknowledge that it is a good and honest try at that.


Prev 1760 1761 1762 1763 1764 1765 1766 1767 1768 1769 1770 1771 1772 1773 1774 1775 Next


